Extension of ITU-T P.1203 model to Tile-based Omnidirectional Video Streaming
←
→
Page content transcription
If your browser does not render page correctly, please read the page content below
https://doi.org/10.2352/ISSN.2470-1173.2021.11.HVEI-161
                                                                                          © 2021, Society for Imaging Science and Technology

Extension of ITU-T P.1203 model to Tile-based Omnidirectional
Video Streaming
Yuichiro Urata, Masanori Koike, Kazuhisa Yamagishi, Noritsugu Egi and Jun Okamoto; Nippon Telegraph and Telephone Corpora-
tion (NTT); Tokyo, Japan

Abstract                                                                curs due to the throughput being reduced and the buffer being
      Omnidirectional video (ODV) streaming has become                  depleted [12, 13]. To develop a quality-estimation model, these
widespread. Since the data size of ODV is extremely large, tile-        quality-influencing factors need to be taken into account.
based streaming has been developed to compress the data. In this              To monitor the quality of tile-based ODV streaming services
coding technology, high-quality tiles encoded at a higher bitrate       at end-clients, this paper proposes extending ITU-T Recommen-
for the users’ viewing direction and low-quality tiles encoded at       dation P.1203 mode 0 model (hereafter, P.1203 model), which is
a lower bitrate for the whole environment are sent to the client,       used to estimate the quality of 2D video streaming services, to
and a player decodes these tiles. As a result, quality degrades         tile-based ODV streaming services by taking into account quality
due to coding, streaming, and the client’s buffer. Therefore, to        degradations due to the display of low-quality tiles. Concretely,
provide high-quality tile-based ODV streaming services, quality-        three types of model are investigated: model A) information about
of-experience needs to be monitored by comprehensively evaluat-         high- and low-quality tiles and the delay is taken as input, model
ing the quality degradations. By taking into account the quality        B) information about high and low-quality tiles is taken as input,
degradation due to the low-quality tiles, the ITU-T Recommenda-         and model C) information about only high-quality tiles is taken
tion P.1203 model, which can be used for monitoring the quality         as input. Two subjective quality-assessment experiments are con-
of 2D video streaming services, is extended to tile-based ODV           ducted to compare the quality-estimation accuracy of the three
streaming services. Our model is demonstrated to estimate qual-         models.
ity with sufficiently high accuracy.
                                                                        Related work
Introduction                                                                In this section, issues of conventional quality-estimation
       Due to advances in camera, display, and video-processing         models for tile-based ODV streaming are described, and ITU-
technologies, omnidirectional video (ODV) streaming services            T Recommendation P.1203, which is the base of the proposed
have recently become widespread. Although ODV provides a                model, is explained.
highly immersive viewing experience, it has a larger amount of
data than 2D video. Therefore, during the streaming, image-             Conventional quality-estimation models
quality degradation due to coding, and quality adaptation and                In 2D video, many quality-estimation models have been pro-
stalling often occur due to the throughput being reduced and the        posed [14, 15, 16, 17, 18] and ITU-T Recommendation P.1203
buffer being depleted. To monitor the normality of a service, the       was standardized [19, 20, 21], where the P.1203 model is de-
quality at end-clients must be monitored. To do that, a quality-        scribed in the next sub-section.
estimation model needs to be developed.                                      Alberti et al. [14] proposed a quality-estimation model that
       To reduce the bitrate in ODV, tile-based streaming has been      takes the bitrate, framerate, quantization parameter (QP), stalling
proposed [1, 2] and standardized [3], as shown in Fig. 1. In tile-      frequency, stalling average duration, and quality change rate as in-
based streaming, high- and low-quality tiles are streamed to a          put. The first and last three are the parameters used for estimating
head-mounted display (HMD). The entire image is divided into            short- and long-term quality, respectively. Tran et al. [15] pro-
multiple tiles for creating high-quality tiles, which are basically     posed a quality-estimation model that takes encoding parameters
displayed on the HMD, and the entire image is downsized to low-         such as QP, frame rate, or resolution. Duamu et al. [16] proposed
quality tiles with a smaller resolution than the original and is dis-   a quality-estimation model for estimating encoding quality by us-
played on the HMD when users change their viewing direction             ing full reference models and evaluating the effect of stalling and
(i.e., viewpoint). The quality of high- and low-quality tiles de-       the temporal effect on quality by pooling strategies on the basis
pends on the employed resolution, framerate, and bitrate, like 2D       of an auto-regressive model. However, when quality is estimated
video streaming or non-tile-based ODV [4, 5]. In addition, the          at end-clients, the models using bitstream-layer information such
display time of low-quality tiles (hereafter, the delay) also affects   as QP are not suitable because it is encrypted, and models using
quality. Therefore, users perceive quality degradation due to en-       pixel information are not suitable because of their computational
coding and upscaling [6, 7, 8, 9]. Like in 2D video streaming,          power.
MPEG-DASH [10, 11] is used in ODV streaming services. Video                  Ghadiyaram et al. [17] focused on estimating continuous-
data with a suitable bitrate for the current throughput and buffer      time quality and evaluated the temporal effect of stalling by using
size is requested and downloaded. Therefore, the quality is adap-       the Hammerstein-Wiener models. Yamagishi and Hayashi [18]
tively changed due to the throughput and buffer fluctuation. Since      proposed a quality-estimation model that takes meta-data (such
the usage of the terminal buffer fluctuates, stalling sometimes oc-     as the bitrate, resolution, and stalling information) as input and

IS&T International Symposium on Electronic Imaging 2021
Human Vision and Electronic Imaging 2021                                                                                                 161-1
Dq      =    100 − R f romMOS(MOSq),                (6)
                                                                                    MOSq       =    q1 + q2 · exp(q3 · quant),             (7)
                                                                                       Du      =    u1 · log10 (u2 · (scaleFactor − 1) + 1),(8)

                                                                                                            disRes
                                                                            scaleFactor        =    max               ,1                    (9)
                                                                                                            codRes
                                                                       where Dq is the amount of quality degradation related to the quan-
                                                                       tization calculated from quant, which is a variable related to the
                                                                       quantization parameter and calculated from the bit amount per
                                                                       pixel and bitrate. The coefficients q1−3 are constant. The variable
Figure 1. Quality degradation due to changes in viewing area
                                                                       Du is the amount of quality degradation related to the resolution
                                                                       of the encoding, scaleFactor is a parameter capturing upscaling
                                                                       degradation, disRes is display resolution, and codRes is coding
calculates the quality. With these 2D models, the effect of quality    resolution. The coefficients u1 and u2 are constant. The vari-
fluctuation and stalling can be evaluated, but tile-based VR im-       able Dt is the amount of degradation related to the frame rate.
age quality cannot. When these 2D quality-estimation models are        MOS f romR converts the mean opinion score (MOS) from the
applied to tile-based ODV, an issue remains: how to take into ac-      psychological value R of 0 − 100, and R f romMOS converts R
count the impact of the high- and low-quality tiles and the delay      from MOS. The details of these two functions can be found in
on quality.                                                            Annex E of ITU-T Recommendation P.1203.
      A tile-based ODV quality-estimation model was proposed                 In the quality-integration module, audio-visual (AV) quality
[8] that evaluates quality using latitude (viewing angle), tiling,     O.34 is calculated first by using O.21 and O.22 as follows.
stalls, and quality changes. However, it does not take bitrate ac-
                                                                            O.34t     =      av1 + av2 · O.21t + av3 · O.22t
count as input. Since the bitrate of each quality level varies among
service providers, this model cannot be used for evaluating qual-                             + av4 · O.21t · O.22t                       (10)
ity degradation affected by the change in bitrate. The display time
                                                                       The subscript t is time, and av1−4 are coefficients.
of low-quality tiles (the delay) is also not taken into account.
                                                                            Next, by using the time series data of O.34, the integrated
      From these investigations, a quality-estimation model needs
                                                                       quality O.35 is calculated as
to be developed that can be used for calculating the impact of the
high- and low-quality tiles and the delay.                                  O.35     =       O.35baseline − negativeBias
                                                                                             − oscComp − adaptComp,                       (11)
Recommendation P.1203 model
      In 2D video streaming services, the P.1203 model has been
standardized and is known to have sufficiently high quality-                                        Σt w1 (t) · w2 (t) · O.34t
                                                                            O.35baseline      =                                ,          (12)
estimation accuracy. Therefore, the P.1203 model should be ex-                                          Σt w1 (t) · w2 (t)
tended to a quality-estimation model for ODV streaming services.
                                                                                                                       t −1

To do that, the P.1203 model is introduced in this section.                         w1 (t)    =    t1 − t2 · exp               /t3 ,      (13)
                                                                                                                         T
      The P.1203 model consists of three modules. One is an
                                                                                    w2 (t)    =    t4 − t5 · O.34t ,                      (14)
audio-quality-estimation module that estimates short-term audio
quality. Another is a video-quality-estimation module that esti-       where the variables negativeBias, oscComp, and adaptComp are
mates short-term video quality. The other is a quality-integration     the effect of the range and frequency of the quality change due
module that integrates time-series coding quality of video and au-     to the throughput fluctuation on quality of experience (QoE), T is
dio, and this module takes the length of stalling time and position    the duration of the media session, and t1−5 are coefficients.
as input and estimates the quality for the media session.                    The model has a machine-learning part that is a random for-
      The audio-quality-estimation module calculates audio qual-       est and based on 14 features. The features are related to stalling
ity per second, O.21, as follows.                                      duration, stalling frequency, O.21, and O.22 and are listed as fol-
                                                                       lows. 1) Total number of stalling events occurring in the media
        O.21     =    MOS f romR(QA),                           (1)
                                                                       session, excluding the initial stalling event. 2) The sum of the du-
         QA      =    100 − QcodA,                              (2)    rations of all stalling events. 3) Frequency of stalling events: the
     QcodA       =    a1A · exp (a2A · Bitrate) + a3A           (3)    number of stalling events (excluding the initial stalling) divided
                                                                       by the length of the media. 4) Ratio of stalling duration: The ratio
where Bitrate is the audio bitrate in kbps and the coefficients a1A,   of stallDur to the total media length. 5) The time elapsed from
a2A, and a3A are constant. The variable QcodA is the amount of         the start of the last stalling event to the end of a video. The initial
quality degradation related to audio encoding.                         stalling event is excluded from the calculation of this feature. The
     The video-quality-estimation module calculates video qual-        value of this feature is set to T if there is no stalling in the ses-
ity per second, O.22, as follows.                                      sion. 6-8) The average of all the O.22 scores that correspond to
                                                                       the first, second, and last thirds of the O.22 score vector. The av-
               O.22   =    MOS f romR(100 − min(D, 100)),       (4)    erage of all the O.22 scores of the second third of the O.22 score
                 D    =    Dq + Du + Dt,                        (5)    vector. 9-11) The first, fifth, and tenth percentiles of O.22. 12)

                                                                                         IS&T International Symposium on Electronic Imaging 2021
161-2                                                                                                   Human Vision and Electronic Imaging 2021
All the O.21 scores corresponding to the first half of the session Since the impact of stalling on ODV quality might differ
are averaged. 13) All the O.21 scores corresponding to the sec- from that on 2D video quality, the coefficients for stalling (s1−3 )
ond half of the session are averaged.14) The length of the media. in (17) were also derived using the experimental data described in
From the random forest outputs, quality values are estimated as next section.
RFPrediction. The calculation of O.46temp to O.46 in (15) is for adjust-
Finally, the media session quality O.46 is calculated using ing the heterogeneity of the results of experiments conducted by
O.35, stalling information, and RFPrediction. multiple organizations. For this reason, (15) was not used in this
study.
O.46 = 0.02833052 + 0.98117059 · O.46temp , (15)
Subjective experiments
O.46temp = 0.75 · (1 + (O.35 − 1) · SI) Two subjective quality assessment experiments (Experi-
ments 1 and 2) were conducted to develop proposed models and
+ 0.25 · RFPrediction, (16)
to validate their quality-estimation accuracy.
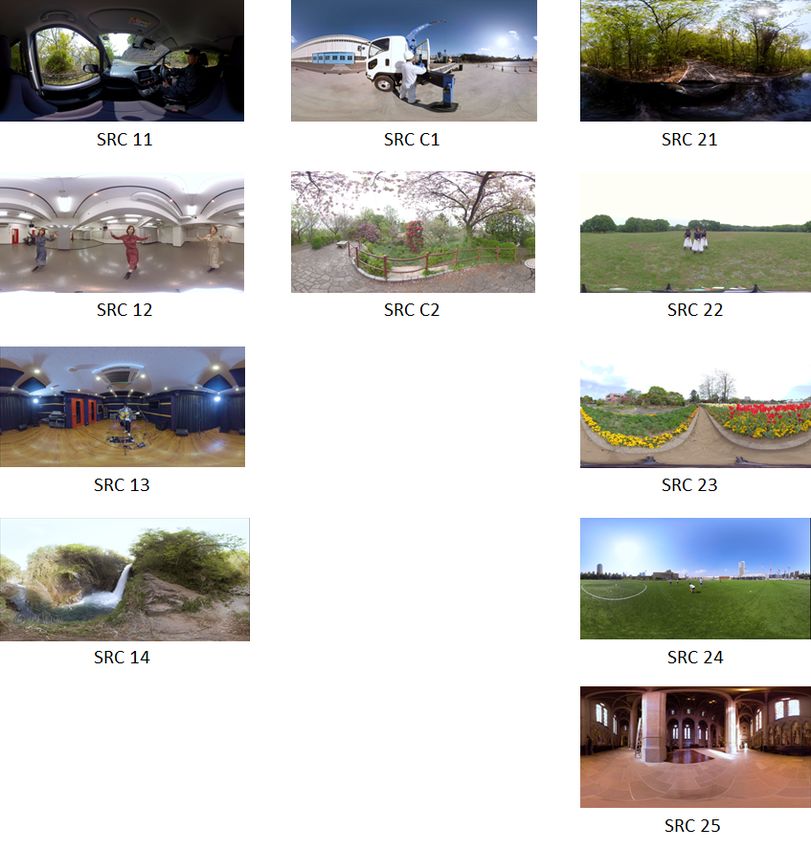
numStalls tatalStallLen Source reference sequences
SI = exp − · exp −
s1 T · s2 Since the coding efficiency depends on source reference se-
quences (SRCs), 11 SRCs were used, as shown in Figure 2. In
avgStallInterval
· exp − , (17) Experiment 1, SRC 11-14 and SRC C1 and C2 were used. In Ex-
T · s3
periment 2, SRC 21-25 and SRC C1 and C2 were used. SRC C1
where numStalls is the number of stalling events, totalStallLen and C2 are used as common sequences to compare results of the
is the total stalling time, avgStallInterval is the average stalling experiments. SRC C1 is a video shot from the side of a crane car
interval, T is media session time, and s1−3 are coefficients. with a small amount of movement. SRC C2 is shot in a botani-
cal garden at a fixed position and has many edges and a medium
Extensions of P.1203 model amount of movement due to wind. SRC 11 is shot from inside a
This section explains the proposed video-quality-estimation car driving on a mountain road with a large amount of movement.
modules, which take high- and low-quality tiles and delay related SRC 12 shows a women dancing in a dance studio and has few
information. Since the P.1203 model calculates 2D video qual- edges and a medium amount of movement. SRC 13 shows a man
ity O.22, it can conceivably be used to estimate the quality of playing music in a room and has few edges and a small amount
high- and low-quality tiles. When users change their viewing di- of movement. SRC 14 is shot from the side of a waterfall and has
rection, they perceive quality degradations due to the quality of medium amounts of edges and movement. SRC 21 is shot from
low-quality tiles and the delay. Therefore, the delay needs to be a sunroof or inside a car driving on a mountain road with a large
taken into account in the video-quality-estimation module. amount of movement. SRC 22 shows a women dancing in a park
To investigate the improvement of quality-estimation accu- and has medium amounts of edges and movement. SRC 23 is shot
racy, three types of O.22 calculation models are developed. The in a botanical garden at a fixed position and has many edges and a
simplest model (model C) takes the quality of the high-quality small amount of movement. SRC 24 shows men practicing soccer
tiles as input. To take into account the quality degradation due and has a small amount of movement. SRC 25 is shot in a church
to the low-quality tiles, the second model (model B) uses the at a fixed position and has few edges and almost no movement.
weighted sum of video quality of high- and low-quality tiles. To The resolution of the SRCs was 7680 × 3840, and the framerate
take into account the quality degradation due to the delay, the third was 30 fps. The SRCs lasted 60 seconds.
model (model A) takes the delay in addition to the input of model
B. Experimental conditions and processed video se-
quences
A) High- and low-quality terms with delay (model A) To develop a quality-estimation model that can be used for
O.22 = ω · O.22H + (1 − ω) · O.22L , (18) calculating the impact of the high- and low-quality tiles and the
ω = d1 · delay−d2 (19) delay, the bitrates of high- and low-quality tiles and the delay need
B) High- and low-quality terms without delay (model B) to be varied.
O.22 = ω1 · O.22H + (1 − ω1 ) · O.22L (20) Tile-based coding was used, as shown in Fig. 3. In these
C) Only high-quality term (model C) experiments, H.265/HEVC (Main Profile/Level 5.0, GoP: M=3,
O.22 = O.22H (21) N=15, 1-pass encoding) was used for high- and low-quality tiles.
The chunk size was 0.5 seconds. The SRCs were divided into
O.22H and O.22L are based on the video-quality estimation mod- 1920 × 1920 regions and encoded as high-quality tiles. The num-
ule of the P.1203 model and are calculated using the bitrate, reso- ber of high-quality tiles was 60 (12 × 5). That is, tiles adjacent in
lution, and framerate of high- and low-quality tiles, respectively, the horizontal direction overlapped by 1280 (= 1920 − 7680/12)
where q1−3 in (7), ω1 , and d1−2 were derived using the experi- pixels, and tiles adjacent in the vertical direction overlapped by
mental data described in next section. 1152 (= 1920 − 3840/5) pixels. The low-quality tiles were down-
The coefficients av1−4 in (10) were also re-optimized by us- sized from the source videos from 7680 × 3840 to 1920 × 1920,
ing the experimental data because the video quality (O.22) and and those tiles were displayed at the original resolution on the
audio quality (O.21) may affect the AV quality (O.34) of ODV HMD.
differently from that of 2D video streaming. To vary the quality due to encoding, delay, adaptivity, and
IS&T International Symposium on Electronic Imaging 2021
Human Vision and Electronic Imaging 2021 161-3
Table 1. Bitrate pairs (Mbps) for each quality level (QL)

                                                                              QL     10     11   12   13   14   15   16   17
                                                                             High    16     16    8    8    4    4    2    2
                                                                             Low     16      8    8    4    4    2    2    1
                                                                              QL     20     21   22   23   24   25   26   27   28   29
                                                                             High    16      9    9    7    7    5    5    3    3    2
                                                                             Low     16      7    3    5    1    5    3    2    1    1

                                                                       Table 2. The breakdown of the PVSs

                                                                              Stalling    Quality change   Experiment 1   Experiment 2
                                                                                 -               -             16             16
                                                                                 x               -              8              8
                                                                                 -               x             12             12
                                                                                 x               x             12             12

                                                                       Experimental environment
                                                                              The participants used HTC Vive Pro, which is a virtual-
                                                                       reality headset with two glasses-like screens (1440 × 1600 pixels
                                                                       each), to watch ODVs. After the video is mapped onto a sphere,
                                                                       it is cropped and displayed in accordance with the viewing angle.
Figure 2. Source contents
                                                                       The device displayed ODVs for both eyes with pseudo-parallax.
                                                                       The digital file level of -26dBov was set to an acoustic listening
                                                                       level of 18dBPa. The participants could freely change the viewing
                                                                       directions during the test.

                                                                       Assessment method
                                                                             Before the subjective test, participants took visual acuity and
                                                                       color vision tests, read the instructions (i.e., rating scale and vot-
                                                                       ing procedure), and participated in a subjective test training that
Figure 3. Tile encoding                                                involved watching four videos. The video-quality-evaluation pro-
                                                                       cedure followed the absolute category rating (ACR) methodology
                                                                       using a five-point scale. The participants wore a HMD, watched
                                                                       the videos, and evaluated the quality in a booth.
stalling events, the parameters are used as follows. Eight quality           Participants take a short break (about 2 minutes) after watch-
levels (QL10-17) were used in Experiment 1, and ten (QL20-29)          ing the 4 videos (1 set) and took a longer break (about 10 minutes)
were used in Experiment 2. The bitrate pairs (high-quality tiles,      after every three sets. The experiments lasted about 3 hours in-
low-quality tiles) for each quality level are shown in Table 1. To     cluding instruction, visual acuity and color vision tests, training,
align the quality ranges of the experiments, the best quality levels   and breaks. The presentation order of PVSs was randomized.
(QL10 and QL20) and the worst (QL17 and QL29) were used
as common conditions. The bitrate of high-quality tiles is the         Participants
value for 1 tile out of 60, and low-quality tiles cover the whole            In both experiments, 32 participants took part: 16 males and
environment. The delay was 1 to 8 seconds and was controlled by        16 females with visual acuity of 1.0 or more with contact lenses
changing the player’s buffer length. The experimental conditions       or the naked eye. All the participants passed the visual acuity
were set so that the cases with and without bitrate fluctuation and    and color vision tests. They were naive participants who had not
stalling could be confirmed. The number of bitrate changes was 0       participated in subjective quality assessment experiments of ODV
to 2, the number of stalls was 0 to 2, and stalling duration was 4     streaming in the previous six months. In Experiment 1, the partic-
to 12 seconds per stalling event.                                      ipants were 18 to 35 years old (average age: 21.7). In Experiment
                                                                       2, the participants were 18 to 26 years old (average age: 21.2).
     The number of processed video sequences (PVSs) was 48 in
Experiments 1 and 2. In Experiment 1, SRC 11-14 and SRC C1
and C2 were used eight times. In Experiment 2, SRC 21-25 were
                                                                       Quality-estimation accuracy
                                                                             Before investigating the quality-estimation accuracy, the sta-
used eight times, and SRC C1 and C2 were used four times.
                                                                       bility of the subjective test was investigated on the basis of a 95%
      The numbers of PVSs for combinations of stalling and qual-       confidence interval (CI). Table 3 shows the mean, standard devi-
ity changes are listed in Table 2. To show the same stalling events    ation, minimum values, and maximum values of the CIs. These
for all participants, the events were simulated by inserting frames    mean CIs were almost the same as the mean CI (0.312) in Robitza
that were stopped in the videos.                                       et al. [20]. Since the CIs were not high, the stability can be said to

                                                                                          IS&T International Symposium on Electronic Imaging 2021
161-4                                                                                                    Human Vision and Electronic Imaging 2021
Table 3. Summary statistics of the confidence intervals               Table 4. PCCs and RMSEs of each model for Experiment 1

                Mean    Standard deviation   Minimum      Maximum          Model                                          PCC     RMSE
 Experiment 1   0.318         0.043           0.193        0.402           A) High- and low-quality terms with delay      0.85     0.40
 Experiment 2   0.317         0.049           0.232        0.474           B) High- and low-quality terms without delay   0.75     0.49
                                                                           C) Only high-quality term                      0.71     0.52

be high enough. Comparing the MOSs of the common sequences            Table 5. PCCs and RMSEs of model A for test data
in the two experiments, the MOSs tended to be slightly higher
                                                                                  Training data   Test data       PCC     RMSE
in Experiment 2 than in Experiment 1. The linear mapping is as
                                                                                  Experiment 1    Experiment 2    0.77     0.47
follows:
                                                                                  Experiment 2    Experiment 1    0.76     0.45

     y = 0.9297x + 0.4184,                                     (22)

where x is MOS of Experiment 1 and y is MOS of Experiment 2.
The Pearson correlation coefficient (PCC) was 0.957.                  services is proposed. To evaluate its quality-estimation accuracy,
      To investigate the quality-estimation accuracy of the three     subjective quality assessment experiments were conducted.
models (Models A, B, and C), the coefficients (q1−3 , av1−4 , ω1 ,          Results show the quality-estimation accuracy can be im-
d1−2 , s1−3 ) were optimized by using the Experiment 1 results and    proved by taking into account the delay and quality of high- and
Microsoft Excel Solver. Table 4 shows the root mean squared           low-quality tiles. Cross-validation was conducted to assess the
errors (RMSEs) and PCCs. By comparing models A, B, and C in           quality-estimation accuracy of the proposed model (model A) for
Table 4, quality-estimation accuracy is shown to be improved by       test data. The quality-estimation accuracy was maintained and
adding low-quality terms and the delay.                               was better than the quality-estimation accuracy of simpler mod-
      For proposed model A, cross-validation is conducted to as-      els with training data. The quality-estimation accuracy was high
sess the quality-estimation accuracy for test data by using the re-   for several videos but low for the video with a large amount
sults of Experiments 1 and 2. To adjust the heterogeneity of the      of movement and many edges. The proposed model’s quality-
results of the experiments, the MOSs were transformed by using        estimation accuracy was high for stalling conditions but not for
(22). Table 5 shows the PCCs and the RMSEs of model A for test        quality-change conditions without stalling.
data. In either case, the quality-estimation accuracy of model A            In the future, subjective quality assessment tests with a large
was maintained and was better than that of model B in Table 4.        variety of video sources will need to be conducted to further op-
Figures 4 and 5 show the scattered plots between estimated and        timize the coefficients and evaluate the proposed model because
subjective MOSs when using the results of Experiments 1 and 2         only 11 video sources were used in these experiments. In addi-
as test data, respectively. These results reveal proposed model A     tion, if the impact of source on the quality needs to be calculated,
achieves a sufficient quality-estimation accuracy.                    a bitstream-based or pixel-based model will need to be investi-
      Some investigations should be noted to explain the results of   gated.
proposed model A in detail. Table 6 shows the RMSEs for PVSs
of each SRC. SRC 21 had higher RMSE than the others because           References
SRC 21 is a video with a large amount of movement and many            [1] D. Ochi, A. Kameda, Y. Kunita, A. Kojima, and S. Iwaki, “Live
edges. In fact, the QP values of SRC 21 were higher than others           streaming system for omnidirectional video,” in Proc. of IEEE Vir-
for each bitrate. This estimation error is inevitable because the         tual Reality (VR), Mar. 2015.
proposed model cannot take content features (e.g., QP or pixels)      [2] V. R. Gaddam, M. Riegler, R. Eg, C. Griwodz, and P. Halvorsen,
as input. To improve the quality-estimation accuracy, bitstream           “Tiling in Interactive Panoramic Video: Approaches and Evaluation,”
information such as QP or media signals could be required as in-          in IEEE Trans. on Multimedia, vol. 18, no. 9, pp. 1819-1831, Sept.
put.                                                                      2016.
      Next, the effects of stalling and quality changes on quality-   [3] MPEG, “Omnidirectional Media Application Format,” in
estimation accuracy are investigated. Table 7 shows the RMSEs             https://mpeg.chiariglione.org/standards/mpeg-i/omnidirectional-
for four combinations of stalling and quality changes. Model A            media-format
exhibited high quality-estimation accuracy even when there was        [4] A. Singla, S. Fremerey, W. Robitza, P. Lebreton, and A. Raake,
stalling but low accuracy when there was only quality changes             “Comparison of Subjective Quality Evaluation for HEVC Encoded
without stalling. As described above, since the impact of SRC on          Omnidirectional Videos at Different Bit-rates for UHD and FHD Res-
quality could not be calculated in the proposed model, the quality-       olution,” in Proc. of the on Thematic Workshops of ACM Multimedia
estimation accuracy degraded when quality changed. Under the              2017 (Thematic Workshops ’17), Oct. 2017.
conditions with stalling, SRC had little effect and could be esti-    [5] A. Singla, W. Robitza, and A. Raake, “Comparison of subjective
mated with relatively high accuracy.                                      quality evaluation methods for omnidirectional videos with DSIS and
                                                                          Modified ACR,” in Proc. of Electronic Imaging, Human Vision and
Conclusion                                                                Electronic Imaging 2018, Jan. 2018.
     In this paper, to monitor the normality of tile-based omnidi-    [6] A. Ghosh, V. Aggarwal, and F. Qian, “A rate adaptation algorithm for
rectional video (ODV) services, an extension of the ITU-T Rec-            tile-based 360-degree video streaming,” in Proc. of the 7th Interna-
ommendation P.1203 mode 0 model to tile-based ODV streaming               tional Conference on Multimedia Systems (ACM MMSys), May 2016.

IS&T International Symposium on Electronic Imaging 2021
Human Vision and Electronic Imaging 2021                                                                                                   161-5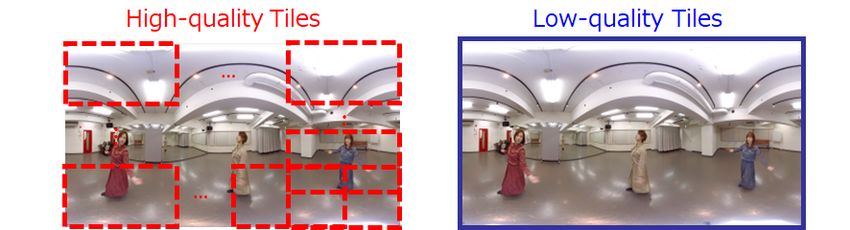
Table 7. RMSEs for conditions

                                                                                                      Training        Experiment 1    Experiment 2
                                                                                                         Test         Experiment 2    Experiment 1
                                                                                        Stalling   Quality changes
                                                                                           -               -              0.50            0.51
                                                                                           x               -              0.30            0.21
                                                                                           -               x              0.57            0.47
                                                                                           x               x              0.39            0.47

 Figure 4.      Estimation results of      Figure 5.      Estimation results of
 model A trained by using Experiment       model A trained by using Experiment    [16] Z. Duanmu, A. Rehman, K. Zeng, and Z. Wang, “Quality of experi-
 2 for Experiment 1                        1 for Experiment 2                         ence prediction for streaming video,” in Proc. of 2016 IEEE Interna-
                                                                                      tional Conference on Multimedia and Expo (ICME), July 2016.
Table 6. RMSEs for PVSs of each SRC
                                                                                  [17] D. Ghadiyaram, J. Pan, and A. C. Bovik, “Learning a Continuous-
          Training    Experiment 2      Training   Experiment 1                       Time Streaming Video QoE Model,” IEEE Trans. Image Processing,
            Test      Experiment 1        Test     Experiment 2                       vol. 27, no. 5, pp. 2257–2271, May 2018.
            SRC          RMSE             SRC         RMSE                        [18] K. Yamagishi and T. Hayashi, “Parametric Quality-Estimation
             11           0.30             21          0.83                           Model for Adaptive-Bitrate Streaming Services,” IEEE Trans. Mul-
             12           0.41             22          0.25                           timedia, vol. 19, no. 7, pp. 1545–1557, 2017.
             13           0.49             23          0.34
                                                                                  [19] W. Robitza, M. Garcia, and A. Raake, “A modular HTTP adaptive
             14           0.39             24          0.25
              -             -              25          0.28                           streaming QoE model—Candidate for ITU-T P. 1203 (“P. NATS”),”
             C1           0.63             C1          0.41                           in Proc. of 2017 9th International Conference on Quality of Multime-
             C2           0.42             C2          0.64                           dia Experience (QoMEX), May 2017.
                                                                                  [20] W. Robitza, S. Göring, A. Raake, D. Lindegren, G. Heikkilä, J.
                                                                                      Gustafsson, P. List, B. Feiten, U. Wüstenhagen, M. Garcia, K. Ya-
                                                                                      magishi, and S. Broom. “HTTP adaptive streaming QoE estimation
[7] A. Singla, S. Göring, A. Raake, B. Meixner, R. Koenen, and T. Buch-              with ITU-T rec. P. 1203: open databases and software,” in Proc. of
    holz, “Subjective quality evaluation of tile-based streaming for om-              2018 9th ACM Multimedia Systems Conference (MMSys ’18), June
    nidirectional videos,” in Proc. of the 10th ACM Multimedia Systems                2018.
    Conference (ACM MMSys), June 2019.                                            [21] ITU-T Recommandation P.1203, “Parametric bitstream-based qual-
[8] J. Li, R. Feng, Z. Liu, W. Sun, and Q. Li, “Modeling QoE of                       ity assessment of progressive download and adaptive audiovisual
    virtual reality video transmission over wireless networks,” in Proc.              streaming services over reliable transport,” ITU-T, 2017.
    of 2018 IEEE Global Communications Conference (GLOBECOM),
    Dec. 2018.                                                                    Author Biography
[9] R. Schatz, A. Zabrovskiy, and C. Timmerer, “Tile-based Streaming                    Yuichiro Urata received his B.E. and M.E. degrees in Engineering
    of 8K Omnidirectional Video: Subjective and Objective QoE Eval-               from University of Electro-Communications, Tokyo, Japan in 2009 and
    uation,” Proc. of 2019 11th International Conference on Quality of            2011. Since then he has worked in NTT Network Technology Laboratories
    Multimedia Experience (QoMEX), June 2019.                                     in Tokyo. His work has focused on the Quality of Experience for videos.
[10] I. Sodagar, “The MPEG-DASH Standard for Multimedia Streaming                       Masanori Koike received his Bachelor (2015) in Engineering and
    Over the Internet,” IEEE MultiMedia, vol. 18, no. 4, pp. 62–67, Apr.          Master (2017) in Information science and technology from the University
    2011.                                                                         of Tokyo, Japan. Since 2017, he has worked in NTT Network Technol-
[11] J. L. Feuvre and C. Concolato, “Tiled-based adaptive streaming us-           ogy Laboratories in Tokyo. His main research interest is the Quality of
    ing MPEG-DASH,” in Proc. of the 7th International Conference on               Experience for VR videos.
    Multimedia Systems (ACM MMSys), May 2016.                                           Kazuhisa Yamagishi received his B.E. degree in Electrical Engineer-
[12] W. Zhang, W. Zou, and F. Yang, “The Impact of Stalling on the Per-           ing from the Tokyo University of Science, Japan, in 2001 and his M.E. and
    ceptual Quality of HTTP-based Omnidirectional Video Streaming,”               Ph.D. degrees in Electronics, information, and Communication Engineer-
    in Proc. of 2019 IEEE International Conference on Acoustics, Speech           ing from Waseda University, Japan, in 2003 and 2013. Since joining NTT
    and Signal Processing (ICASSP), May 2019.                                     Laboratories in 2003, he has been engaged in the development of objec-
[13] R. Schatz, A. Sackl, C. Timmerer, and B. Gardlo, “Towards sub-               tive quality-estimation models for multi-media telecommunications.
    jective quality of experience assessment for omnidirectional video                  Noritsugu Egi received his B.E. and M.E. degrees in Electrical Com-
    streaming” in Proc. of 2017 9th International Conference on Qual-             munication Engineering from Tohoku University, Japan in 2003 and 2005.
    ity of Multimedia Experience (QoMEX), May 2017.                               He joined NTT Laboratories, Tokyo, Japan, in 2005. Currently, he is re-
[14] C. Alberti, D. Renzi, C. Timmerer, C. Mueller, S. Lederer, S. Bat-           searching speech and audio quality assessment.
    tista, and M. Mattavelli, “Automated QoE evaluation of Dynamic                      Jun Okamoto received the B.E. and M.E. degrees in electrical engi-
    Adaptive Streaming over HTTP,” in Proc. of 2013 5th International             neering from the Tokyo University of Science in 1994 and 1996. In 1996,
    Workshop on Quality of Multimedia Experience (QoMEX), July 2013.              he joined NTT Laboratories, where he has been involved in the quality
[15] H. T. T. Tran, N. P. Ngoc, A. T. Pham, and T. C. Thang, “A multi-            assessment of multimedia telecommunication and network performance
    factor QoE model for adaptive streaming over mobile networks,”                measurement methods.
    Proc. IEEE Globecom Workshops (GC Wkshps), Dec. 2016.

                                                                                                   IS&T International Symposium on Electronic Imaging 2021
161-6                                                                                                             Human Vision and Electronic Imaging 2021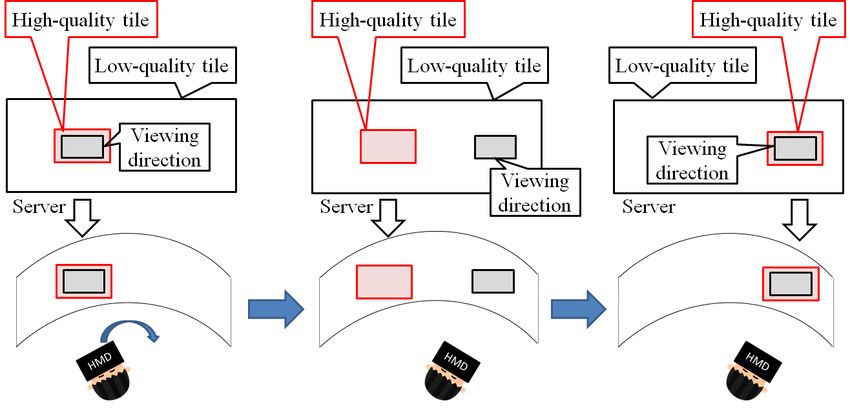
JOIN US AT THE NEXT EI!

 IS&T International Symposium on

 Electronic Imaging
 SCIENCE AND TECHNOLOGY

Imaging across applications . . . Where industry and academia meet!

• SHORT COURSES • EXHIBITS • DEMONSTRATION SESSION • PLENARY TALKS •
• INTERACTIVE PAPER SESSION • SPECIAL EVENTS • TECHNICAL SESSIONS •

                  www.electronicimaging.org
                                                             imaging.org
You can also read


