Recycling Contamination Digital Marketing Campaign - CIF
←
→
Page content transcription
If your browser does not render page correctly, please read the page content below
Recycling Contamination
Digital Marketing Campaign
CIF Project Number #882
Final Report
May 2019

Prepared for:
Resource Productivity and Recovery Authority
Continuous Improvement Fund

Prepared by:
Bernadette Celis-Clarke, Advisor, Promotion, Education and Outreach, Region of Peel
Dennis King, Digital Marketing Specialist, Region of Peel

CIF #882 – Final Report – Region of Peel                                              Page 0 of 26
Acknowledgement
This Project has been delivered with the assistance of Resource Productivity and Recovery
Authority’s Continuous Improvement Fund, a fund financed by Ontario municipalities and
stewards of blue box waste in Ontario. Notwithstanding this support, the views expressed are
the views of the author(s), and Resource Productivity and Recovery Authority and Stewardship
Ontario accept no responsibility for these views.

© 2019 Resource Productivity and Recovery Authority and Stewardship Ontario

All rights reserved. No part of this publication may be reproduced, recorded or transmitted in
any form or by any means, electronic, mechanical, photographic, sound, magnetic or other,
without advance written permission from the owner.

CIF #882 – Final Report – Region of Peel                                           Page 1 of 26
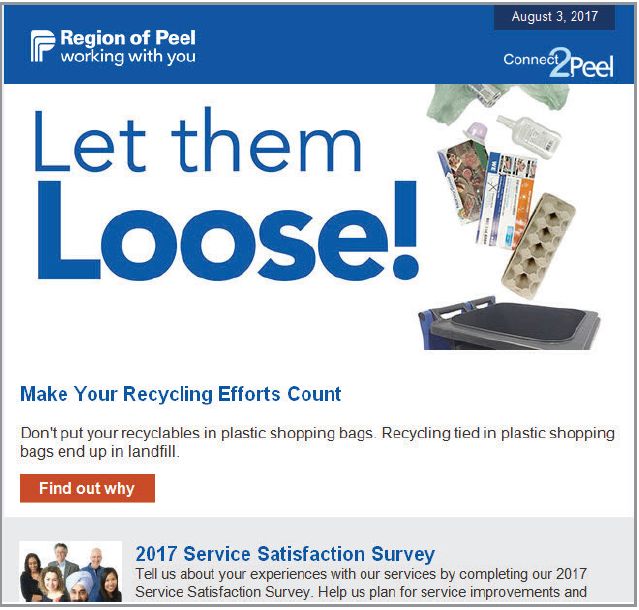
Table of Contents
Executive Summary.............................................................................................................................. 4

1. Background ...................................................................................................................................... 7
   1.1. Community Profile ............................................................................................................................ 7
   1.2. Waste Management System ............................................................................................................. 8
   1.3. Current Waste Management Performance .................................................................................... 10

2. Approach ....................................................................................................................................... 10
   2.1. Planning and Implementation Process ........................................................................................... 10
   2.2. Monitoring, Measurement Methodology and Analysis .................................................................. 16

3. Project Results ............................................................................................................................... 21

4. Project Budget ............................................................................................................................... 24

5. Overall Analysis and Lessons Learned ............................................................................................. 25

LIST OF TABLES
   Table 1: Number of Households in The Region of Peel (2017) ................................................................ 8
   Table 2: Overview of Region of Peel’s Garbage and Recycling Services (2017) ....................................... 8
   Table 3: Region of Peel’s Current Waste Management Performance (2017) ........................................ 10
   Table 4: Empty Your Containers A/B Video Test Metric Results ............................................................ 20
   Table 5: Phase 1 Business Outcome Results, Recycling in Grocery Bags, 19-Month Comparison ......... 21
   Table 6: MRF In-Bound Audit Results for Organic-Related Material – Before and After Phase 2 ......... 23

LIST OF FIGURES
   Figure 1: Peel Region Location Map......................................................................................................... 7
   Figure 2: Overview of Peel’s Waste Management System ...................................................................... 9
   Figure 3: 2016 Year-to-Date Report Summary of Non-Recyclable Material, Curbside Collection ......... 11
   Figure 4: Measurement Plan for Recycling Contamination Campaign 2017-2018 ................................ 12
   Figure 5: Campaign’s Integrated Digital Marketing Approach ............................................................... 13
   Figure 6: Images of Campaign’s Landing Page (Mobile Version) ........................................................... 14
   Figure 7: Image of Campaign Video ....................................................................................................... 14
   Figure 8: Image from Connect to Peel e-Newsletter, August 2017 Issue .............................................. 15
   Figure 9: Images from Digital/Social Media Advertising (Google, YouTube, Twitter and Facebook) .... 15
   Figure 10: Images from Social Media Posts ........................................................................................... 16

CIF #882 – Final Report – Region of Peel                                                                                               Page 2 of 26
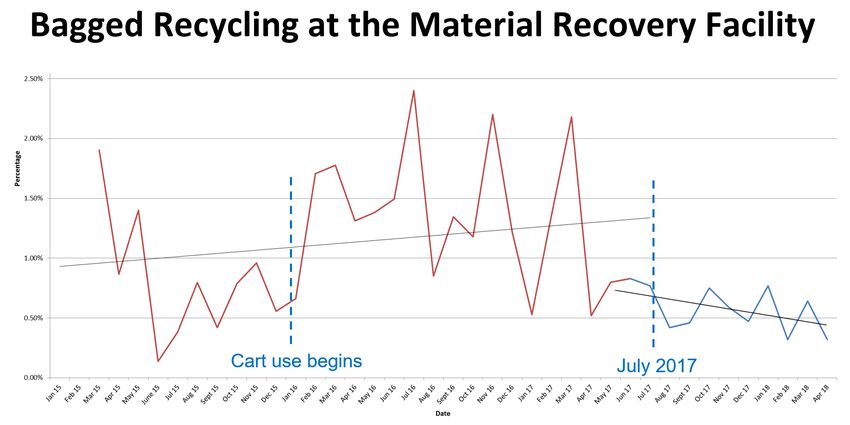
Figure 11: Images from Web Promotion on Region of Peel’s Website (peelregion.ca) ......................... 16
  Figure 12: Digital Analytic Platforms Used During Campaign ................................................................ 17
  Figure 13: Example of Digital Marketing Metrics Gathered During Campaign’s First 11 Weeks ........... 17
  Figure 14: Bagged Recycling Material at the MRF, January 2015 – April 2018 ...................................... 18
  Figure 15: 2016 Year-to-Date Report Summary of Non-Recyclable Material, Curbside Collection ....... 19
  Figure 16: Creative Concepts for Phase 2 of Campaign, Empty Your Containers .................................. 19
  Figure 17: Screenshot of YouTube Video Preview for Phase 2 .............................................................. 20
  Figure 18: Bagged Recycling Material at the MRF, January 2015 – December 2018 ............................. 22

CIF #882 – Final Report – Region of Peel                                                                          Page 3 of 26
Executive Summary
Since the launch of bi-weekly waste cart collection in 2016, there has been an ongoing problem of
increased contamination of non-recyclable items showing up at Peel’s MRF, which ultimately negatively
impacts operating costs and the quality of recyclables the Region sells to various markets.

To address this issue, the Region chose to use promotion and education to encourage resident behavior
change towards proper recycling habits, by testing a digital-only marketing approach focused on a single
contamination issue at a time, and one simple message to encourage behavior change.

The digital marketing campaign evolved into two phases over an 18-month period, from July 2017
through to December 2018.

Phases:
   • Phase 1 – focused on bagged recycling
   • Phase 2 – focused on food in recyclable containers

Campaign Goal:
   • Decrease contamination in the Region’s recycling stream, while also diverting waste from
      landfill.

Target audience:
    • Peel residents in Brampton, Mississauga, and Caledon who receive curbside waste collection.

Objectives:
   • At 6 months, reduce bagged recycling contamination by 250 tonnes (an estimated 25%
        reduction), measured monthly.
   • At 12 months, maintain a minimum 25% reduction in bagged recycling contamination or more to
        evaluate sustainable campaign impact over time.
   • At 18 months, evaluate changes to determine overall business impact since the start of the
        campaign.

Measurement and Evaluation:

In comparison to more traditional marketing and communications campaigns, where performance and
impact is measured after a campaign’s completion, the Region of Peel actively monitored, measured and
analyzed the campaign’s performance throughout its implementation stage and adjusted along the way.

Measurement was focused on two key performance metrics:
    •   Monthly MRF in-bound audits
    •   Digital analytics

Due to the dynamic nature of digital metrics, tied in with in-bound waste audit reporting, staff were able
to uncover insights and make monthly campaign improvements, allowing the team to test, iterate, and
optimize results in a nimble fashion.

CIF #882 – Final Report – Region of Peel                                                      Page 4 of 26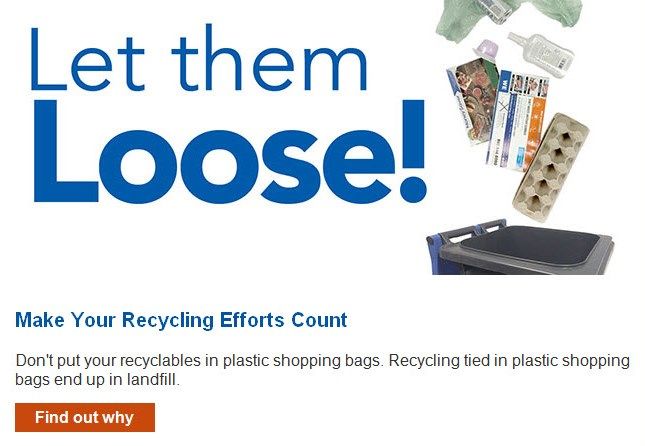
Summary of Phase 1 – Bagged Recycling

Phase 1 was launched in June 2017, with an initial focus on bagged recycling. The plan was to sustain the
campaign for several months, while measuring business impact (i.e. decrease in the volume of bagged
recyclables entering Peel’s MRF) throughout its implementation phase.

Several digital marketing channels, tools and tactics were used including the following:
   • 46-second feature video – promoted on YouTube
   • Web landing page – which featured the video, key messaging and the Region’s waste sorter tool
   • Digital and social media advertising – targeting Peel residents via Google, Twitter and Facebook
   • Email marketing – targeting the Region’s more than 110,000 e-newsletter subscriber base
   • Social media sharing – through the Region’s Twitter page
   • Region of Peel website – featuring banners and call-outs on key pages of the waste site

Results of the campaign proved successful, with monthly in-bound MRF audits showing a significant
decrease of bagged recyclables entering the MRF soon after the campaign launch. The Region sustained
the campaign for 15 months, making campaign improvements during this time based on digital metric
monitoring. This resulted in maintaining lower contamination levels of bagged recyclables.

With these positive impacts, the Region then re-directed its focus on food contamination in recyclable
containers, while still maintaining a lower marketing spend on the bagged recycling campaign. This
became Phase 2 of the campaign.

Summary of Phase 2 – Food in Containers

Phase 2, focused on emptying food from containers, was launched in September 2018, using the same
digital-only marketing approach and campaign improvements from the bagged recycling campaign.

After four months of sustaining the campaign and monitoring monthly digital metrics and in-bound MRF
audits, the Region did not see any significant change in the amount of food contamination entering the
MRF.

In addition, in-bound audits were also reporting a slow increase in the volume of bagged recyclables
showing up again at the MRF, which gave indication that the low marketing exposure to the bagged
recycling campaign may have been the reason for the slow increase.

Overall Results Analysis

Phase 1 results gave strong indication that the messaging to residents about bagged recycling made an
impact with residents, which only required a small shift in resident behaviour (of keeping recycling
loose). Business outcomes showed drastic and positive impact, and in-bound MRF audit data showed a
significant decrease in the volume of bagged recyclables showing up at the MRF.

When analyzing Phase 2 results, there was no significant change in the metrics. Therefore, the
Region safely assumes that Phase 2 messaging to “empty your containers” may not have been as clear
and straightforward for residents to receive. The instructions provided also required more time and

CIF #882 – Final Report – Region of Peel                                                     Page 5 of 26
effort for residents to do and might be a completely new task for some to start doing. The Region can
also safely assume that – based on the Region’s previous behaviour insights research – the “yuck” factor
may have also been a barrier for residents to act.

To increase the level of confidence in this analysis, further research could be conducted with residents
to test and gather feedback on the effectiveness of the messaging and visual material used in Phase 2 of
the campaign.

The Region is now making an assessment on how best to move forward with both campaigns.

CIF #882 – Final Report – Region of Peel                                                     Page 6 of 26
1.       Background

1.1 Community Profile

The Region of Peel serves more than 1.4 million residents and approximately 173,000 businesses in
Brampton, Caledon and Mississauga (see Figure 1), delivering a wide range of resident-focused services
across the Region including:
     •   paramedic services                                •   water and water treatment
     •   health programs                                   •   road maintenance
     •   long-term care and services for seniors           •   financial help
     •   child care support                                •   housing and shelter
     •   waste management

The Region of Peel is governed by the Regional Chair and 24 members of Council, who represent
Mississauga, Brampton and Caledon.

Figure 1: Peel Region Location Map

Socio-economic and planning data on Peel is available from the Peel Data Centre (PDC) at
PeelDataCentre.ca. It includes resources, reports and bulletins that summarize the Census and National
Household Survey, and Peel’s economic activity, human services, health, transportation, monitoring and
the environment and community safety.

CIF #882 – Final Report – Region of Peel                                                    Page 7 of 26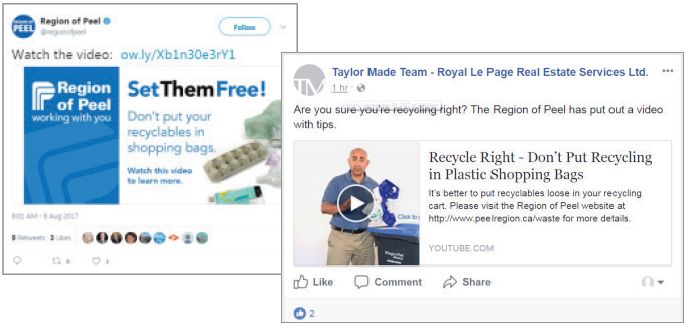
Table 1: Number of households in The Region of Peel (2017)
Single Family Multi Family
Municipality Population Total Households
Households Households
Region of Peel 1,450,000 338,568 100,758 439,326
1.2 Waste Management System
In 1995, waste collection was uploaded to the Region of Peel to take advantage of economies of
scale when combining tonnage from Brampton, Caledon and Mississauga.
Peel now has the second largest waste management program in Ontario.
Gross Operating Budget is $140 Million:
• 77% ($108M) is paid by tax payers
• 23% ($32M) is paid by fees and revenue
In 2018, Peel’s diversion rate was 50% which supports environmental protection and enhanced
community sustainability.
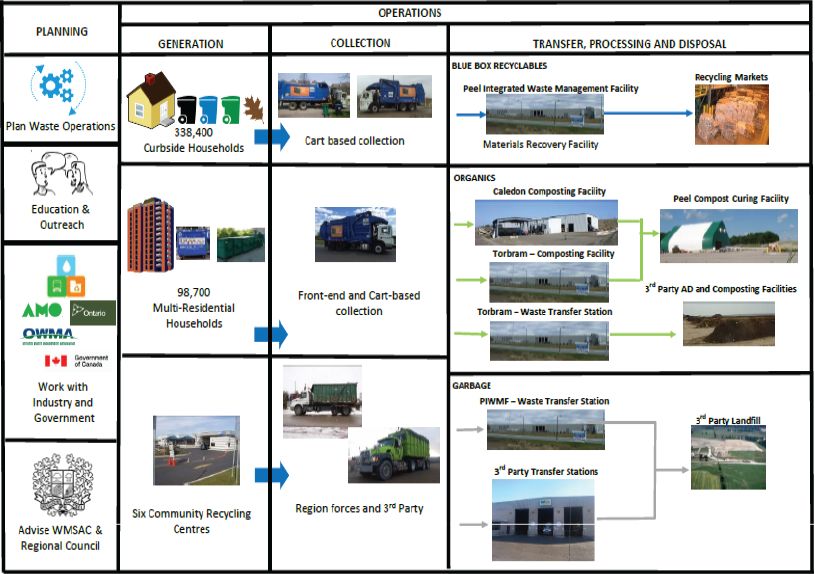
The Region of Peel’s waste management system is summarized in Table 2 and Figure 2 below.
Table 2: Overview of Region of Peel’s Garbage and Recycling Services (2017)
Single Family Service Collection Processing
Service Description Provider Provider
Garbage Bi-Weekly Emterra and Waste Connections Internal/External
Recycling Bi-Weekly Emterra and Waste Connections Canada Fibers Limited
Multi-Residential Service Collection Processing
Service Description Provider Provider
Garbage Bi-Weekly Emterra and Waste Connections Internal/External
Recycling Bi-Weekly Emterra and Waste Connections Canada Fibers Limited
CIF #882 – Final Report – Region of Peel Page 8 of 26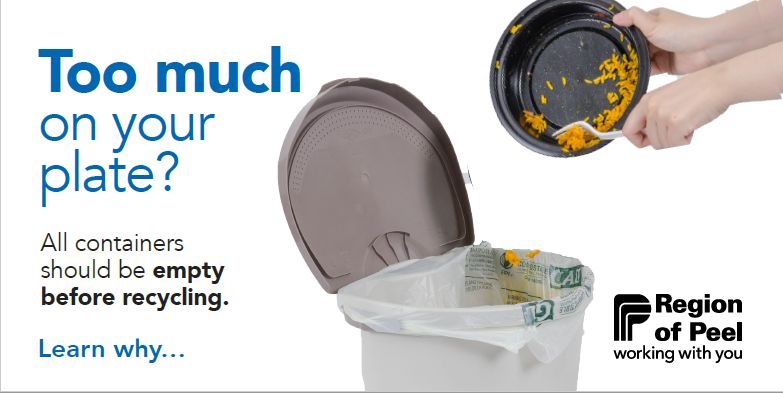
Figure 2: Overview of Peel’s Waste Management System

                  CIF #882 – Final Report – Region of Peel   Page 9 of 26
1.3 Current Waste Management Performance
Table 3: Region of Peel’s Current Waste Management Performance (2017)
Generation
Blue Box Recycling Total Waste Diversion Disposal
(Total)
%
% %
Units rate rate rate Units rate of
of total of total
total
tonnes
GAP 102,098.97 20% 248,696.71 49% 263,298.70 51% 511,995.41 100%
Reported
Kg/hhld 100%
232.40 20% 566.09 49% 599.32 51% 1,165.41
tonnes 100%
Single 88,539.22 20% 235,136.96 54% 199,821.24 46% 434,958.20
Family
Kg/hhld 100%
261.51 20% 694.50 54% 590.20 46% 1,284.70
tonnes 100%
Multi 13,559.75 18% 13,559.75 18% 63,477.46 82% 77,037.21
Family*
Kg/hhld 100%
134.58 18% 134.58 18% 630.00 82% 764.58
2. Approach
2.1 Planning and Implementation Process
The following steps were taken when planning and implementing the campaign, with details of each
step described below:
• Define problem and intended outcomes
• Understand problem/issue
• Create measurement plan
• Design campaign
• Implement
• Evaluate and re-assess
Define problem and intended outcomes
Since the launch of bi-weekly waste cart collection in 2016, there has been an ongoing problem of
increased contamination of non-recyclable items showing up at Peel’s MRF, which ultimately negatively
impacts operating costs and the quality of recyclables the Region sells to various markets.
To address this issue, the Region chose to use promotion and education to encourage resident behavior
change towards proper recycling habits.
The main goal of this effort was to decrease contamination in the Region’s recycling stream, while also
diverting waste from landfill.
CIF #882 – Final Report – Region of Peel Page 10 of 26Target audience:
Peel residents in Brampton, Mississauga, and Caledon who receive curbside waste collection.
Objectives:
• At 6 months, reduce bagged recycling contamination by 250 tonnes (an estimated 25%
reduction), measured monthly.
• At 12 months, maintain a minimum 25% reduction in bagged recycling contamination or more to
evaluate sustainable campaign impact over time.
• At 18 months, evaluate changes to determine overall business impact since the start of the
campaign.
Understand problem/issue
Discovery sessions were held involving a few teams, including Digital Marketing, Waste Planning and
Waste Collections, to better understand the recycling contamination problem in more depth. These
discovery sessions also provided an opportunity for healthy collaboration among the teams and to
gather input from various subject matter experts.
Through these discovery sessions, the Region examined both the process and available contamination
data, with a focus on monthly MRF in-bound waste audits.
Figure 3 shows an in-bound audit report summary that was examined to help better understand the
contamination issue at the Region’s MRF.
Early into the discussions, the Region identified one main strategy in Figure 3: 2016 Year-To-Date
mind: to focus on a single item or single action that would be easy for Report Summary of Non-Recyclable
residents to quickly understand and take minimal effort to do, but with Material, Curbside Collection
the potential to make a worthwhile and measurable impact at the MRF.
To support this strategy, the teams considered the following key factors:
• Contamination rank by tonnage and percentages from in-bound
waste audit data
• Potential upside for measurable improvement at the MRF and
diversion overall
• Ease of communicating the action to a general audience of
residents in Peel
• Amount of effort it would be for residents to make the change
or take the action
In the end, the Region decided to test a digital-only marketing campaign,
focusing on one single item and action: stop putting recyclables in plastic
shopping bags.
This focus not only addressed the high volume of blue box material in
grocery bags entering the MRF, but it was also an easy behavior to
change, requiring low effort on the resident’s part to recycle. It also
avoided recyclables being processed as garbage and sent to landfill.
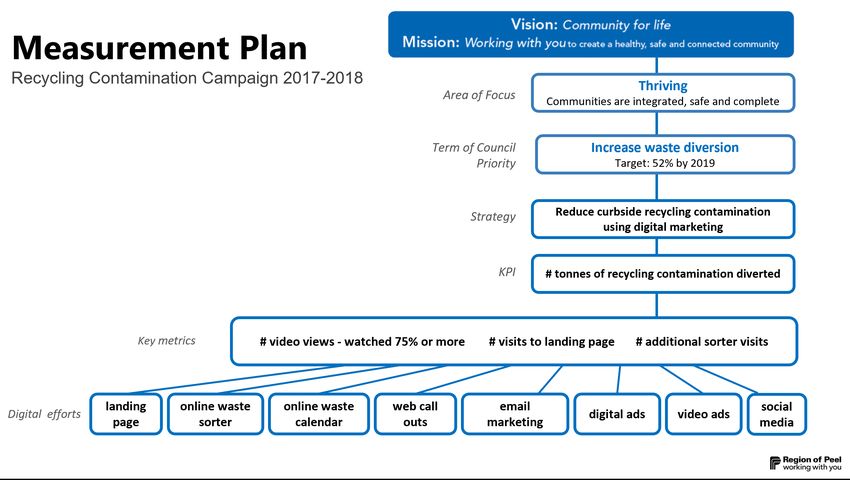
CIF #882 – Final Report – Region of Peel Page 11 of 26This focus also allowed the Region to test how effective it would be to deliver key messages to Peel residents, using only digital-based communication tools (such as video, a custom landing page, social media advertising, search engine advertising, and email marketing) rather than traditional channels (such as newspaper print ads and mobile street signs), to influence behavior change. Create measurement plan Due to the dynamic nature of digital metrics, tied in with in-bound waste audit reporting, staff used digital metric data to uncover insights and make monthly campaign improvements, allowing the team to test, iterate, and optimize results in a nimble fashion. The plan was a staged approach, which included: 1) Test and learn; 2) Ramp up; and 3) Iterate. Plans were to sustain it for at least one year – 15 months in this case – while measuring monthly in-bound audit results at the MRF. The following measurement plan was created to connect the digital metrics with results at the MRF for bagged recycling in plastic grocery bags. Figure 4: Measurement Plan for Recycling Contamination Campaign 2017-2018 The monitoring and measurement methodology is explained in more detail under section 3 of this report. CIF #882 – Final Report – Region of Peel Page 12 of 26
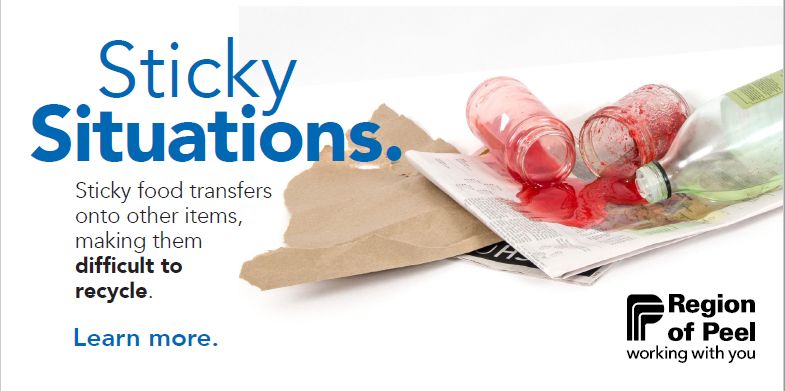
Design Campaign and Implement
Key Messages:
Delivering simple, concise messaging to residents was critical to the effectiveness of the campaign. In
collaboration between the Region’s Marketing and Communications and Waste Management teams, the
following messages were developed and used:
• Let them Loose! Don’t tie recyclables in grocery bags.
• Set them Free! Make your recycling efforts count. Don’t put recyclables in plastic shopping bags.
Recycling tied in grocery bags end up in landfill.
• Visit peelregion.ca/waste to learn more and find out how to properly dispose of hundreds of
items, using our online waste sorter.
Communications Tools Used:
The Region took an integrated digital marketing approach to implement the campaign, using a mix of
digital channels and tactics.
Figure 5: Campaign’s Integrated Digital Marketing Approach
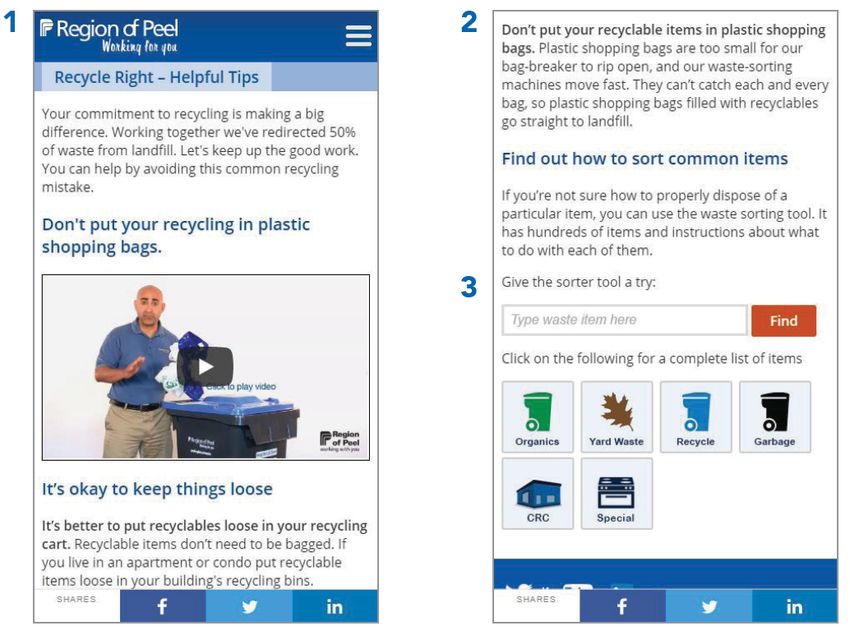
CIF #882 – Final Report – Region of Peel Page 13 of 26A) Landing Page
• Positioned to recognize positive participation and good work done by residents and designed to
be clear and specific with 3 goals: 1) watch the video, 2) consume info, and 3) use the sorter.
Figure 6: Images of Campaign’s Landing Page (Mobile Version)
B) Video
• 46-second video featured on the campaign landing page and promoted on YouTube.
Figure 7: Image of Campaign Video
CIF #882 – Final Report – Region of Peel Page 14 of 26C) Email Marketing:
• Multiple mailings sent to Region of Peel’s email subscriber lists, including Connect to Peel with
over 110,000 subscribers.
Figure 8: Image from Connect to Peel e-Newsletter, August 2017 Issue
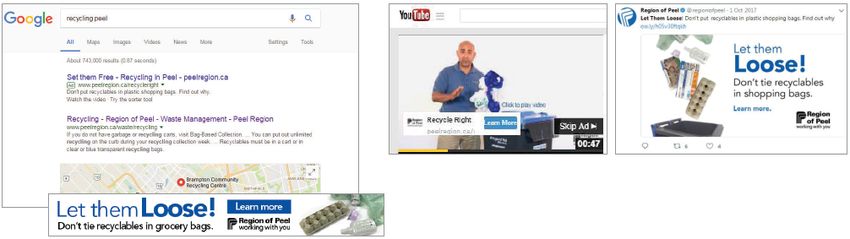
D) Digital and Social Media Advertising:
• Paid promotion using YouTube, Google Ads, Twitter and Facebook to reach Peel residents
Figure 9: Images from Digital/Social Media Advertising (Google, YouTube, Twitter and Facebook)
CIF #882 – Final Report – Region of Peel Page 15 of 26E) Social Media Sharing
• On-page social sharing options and posts on the Region of Peel’s Twitter accounts
Figure 10: Images of Social Media Posts
F) Region of Peel Website – Peelregion.ca
• Featuring waste site banners, waste-specific section web banners, and waste sorter call-outs.
Figure 11: Images of Web Promotion on Region of Peel’s Website (peelregion.ca)
2.2 Monitoring, Measurement Methodology and Analysis
Unlike traditional communication campaigns, where analysis is performed after campaign execution, a
digital marketing campaign is iterative, and data collection and analysis are done during the campaign.
The insights are used to optimize outcomes and make decisions while the campaign is in market. As
such, measurement methodology and analysis are combined and will be discussed together.
CIF #882 – Final Report – Region of Peel Page 16 of 26Staged Monitoring and Analysis The implementation of the Region’s digital marketing campaign was a staged approach, and monitoring digital performance and analysis was done throughout the campaign’s various stages. The “Test and Learn” stage and the “Ramp Up” stage involved more monitoring and analysis due to more experimentation and testing across channels. As the most effective approaches and channels became clear, the monitoring was scaled back and became focused on key metrics (video views, landing page visits, and waste sorter visits). In the early stages, digital metrics and tracking was monitored on a weekly basis across the digital channels in play. To deliver across multi-channels and monitor performance, a variety of analytics platforms were used as shown in Figure 12. Figure 12: Digital Analytics Platforms Used During Campaign From these analytic tools, several categories of metric data were captured and monitored at the beginning of the campaign, as shown in Figure 13. Figure 13: Example of Digital Marketing Metrics Gathered During Campaign’s First 11 weeks CIF #882 – Final Report – Region of Peel Page 17 of 26
A newly-developed measurement plan became the foundation of this work that brought a connection
between two main areas of focus for metrics: business outcomes and digital results. This brought
meaningful context to the results of the campaign.

Business outcomes focused on:
    • Changes with monthly in-bound audit reports, specific to bagged recyclables (see Figure 14)

Figure 14: Bagged Recycling Material at the MRF, January 2015 – April 2018

Digital results focused on:
    • Video views (only counting views where people watched at least 75% of the video – the point
         where the main message is complete in the 46-second video).
    • Visits to the landing page, which featured the video.
    • Increase in online Waste Sorter visits (giving indication to how many times people took the
         “next action” and tried the online waste sorter because of visiting the campaign landing page).

Data-Informed Decision Making

As part of the “Test and Learn” and “Ramp Up” stages, the Region used both monthly in-bound waste
audit data and digital marketing metrics to make ongoing campaign improvements to do more of what
was working.

For example:
    •   Testing different creative with residents and using the creative that performs better.
    •   Adapting to audience preference – using video metrics to be sure people were watching the
        promoted video long enough, rather than producing new or additional videos.
    •   Optimizing advertising spend – spending more on ad types that resulted in lower cost per video
        view (getting more residents to watch the video at a lower cost).

CIF #882 – Final Report – Region of Peel                                                     Page 18 of 26
Further experimentation Phase 2 of the campaign was a further experiment to see if contamination, caused by food contamination in recycling, could be reduced using a similar method. The experiment involved another video campaign focused on emptying food from containers and was launched in September 2018, using a similar digital-only marketing approach with a focus on video advertising as it had proven to be the highest performing channel. The focus on food contamination was based on re-visiting the MRF Figure 15: 2016 Year-To-Date in-bound waste audit data (as shown in Figure 15) that identified Report Summary of Non-Recyclable green bin material as one of the top material types mistakenly Material, Curbside Collection placed in recycling carts. The team knew that messaging focused on emptying food from containers was a bigger ask of residents in terms of effort, and the message was not as clear as it was with bagged recycling. However, given the positive impact that was seen during Phase 1 of the campaign, the team decided to move forward with the experiment. Figure 16 and Figure 17 show the concepts used to guide the wording and approach for the messaging and video content. Figure 16: Creative concepts for Phase 2 of Campaign, Empty Your Containers CIF #882 – Final Report – Region of Peel Page 19 of 26
Figure 17: Screenshot of YouTube Video Preview for Phase 2

Video testing
During the first few weeks of the video campaign, the Region tested two versions of the video to see if
the audience would prefer one video over the other. This was determined by tracking percentage of
video played and view rate.

The differences in the two videos was subtle. One video used more familiar kitchen-like backgrounds for
the sections about what to do. The other video used a plain white studio-type background.

Instead of guessing which video to use, or deciding on a video based on opinions, the Region tested both
and used real-time data to observe if the subtle difference between the videos would impact
performance.

Ultimately, the video with the more familiar kitchen backgrounds performed better, as more people
watched this version longer, in comparison to the second video. The results showed 10% higher
audience retention. Table 4 shows such results after a few weeks.

Table 4: Empty Your Containers A/B Video Test Metric Results

Version 5a: Using kitchen backgrounds
Version 1a: Using plain white studio background

CIF #882 – Final Report – Region of Peel                                                     Page 20 of 26
3. Project Results

Results for this campaign were determined after the completion of each phase (1 and 2), with a focus on
two main types of results:

    •   Business outcomes (using MRF In-bound audit data)
    •   Digital results (using various digital analytics platforms, as mentioned on page 7)

Phase 1 – Bagged Recycling

At the end of Phase 1 (focused on bagged recycling) the following results were determined:

Business Outcomes (June 2017 to December 31, 2018)
    • Nearly 50% reduction of grocery bags in recycling at the Material Recovery Facility
    • 1,110 tonnes of recyclable material diverted from landfill
    • $200,800 in cost savings and additional revenues for Waste Management operations

Analysing several business metrics, a 19-month comparison was used to determine overall campaign
results (see Table 5).
Table 5: Phase 1 Business Outcome Results, Recycling in Grocery Bags, 19-Month Comparison

                                       Recycling In Grocery Bags
                                        19-Month Comparison

                                                Actuals
              Time Period                             Nov '15 - May '17 Jun '17 - Dec '18
              Tonnes Into MRF                               171,803.10        166,938.61
              Recycling Revenue per Tonne            -$          126.22 -$          92.45
              Residue Disposal Cost                   $           69.36 $           72.96

                            Composition of Material in Grocery Bags (Audits)
              Recycling In Grocery Bags (%)                       1.29              0.66 Neary 50% drop
              Recyclable Material (%)                              -               69.95
              Garbage (%)                                          -               30.05

                                              Calculations
              Tonnes to Residue                                2,216.26          1,101.79
              Recycling Revenue                       $             -   -$      71,251.72
              Residue Disposal Costs                  $      153,719.79 $       24,156.28
              Total                                   $      153,719.79 -$      47,095.44

                                           19-month Impact
              Net Savings and Additional Revenue     $             -     $     200,815.24
              Recycling Tonnage Diverted                           -             1,114.47

                                       Projected Annual Impact
              Net Savings and Additional Revenue    $              -     $     126,830.68
              Recycling Tonnage Diverted                           -               703.87

CIF #882 – Final Report – Region of Peel                                                                  Page 21 of 26
Figure 18 demonstrates the drastic decrease in bagged recyclables entering Peel’s MRF since the start of
the campaign.
Figure 18: Bagged Recycling Material at the MRF, January 2015 – December 2018
Digital Results (June 2017 to December 31, 2018)
• Video: watched 1,923,238 times (unique views, with video played to at least 75% of video).
Watch time was equivalent to 18,698 hours or 779 days’ worth of attention.
• Web Landing Page: over 144,000 visits to the custom web landing page
• Waste Sorter Tool: over 32,000 additional visits generated
Phase 2 – Food in Recyclable Containers
Due to the short duration of Phase 2 of the campaign (focused on food in recyclable containers), the
Region was only able to base its metrics on three completed MRF in-bound audits from October –
December 2018.
The Region compared these three audits to the previous 12 months before Phase 2 of the campaign
(September 2017-September 2018), which involved 12 audits worth of data. As such, Phase 2 metrics
could only be analyzed as a small snapshot in time, with a high level of variance and lower level of
confidence in the results.
To address this data challenge, we reported Phase 2 metrics by analyzing composition percentage in the
following two categories:
• Organic contents in recyclable containers
• Loose organics in the recycling stream
CIF #882 – Final Report – Region of Peel Page 22 of 26Since the recycling collection process, by its very nature, creates loose organics that may have been
inside a recyclable container, this posed a challenge to fully validate whether organic material was
originally left in a recyclable container or disposed of loosely into the blue bin. As such, the Region chose
to use a “high-mean-low” format, to give a statistically-valid 95 percent confidence range.
The Region then focused on the mean (average) between the two categories to use as measurement
during Phase 2 implementation.
Table 6 shows the results of these audit metrics.
Table 6: MRF In-Bound Audit Results for Organic-Related Material – Before and After Phase 2
ORGANIC CONTENTS IN RECYCLABLE CONTAINERS High Mean Low
Before Campaign Phase 2 (Sep. 2017-Sep. 2018) 1.24% 0.98% 0.73%
After (October – December 2018) 1.79% 1.31% 0.84%
LOOSE ORGANIC MATERIAL IN RECYCLING STREAM High Mean Low
Before Campaign Phase 2 (Sep. 2017-Sep. 2018) 2.93% 2.52% 2.11%
After (October – December 2018) 3.31% 2.61% 1.90%
At the end of Phase 2, the following results were determined:
Business Outcomes (October – December 2018):
• No significant change in the composition percentage of organic contents in recyclable containers
from October to December 2018, in comparison to audit results from the 2017 year.
• Slight increase of 0.1% in the composition percentage of loose organics in the recycling stream
from October to December 2018, in comparison to audit results from the 2017 year.
Digital Results (September 1, 2018 to December 31, 2018):
• Video: watched 1,181,455 times (unique views, with video played to at least 75% of video).
Watch time was equivalent to 12,800 hours or 533 days’ worth of attention.
In conclusion, digital results during Phase 2 showed successful levels of audience engagement. However,
when comparing audit data before and after Phase 2, any change in business outcomes was determined
to be inconclusive, as there was still significant variance in the results.
CIF #882 – Final Report – Region of Peel Page 23 of 264. Project Budget
Phase 1 (Bagged Recycling) - Cost Breakdown
DURATION: 18 months (June 2017 - December 2018)
COST
TACTIC (external only)
Digital Ad Campaign Management $ 9,605.00
Advertising - Facebook Ad Spend $ 1,382.83
Advertising - Google Ad Spend $ 153,914.85
Advertising - Twitter Ad Spend $ 2,688.00
Video (internal labour cost only) $ -
Custom Web Landing Page (internal labour cost only) $ -
Peelregion.ca Banners / Call-Outs (internal labour cost only) $ -
Email Marketing (internal labour cost only) $ -
$ 167,590.68
Phase 2 (Food in Containers) - Cost Breakdown
DURATION: 3 months (October - December 2018)
COST
TACTIC (external only)
Digital Ad Campaign Management $ 1,200.00
Advertising - Google Ad Spend $ 27,418.73
Video - Internal Cost Only $ -
Custom Web Landing Page (internal labour cost only) $ -
Peelregion.ca Banners / Call-Outs (internal labour cost only) $ -
Email Marketing (internal labour cost only) $ -
$ 28,618.73
TOTAL CAMPAIGN COST = $ 196,209.41
CIF #882 – Final Report – Region of Peel Page 24 of 265. Overall Analysis and Lessons Learned Overall Results Analysis Phase 1 results gave strong indication that the messaging to residents about bagged recycling made an impact with residents, which only required a small shift in resident behaviour (of keeping recycling loose). Business outcomes showed drastic and positive impact, and in-bound MRF audit data showed a significant decrease in the volume of bagged recyclables showing up at the MRF. When analyzing Phase 2 results, there was no significant change in the metrics. Therefore, the Region safely assumes that Phase 2 messaging to “empty your containers” may not have been as clear and straightforward for residents to receive. The instructions provided also required more time and effort for residents to do and might be a completely new task for some to start doing. The Region can also safely assume that – based on the Region’s previous behaviour insights research – the “yuck” factor may have also been a barrier for residents to take action. To increase the level of confidence in this analysis, further research could be conducted with residents to test and gather feedback on the effectiveness of the messaging and visual material used in Phase 2 of the campaign. Lessons Learned Several key learnings and insights were gained from planning and implementation of this campaign. Discovery Sessions Plan adequate time in advance for discovery sessions to develop a deeper understanding of the problem, current state, and the opportunities. Book more sessions than required and pace the sessions so there’s time for reflection. Be open to including a variety of subject matter experts and disciplines. These multidisciplinary sessions, early in the process, helped build trust for effective collaboration and brought multiple perspectives to the situation. Guiding Principles Establish guiding principles for the campaign especially when trying new approaches. The Region found it helped the core team make decisions, work through disagreements, and prevent falling back to old tendencies that may not serve the objectives. Measurement Establish and get agreement on a measurement framework that connects business outcomes and campaign metrics. Define the key performance indicator for the campaign and ensure that it supports the key business outcome for the business or program. With key performance metrics, you can make more effective decisions around ad spend, channels and performance to optimize for the right outcomes. Lifetime value Consider the potential lifetime value or longer-term value of a campaign. In many cases, the impact may extend beyond the campaign’s duration, especially if the campaign may have shifted resident behaviour. If possible, continue to measure the business/program results and financial impact after the campaign finished. Consider any additional labour or measurement costs needed to sustain key performance measures and financial impact over the long-term. These additional ongoing measures and financial impacts can help build a strong business case for future campaigns. CIF #882 – Final Report – Region of Peel Page 25 of 26
Audience testing to make evidence-based decision making
Whenever possible, test with the audience and make decisions based on data. For example, the core
team had varying ideas and opinions on which approach would be best for the “Empty your Containers”
video. The differences were subtle around using plain studio backgrounds or more familiar backgrounds,
such as a kitchen for resident instructions. Instead of trying to come to consensus, test both, evaluate,
and use the one that performed better.

Keep the message simple
To maintain a clear message, avoid the temptation of “information stuffing” to cover minor exceptions
or technical variables. In the Region of Peel’s case, past communications have included messaging that
was technically correct, resulting in main messages competing with extra details and exceptions.

Consider a guiding principle around simplicity to help remind the team that a clear message is more
effective than a more detailed one. For a marketing campaign, try to avoid the temptation to include
extra details to address an exception or technical variable, especially if it is not central to the main
message.

For example, the message for this campaign was very simple: do not put recyclables in tied plastic
grocery bags. However, as is often the case in recycling, there’s an exception because not all recyclables
should be loose. Plastic bags and plastic films should be bundled together and tied in one plastic
grocery bag. There was a temptation to address this in the messaging; however, the team concluded
that it would be best to avoid even mentioning it as part of the video and campaign. It was a good
decision and it helped keep the campaign message clear for residents. A few residents did ask about
whether it was still ok to tie up plastic bags in bundles for recycling, and those questions were addressed
through customer service, and making instructions available through the waste sorter on the Region’s
website.

CIF #882 – Final Report – Region of Peel                                                      Page 26 of 26
You can also read


