SWINBURNE UNIVERSITY OF TECHNOLOGY
←
→
Page content transcription
If your browser does not render page correctly, please read the page content below
SWINBURNE UNIVERSITY OF TECHNOLOGY
               Centre for Sustainable Infrastructure

Crushed Brick as a Supplementary Material in Cement Treated Crushed
                  Concrete Pavement Applications

                      Swinburne Investigators
                           Arul Arulrajah
                         Mahdi Miri Disfani
                          Hamed Haghighi

                       Partner Organisations
                       Sustainability Victoria
                             VicRoads

                          31 August 2013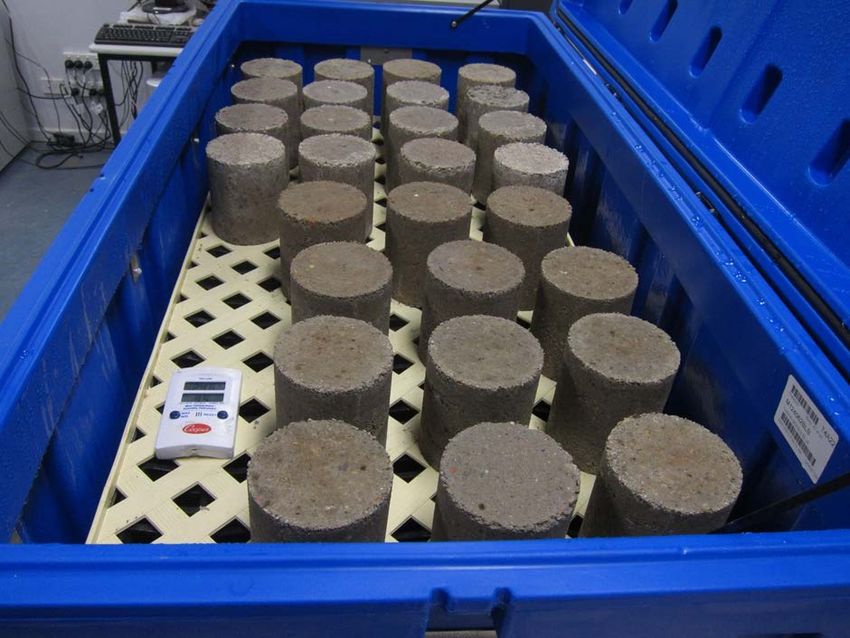
Table of Contents

List of Tables ........................................................................................................................... iii
List of Figures ........................................................................................................................... iv
1     PROJECT BACKGROUND .............................................................................................. 5
2     INTRODUCTION .............................................................................................................. 6
3     RECYCLED MATERIAL SOURCES .............................................................................. 6
4     LABORATORY TESTING METHODOLOGY ............................................................... 7
    4.1      pH ................................................................................................................................ 7
    4.2      Plasticity Index ............................................................................................................ 7
    4.3      Foreign Material Content ............................................................................................ 8
    4.4      Particle Size Distribution ............................................................................................ 8
    4.5      Hydrometer.................................................................................................................. 8
    4.6      Linear Shrinkage Test ................................................................................................. 8
    4.7      California Bearing Ratio ............................................................................................. 8
    4.8      Modified Compaction ................................................................................................. 8
    4.9      Repeated Load Triaxial Test ....................................................................................... 9
    4.10     Unconfined Compressive Strength Test ...................................................................... 9
    4.11     Flexural Beam Test ..................................................................................................... 9
5 EXISTING SPECIFICATIONS FOR CONSTRUCTION & DEMOLITION
MATERIALS IN VICTORIA ................................................................................................. 10
6 ENGINEERING PROPERTIES OF CEMENT TREATED CRUSHED CONCRETE
BLENDED WITH CRUSHED BRICK................................................................................... 12
    6.1      pH .............................................................................................................................. 12
    6.2      Plasticity Index .......................................................................................................... 12
    6.3      Foreign Material Contents......................................................................................... 12
    6.4      Particle Size Distribution .......................................................................................... 14
    6.5      Linear Shrinkage Test ............................................................................................... 14
    6.6      California Bearing Ratio (CBR)................................................................................ 15
    6.7      Modified Compaction Test ....................................................................................... 16
    6.8      Repeated Load Triaxial Test ..................................................................................... 17
    6.9      Unconfined Compression Strength Test ................................................................... 25
    6.10     Beam Fatigue Test ..................................................................................................... 28
7     CONCLUSIONS .............................................................................................................. 32
8     REFERENCES ................................................................................................................. 34

                                                                       ii
List of Tables

Table 1. Required engineering properties of crushed concrete (VicRoads, 2011b) ................ 10
Table 2. Maximum allowable foreign material (%) in crushed concrete ................................ 10
Table 3. Grading requirements for 20 mm Class CC3 crushed concrete................................. 11
Table 4. pH value of crushed concrete-crushed brick blends .................................................. 12
Table 5. Foreign material content of crushed concrete ............................................................ 13
Table 6. Modified compaction results of cement treated (3% GP Cement) ............................ 16
Table 7. RLT specimens moisture contents and degree of compaction .................................. 17
Table 8. Results of permanent strain testing for cement treated .............................................. 23
Table 9. Resilient modulus range of cement treated ................................................................ 24
Table 10. Cementitious binder content and unconfined compressive strength (UCS) ............ 25
Table 11. UCS results of cement treated crushed concrete-crushed brick blends ................... 27
Table 12. Modulus of rupture results ....................................................................................... 30
Table 13. Four point flexural beam fatigue test results ........................................................... 31

                                                              iii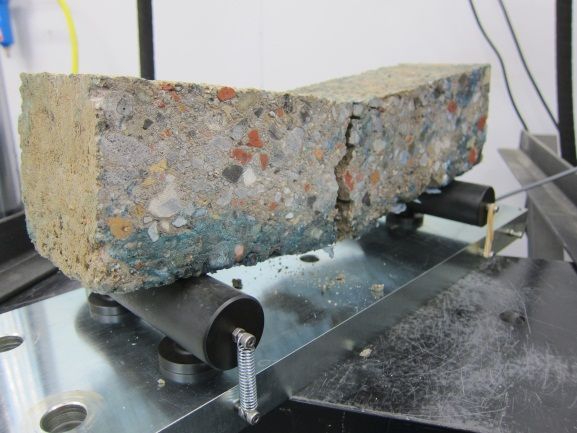
List of Figures

Figure 1. Foreign material contents in crushed concrete ......................................................... 13
Figure 2. Particle size distribution of cement treated .............................................................. 14
Figure 3. Linear shrinkage of cement treated crushed concrete and crushed brick ................. 15
Figure 4. CBR test using MTS-250kN .................................................................................... 15
Figure 5. Load-Penetration curves of cement treated crushed concrete-crushed brick blends 16
Figure 6. Permanent deformation of cement treated crushed concrete (100CC) ..................... 19
Figure 7. Resilient modulus of cement treated crushed concrete (100CC) ............................. 19
Figure 8. Permanent deformation of 85% cement treated crushed concrete (85CC-15CB) .... 20
Figure 9. Resilient modulus of 85% cement treated crushed concrete (85CC-15CB) ............ 20
Figure 10. Permanent deformation of 70% cement treated crushed concrete (70CC-30CB) .. 21
Figure 11. Resilient modulus of 70% cement treated crushed concrete .................................. 21
Figure 12. Permanent deformation of 50% cement treated crushed concrete (50CC-50CB) .. 22
Figure 13. Resilient Modulus of 50% cement treated crushed concrete (50CC-50CB) .......... 22
Figure 14. UCS specimens being cured in fog chamber .......................................................... 26
Figure 15. Slab compaction using BP compactor at an external laboratory facility................ 28
Figure 16. Compacted slabs in fog room ................................................................................. 29
Figure 17. Four point beam fatigue test ................................................................................... 29

                                                             iv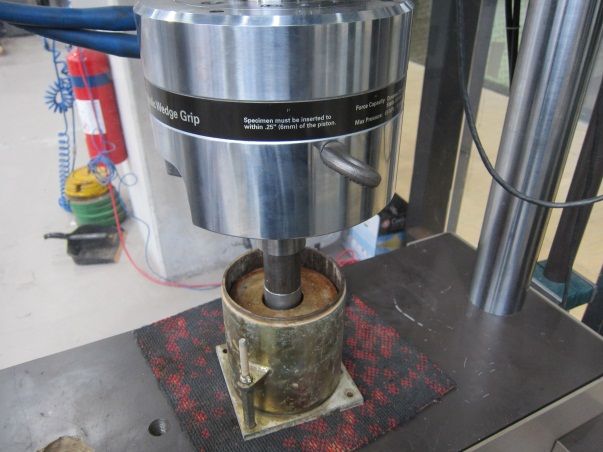
1   PROJECT BACKGROUND

Traditional pavement base and sub-base materials is becoming scarce in some regions. In
some cases, the use of these materials is unsustainable from both an environmental and cost
perspective. VicRoads manages a road network of 151,000 kilometres, from major freeways
to minor local roads. Approximately 50,000 kilometres of this road network is located in
metropolitan Melbourne and requires cement treatment of pavement bases/sub-bases, there
are also similar requirements for municipal roads, which frequently use similar pavement
compositions on local roads. Traditionally, only cement treated crushed rock and crushed
concrete have been used in cement treated pavement bases/sub-bases. There is presently a
state government sustainability initiative to use recycled materials where appropriate and
where they are fit for purpose, particularly in roads and other infrastructures.

This project proposes to investigate the use of crushed brick as a supplementary material with
recycled concrete aggregates in cement treated bound pavement applications. The
development of a procedure for the evaluation of these reclaimed products as a base/sub-base
material would result in an increased level of confidence within industry as to their likely in-
service performance and appropriate application as well as result in a higher uptake of
recycled materials in urban areas where cement treated sub-base pavements are commonly
used.

Currently in Victoria approximately 2.0 million tonnes of crushed concrete and 1.4 million
tonnes of crushed brick are stockpiled annually and these stockpiles are growing. The reuse
of these recycled materials in applications such as road bases/sub-bases will result in a low
carbon solution for future roads, considering that recycled materials have significant carbon
savings compared with virgin quarried materials. The focus of this new research project is on
the laboratory evaluation of crushed brick when used as supplementary material in cement
treated crushed concrete pavement sub-base applications.

Swinburne University has previously been actively undertaking research with VicRoads since
2006 on the use of various recycled demolition materials as pavement sub-bases. Completed
joint research projects and Victorian outcomes to date are as follows:

                                                5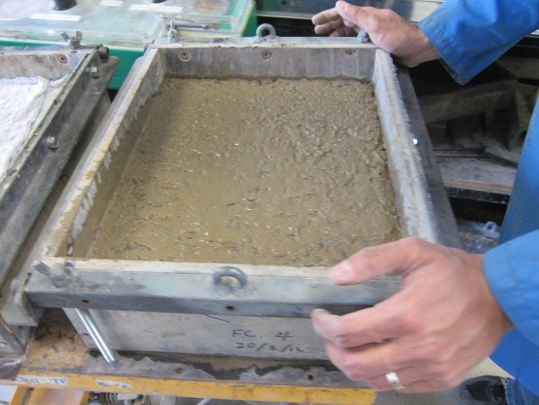
•   15% crushed brick in Class 3 pavement sub-bases (VicRoads Standard Specification
        812 and 820).
    •   50 % crushed brick in footpath bases (Municipal Association of Victoria
        specifications, 2011).
    •   15 % crushed glass in Class 3 pavement sub-bases (VicRoads Standard Specification
        812 and 820).
    •   30 % crushed glass in footpath bases (Municipal Association of Victoria
        specifications, 2011).

2   INTRODUCTION

This applied research project has been undertaken to assess the suitability of crushed brick
when used as a supplementary material in cement treated crushed concrete pavement sub-
base applications.

Crushed concrete and crushed brick materials are commonly obtained from construction and
demolition (C&D) activities. Construction wastes are produced during different phases of
construction. Demolition waste materials arise from demolition activities.

There is now a developing emphasis on environmental management which has resulted in
growing pressure to investigate the viability of reuse of all categories of waste material such
as C&D materials. The use of recycled C&D material would greatly reduce the demand for
landfill sites and for virgin resource materials by re-using what would be normally regarded
as a waste material. Guided by the principles of sound environmental management, more
sophisticated models for waste management involving reuse and recycling have been
developed by governments and industries.

3   RECYCLED MATERIAL SOURCES

Samples of crushed concrete and crushed brick for this project were collected from Delta
Recycling site at Sunshine in Victoria. Delta Recycling, at this site, produces recycled
materials such as crushed concrete, crushed rock in various classes. Crushed brick from the
Delta Recycling site typically comprises graded aggregates up to 20 mm in size.

                                              6
4     LABORATORY TESTING METHODOLOGY

This section describes the test methods used to determine the engineering properties of
cement treated crushed concrete blended with crushed brick. The following geotechnical
laboratory tests are described in this section to determine the engineering properties of
recycled brick when blended (0%, 15%, 30%, and 50%) with cement treated (3% GP cement)
crushed concrete:

      •    pH
      •    Plasticity Index
      •    Foreign Materials Content
      •    Particle Size Distribution
      •    Hydrometer
      •    Linear Shrinkage Test
      •    California Bearing Ratio
      •    Modified Compaction
      •    Repeated Load Triaxial Test
      •    Unconfined Compressive Strength Test
      •    Flexural Beam Test

4.1       pH

pH tests were performed in accordance with AS 1289.4.3.1 “Soil chemical tests -
Determination of the pH value of a soil - Electrometric method” on crushed concrete and
crushed brick (Standards Australia, 1997). Both samples consisted of material passing 2.36
mm sieve.

4.2       Plasticity Index

Plastic limit, liquid limit and plasticity index tests were performed in accordance with AS
1289.3.1.1 “Soil classification tests – Determination of the liquid limit of a soil – Four point
Casagrande method” for liquid limit (Standards Australia, 2009a) and AS 1289.3.2.1 “Soil
classification tests – Determination of the plastic limit of a soil – Standard method” for
plastic limit (Standards Australia, 2009b). Some consideration was given to using the “one
point method” as this method most likely provides adequate characterisation for processed

                                               7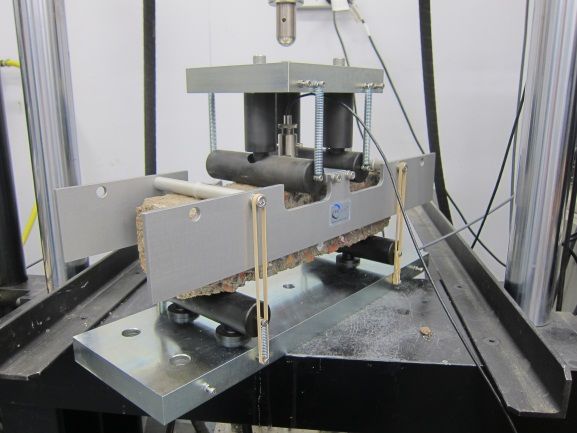
recycled materials with a Plasticity Index ranging between 0 and 2. However, it was decided
in this particular instance with the method normally specified in VicRoads specifications.

4.3   Foreign Material Content

To determine the percentage by mass in the fraction of a crushed concrete product retained on
a 4.75 mm sieve, visual categorisation was carried out according to RC 372.04, VicRoads’
manual of testing: Foreign Materials in Crushed Concrete (VicRoads, 2008).

4.4   Particle Size Distribution

Particle size distribution tests were performed in accordance with AS 1141.11 “Particle size
distribution by sieving” (Standards Australia, 2009d). The Australian Standard sieves used
were with the aperture sizes of 19mm, 13.2mm, 9.5mm, 6.7mm, 4.75mm, 2.36mm, 1.18mm,
600μm, 425μm, 300μm, 150μm and 75μm. The minimum amount of 3 kilograms was sieved
and the particle size distribution was plotted for each blend.

4.5   Hydrometer

A hydrometer was used to determine the particle size distribution for particles finer than the
75µm sieve in accordance with AS 1289.3.6.3 “standard method of fine analysis using a
hydrometer” (Standards Australia, 2003a).

4.6   Linear Shrinkage Test

Linear shrinkage of both crushed concrete and crushed brick were carried out according to
AS 1289.3.4.1: “Determination of the linear shrinkage of a soil” (Standards Australia,
2009c).

4.7   California Bearing Ratio

California Bearing Ratio tests were performed in accordance with AS 1289.6.1.1 “Soil
strength and consolidation tests – Determination of the California Bearing Ratio of a soil –
Standard laboratory method for a remoulded specimen” (Standards Australia, 1998b). The
samples were prepared at their optimum moisture content using “modified” compactive effort
(100% Maximum Dry Density) and tested upon completion of four days soaking condition.

4.8   Modified Compaction

Modified compaction tests were performed in accordance with AS 1289.5.2.1 “Soil
compaction and density tests – Determination of the dry density/moisture content relation of
                                            8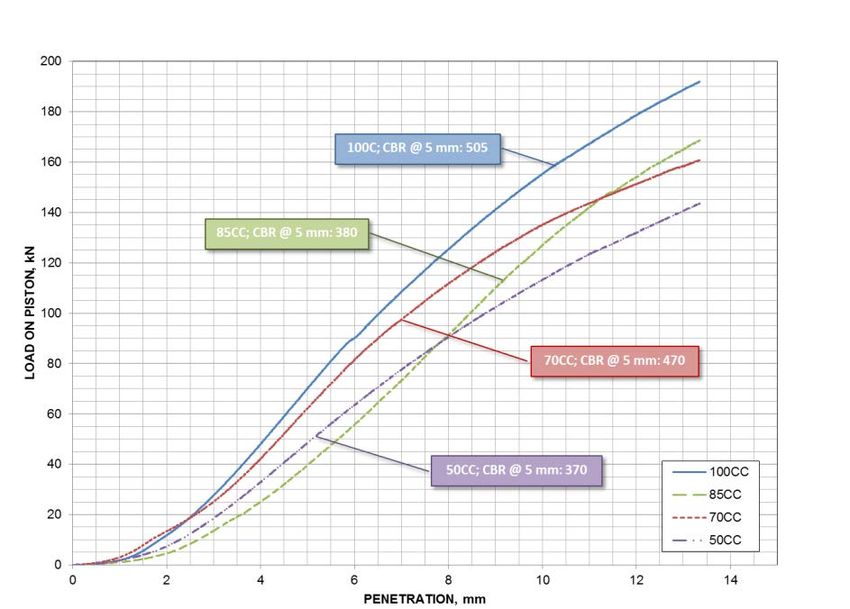
a soil using modified compactive effort” to determine the maximum dry density and optimum
moisture content (Standards Australia, 2003b). Samples were compacted in a 105mm
diameter mould in 5 layers with an average height of 120mm.

4.9       Repeated Load Triaxial Test

Repeated load triaxial (RLT) tests were undertaken in accordance with the Austroads
Repeated Load Triaxial Test Method AG:PT/T053 “Determination of Permanent
Deformation And resilient Modulus Characteristics of Unbound Granular Materials Under
Drained Conditions” (Austroads, 2007). The samples were compacted in a 105mm diameter
mould with the height of 200mm in 8 layers. The samples were then dried back to
approximately 70% of the Optimum Moisture Content (OMC) prior to testing.

4.10 Unconfined Compressive Strength Test

Unconfined Compressive Strength (UCS) test was conducted using AS5101.4 (Standards
Australia, 2008). Samples were prepared fully in accordance with the methods of testing soils
for engineering purposes as prescribed in AS 1289.1.2.1 and AS 1289.5.2.1 (Standards
Australia, 1998a, Standards Australia, 2003b) using “split moulds” to ensure UCS samples
were not damaged during removal and parallel end faces were maintained. The unconfined
compressive strength of the samples was determined after 7 days and 28 days of curing in fog
chamber. The samples were immersed in water for 4 hours prior to testing.

4.11 Flexural Beam Test

Flexural beam test consisted of 3 stages of testing to determine the following properties of the
cement stabilised materials:
      •    Flexural Strength
      •    Flexural Modulus
      •    Fatigue Life
One pair of beams for each blend (4 pairs in total) was prepared at an external laboratory
facility. Flexural strength was subsequently determined in accordance with AS 1012.11
“Determination of the modulus of rupture” (Standards Australia, 2000). Flexural modulus
and fatigue life were determined in accordance with Austroads’ protocols “Flexural Beam
Test Method – Modulus and Fatigue” (Yeo, 2008).

                                               9
5   EXISTING SPECIFICATIONS FOR CONSTRUCTION & DEMOLITION
    MATERIALS IN VICTORIA

In Victoria, the construction of road works is generally in accordance with specifications
established by VicRoads after many years of hands-on practical experience. Standard Section
820 of the VicRoads specification describes requirements for the use of recycled crushed
concrete for pavement sub-base and light duty unbound base (VicRoads, 2011b). The
required engineering properties for recycled crushed concrete and the limitations for foreign
materials are summarised in Table 1 and Table 2 respectively.

    Table 1. Required engineering properties of crushed concrete (VicRoads, 2011b)
                                              Test Value
                  Test                            Class CC2            Class CC3          Class CC4
         Liquid Limit %(Max)                           35                   35                40
         Plasticity Index (Max)                        6                    10                20
    California Bearing Ratio % (Min)                  100                   80                15
    Los Angeles Abrasion Loss(Max)                     30                   35                40
             Flakiness Index                           35                   -                 -

          Table 2. Maximum allowable foreign material (%) in crushed concrete
                                 (VicRoads, 2011a)
                                Foreign Material Type                            % retained
             High density materials such as metal, glass and brick                   3
             Low density materials such as plastic, rubber, plaster, clay
                                                                                     1
             lumps and other friable material
             Wood and other vegetable or decomposable matter                        0.2

Foreign materials in crushed concrete prior to the addition of cementitious binder (GP cement
used in this project) is currently specified to comply with the requirements of Class CC3 as
presented in Table 2 (VicRoads, 2011a).

While the addition of crushed brick or crushed glass to Class 3 or Class 4 sub-base may be
approved as a part of a VicRoads registered crushed rock mix design for “unbound”
pavements.

Currently, the presence of brick and glass is still considered as a foreign material and limited
thus to 3% for cement treated crushed concrete pavement sub-bases (Section 821) as
                                        10
indicated in Table 2. Hence the need for this research to assess the viability of higher
proportions of brick specifically focusing on Section 821.
The grading requirements for uncompacted crushed concrete (Class CC3) are tabulated in
Table 3. This gradation is required ( Section 821) for the Class 3 crushed concrete product
prior to the addition of any cementitious binder, for use as a pavement sub-base (VicRoads,
2011a, VicRoads, 2011b).
Table 3. Grading requirements for 20 mm Class CC3 crushed concrete
(VicRoads, 2011b)
Limits of Grading
Sieve Size Target Grading
Test Value before Compaction
AS (mm) ( % Passing)
(% Passing)
26.5 100 100
19.0 100 95-100
13.2 85 75-95
9.5 75 60-90
4.75 59 42-76
2.36 44 28-60
0.425 19 10-28
0.075 6 2-10
VicRoads sets a reasonably coarse grading envelope for its recycled products to ensure that
the final placed product does not degrade (excessively breakdown) significantly under
compaction. VicRoads generally permits a maximum of 2-3% breakdown on the finer sieve
sizes for sub-base products which allows for some reworking, if required.
116 ENGINEERING PROPERTIES OF CEMENT TREATED CRUSHED
CONCRETE BLENDED WITH CRUSHED BRICK
Laboratory tests were undertaken on prepared samples of cement treated crushed concrete
blended with crushed brick obtained from the Delta Recycling site at Sunshine. 3% GP
cement was used in the cement treated crushed concrete blends. The engineering properties of
the four (4) cement treated crushed concrete blends investigated were: 100% crushed
concrete (100CC), 85% crushed concrete blended with 15% crushed brick (85CC-15CB),
70% crushed concrete blended with 30% crushed brick (70CC-30CB) and 50% crushed
concrete blended with 50% crushed brick (50CC-50CB).
6.1 pH
The pH values of the 4 nominated blends are presented in Table 4. The range of pH value for
crushed concrete is between 11.3 – 12.0 which indicates that all the blends are alkaline by
nature. These values are consistent with previous works by Swinburne on C&D materials.
Table 4. pH value of crushed concrete-crushed brick blends
Type of Material 100CC 85CC-15CB 70CC-30CB 50CC-50CB
pH Value 12.0 11.3 11.9 11.8
6.2 Plasticity Index
As the clay content in all the blends was low, the plastic limit and liquid limit could not be
obtained. This is because the Atterberg limit is directly related to clay mineralogy and thus to
the clay content. Lower clay contents result in lower plasticity.
6.3 Foreign Material Contents
The summary of the foreign material content in the Class 3 crushed concrete sample is
presented in Table 5. Low density materials include plastic, rubber, plaster, clay lumps and
other friable materials. With respect to the crushed brick sample, typically this material will
consist of a mixture of materials including some crushed concrete, low density materials as
well as wood and vegetable matter. The crushed brick samples used were visually assessed
to contain between 50 and 70% brick component.
12Table 5. Foreign material content of crushed concrete
Crushed Concrete
Composition of Samples
Sample
Crushed Concrete (%) 96.44
Crushed Brick (%) 2.62
Asphalt (%) 0.94
Low density materials (%) 0
Wood and vegetable matter (%) 0
With reference to Table 2, the Class 3 crushed concrete sample is on the borderline of the
allowable percentage of foreign material content. The presence of foreign materials in
crushed concrete was visually identified and a photo snapshot of the materials is presented in
Figure 1.
Figure 1. Foreign material contents in crushed concrete
136.4 Particle Size Distribution
The particle size distributions of cement treated crushed concrete and crushed brick are
shown in Figure 2. The grading limits of all blends, except 100% crushed brick, were found
to be within the VicRoads specified limit for class 3 sub-base. Although the crushed brick is
slightly lower than the lower limit for class 3 sub-base but when blended with cement treated
crushed concrete it complies with the acceptable gradation envelope for Class 3 sub-base
materials.
Figure 2. Particle size distribution of cement treated
crushed concrete-crushed brick blends
The red dotted line in Figure 2 indicates the fine particle size distribution which was
determined by hydrometer testing. Similarly, the fine particle size distribution of crushed
brick was shown in blue dotted line.
6.5 Linear Shrinkage Test
Due to the low clay content of crushed concrete and the blends, it was not possible to
measure the linear shrinkage of the materials. Figure 3 shows two sets of linear shrinkage
tests; the left side of each set shows the beginning of the test and the right side of each set
shows the linear shrinkage after 24 hours air-drying followed by transferring the samples in
the oven at 105ºC to 110 ºC until the shrinkage ceased. As it was shown in Figure 3, a change
14in colour was noticed in both cement treated crushed concrete and crushed brick however
there was no significant change in length of the samples.
Crushed Concrete Crushed Brick
Figure 3. Linear shrinkage of cement treated
crushed concrete and crushed brick
6.6 California Bearing Ratio (CBR)
The CBR value of cement treated crushed concrete blends was high and varied from 380 for
85%CC to 505 for 100%CC. Due to high strength of CBR samples, the CBR test was carried
out using a MTS-250kN equipment at Swinburne (Figure 4).
Figure 4. CBR test using MTS-250kN
The load-penetration curves of crushed concrete and its blends are summarised in Figure 5.
The high CBR values are due to cement treatment of all blends as 3% of GP cement was
added as a stabiliser to crushed concrete and its blends.
15Figure 5. Load-Penetration curves of cement treated crushed concrete-
crushed brick blends
6.7 Modified Compaction Test
The results of optimum moisture content (OMC) and maximum dry density (MDD) of
crushed concrete and its blends with crushed brick including 3% GP cement are summarised
in Table 6.
Table 6. Modified compaction results of cement treated (3% GP Cement)
crushed concrete-crushed brick blends
Type of Material 100CC 85CC-15CB 70CC-30CB 50CC-50CB
OMC, % 11.7 11.7 11.7 12
MDD, t/m3 2.039 2.007 1.991 1.996
OMC varies from 11.7% for crushed concrete to 12% for crushed concrete blended with 50%
crushed brick while the MDD declines from 2.039 t/m3 to 1.996 t/m3 for crushed concrete
blended with 50% crushed brick. The OMC and MDD values were found to be consistent,
with only minor variations.
166.8 Repeated Load Triaxial Test
Four specimens were prepared for RLT testing with dynamic compaction effort as specified
by AS 1289.5.2.1(Standards Australia, 2003b). The automatic (mechanical) compaction
apparatus, which permits a continuous and even compaction mode, was used to produce
uniform specimens to specified density and moisture condition. All the specimens were
compacted to the target density of 100% MDD and target moisture content of 100% of the
OMC. The specimens were then dried back to a target value of 70% of the OMC. Table 7
summarises the target (at compaction) and actual (after RLT testing) sample degree of
compaction and moisture content values for each specimen. Generally, it was possible to
prepare the specimens within the tolerance of 0.9% for density ratio using the dynamic
compaction method at 100% OMC. However, it was difficult to obtain the target moisture
contents using the dry-back method. This difficulty in the dry-back method was observed in
previous studies (Vuong et al., 2010) and is an accepted feature of RLT testing. Swinburne’s
Advanced Geotechnical Laboratory RLT testing equipment was used in the laboratory testing
program.
Table 7. RLT specimens moisture contents and degree of compaction
Actual degree
Specimen Target MC, Actual MC– after RLT Target degree of
of compaction,
(% OMC) test (% OMC) compaction, %
%
100CC 70 56 100 99.7
85CC-15CB 70 56 100 99.1
70CC-30CB 70 79 100 99.9
50CC-50CB 70 70 100 100
The RLT testing procedure consists of a permanent strain test followed by a resilient modulus
test. The permanent deformation determination characterises the vertical permanent strain
with multiple loading stages (at different stress conditions) to enable quantification of the
effects of vertical stress on permanent strain in a single test. For the cement treated crushed
concrete blends, 50 kPa confining stress, three different loading stages (at specified deviator
stresses of 350 kPa, 450 kPa and 550 kPa respectively) were used, each loading stage
involved 10,000 repetitions. A confining stress of 50 kPa was applied for all loading stages.
The resilient modulus determination characterises the vertical resilient strain response over
sixty stress conditions using combinations of applied dynamic vertical and static lateral
stresses in the ranges of 100-500 kPa and 20-150 kPa, respectively. Each stress condition
involved 200 load repetitions. The stresses and stress ratios are increased in small sizes to
17avoid early failure, which can occur at high stress ratios. The permanent deformation and
resilient modulus results of cement treated crushed concrete-crushed brick blends are
presented in Figure 6 to Figure 13.
18Figure 6. Permanent deformation of cement treated crushed
concrete (100CC)
Figure 7. Resilient modulus of cement treated crushed concrete
(100CC)
19Figure 8. Permanent deformation of 85% cement treated crushed
concrete (85CC-15CB)
Figure 9. Resilient modulus of 85% cement treated crushed concrete
(85CC-15CB)
20Figure 10. Permanent deformation of 70% cement treated crushed
concrete (70CC-30CB)
Figure 11. Resilient modulus of 70% cement treated crushed concrete
(70CC-30CB)
21Figure 12. Permanent deformation of 50% cement treated crushed concrete
(50CC-50CB)
Figure 13. Resilient Modulus of 50% cement treated crushed concrete
(50CC-50CB)
22The summary of permanent strain, achieved moisture content and degree of compaction
results are presented in Table 8.
Table 8. Results of permanent strain testing for cement treated
crushed concrete-crushed brick blends
Actual Permanent Strain at the end of each stage,
Actual dry
Specimen moisture microstrain
density
content
(% MDD) Stage 1 Stage 2 Stage 3
(% OMC)
100CC 99.7 56 1180 1340 1500
85CC-15CB 99.1 56 940 950 1230
70CC-30CB 99.9 79 1450 1450 1550
50CC-50CB 100 70 2570 2640 2820
In general, there was an increasing trend for permanent deformation with the increase of
moisture content, which is expected. It was difficult to compare the effect of added crushed
brick since the achieved moisture content of specimens after dry-back was not at the same
level.
The Austroads test method gives no guidance on how the RLT results relate to in-service
performance (Vuong et al., 2010) but a simplified method for assessing the performance of
materials has been proposed by Vuong (2000) and Vuong and Arnold (2006), which is
defined as follows:
• Stable – behaviour is defined as a decreasing permanent strain rate and/or decreasing
to constant resilient strain (or constant to increasing modulus) with increasing loading
cycles in the permanent strain test.
• Unstable – behaviour is defined as a decreasing to constant permanent strain rate
and/or constant to increasing resilient strain (or constant to decreasing modulus) with
increasing loading cycles in the permanent strain test.
• Failure – behaviour is defined as a constant to increasing rate of permanent strain and
increasing resilient strain (or decreasing modulus) with increasing loading cycles in
the permanent strain test or when the total permanent strain reaches a nominal failure
strain observed in a static triaxial shear test (say in the range 15,000 to 20,000
microstrain).
23With reference to the permanent deformation results of all cement treated crushed concrete
specimens, the blends are seen to exhibit constant permanent strain rate and increasing
resilient modulus. The behaviour of the materials can thus be defined as “Stable”.
Summary of resilient modulus test results of cement treated crushed concrete-crushed brick
blends are presented in Table 9.
Table 9. Resilient modulus range of cement treated
crushed concrete-crushed brick blends
Specimen Actual dry density Actual moisture content Resilient Modulus Range
(with 3%GP) (% MDD) (% OMC) MPa
100CC 99.7 56 324.5 – 498.3
85CC-15CB 99.1 56 231.1 – 447.9
70CC-30CB 99.9 79 272.5 – 435.6
50CC-50CB 100 70 201.3 – 375.7
In general increasing the percentage of brick indicates a reduction of resilient modulus value
of cement treated crushed concrete blends. This is expected as brick is being added as a
supplementary material to crushed concrete and furthermore is a slightly less durable material
compared to crushed concrete. Since the specimens were not at the same moisture content
level after dry-back for the RLT test, it is difficult to solely isolate the effect of crushed brick
on resilient modulus of cement treated crushed concrete blends.
Typical quarry aggregates would exhibit resilient modulus values of between 225-400 MPa at
70% of the OMC based on the computation of resilient modulus from the permanent
deformation testing phase (Arulrajah and Wilson, 2008). All the blends, were found to
perform within the ranges expected of bound quarry sub-base materials, with 50CC-50CB on
the borderline. It is to be noted, the RLT testing is not a specified in VicRoads Section 821 as
a requirement for cement treated crushed concrete in pavement applications, but was
undertaken in this project in order to better understand the behaviour of the crushed concrete
blends under simulated traffic loading.
246.9 Unconfined Compression Strength Test
The minimum UCS values for a minimum curing period of 7 days are specified in Table 10.
based on the requirements of VicRoads Section 821 (VicRoads, 2011a). Generally in cement
stabilisation, hydration of the cement occurs in association with cement-clay interaction: the
hydrated cement fills voids in the soil by both diffusion and volumetric growth of the
resulting compounds. The strength usually increases as the cement content increases, with an
increase in unconfined compressive strength (UCS) between 0.5-1.0 MPa being achieved for
each 1% of cement added (Sharp, 2009).
Table 10. Cementitious binder content and unconfined compressive strength (UCS)
(VicRoads, 2011a)
Minimum 7 day Mean UCS (MPa)
Minimum Design
Pavement Design Slow Setting
Cementitious Binder Rapid Setting Medium Setting
Modulus (MPa) (Supplementary
Content (% by mass) (GP Cement) (GB Cement)
Cementitious Blends)
≤ 500 3 4 # #
> 500 or ≤ 3500 3 5 3.5 3
UCS samples were compacted in five layers of pre-determined mass using a Proctor
compaction machine and a one-piece split mould (modified compaction as per AS1141.51).
A portion of the remaining material was dried in an oven for the determination of moisture
content of the sample at the time of compaction. Compacted samples were immediately taken
to the fog chamber for moist curing. Seven days samples (four sets of three specimens) were
left in the fog room until the time of testing while samples (four sets of four specimens)
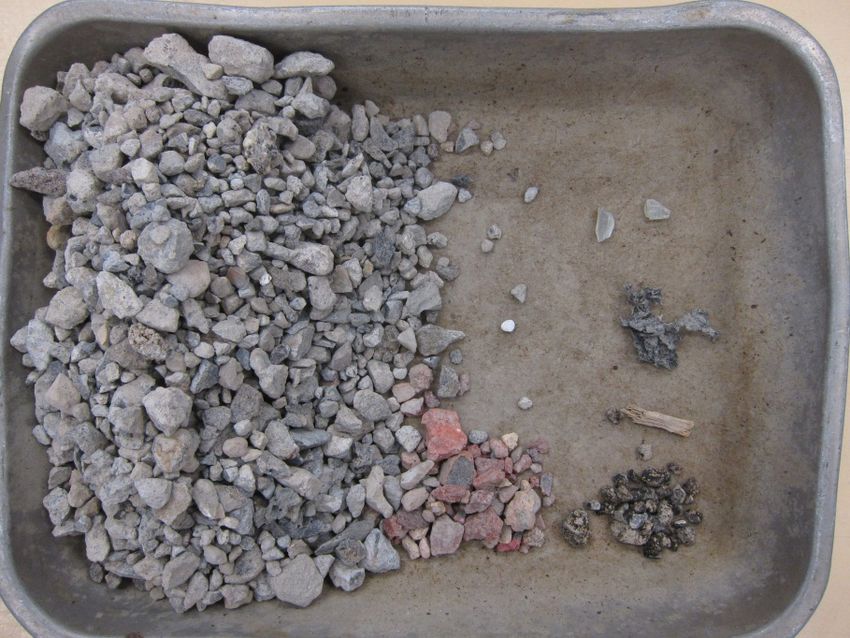
subjected to longer curing periods were removed from the fog room after 28 days (Figure 14).
All samples were subjected to 4 hours of immersing in water prior to the UCS test.
2528 days specimens
7 days specimens
Figure 14. UCS specimens being cured in fog chamber
The UCS results for all the cement treated specimens are summarised in Table 11. For 7 days
curing period the mean UCS value obtained was between 4 to 4.63 MPa for the cement
treated crushed concrete blends. The cement treated crushed concrete blends were therefore
found to meet the minimum 7 day mean UCS value of 4 MPa specified in VicRoads Section
821 (VicRoads, 2011a) for rapid setting (GP) cement.
The 28 days curing period was found to lead to an increase in the mean UCS value for all the
blends to between 5.2 and 7.02 MPa. This is consistent with expectations that a longer curing
period would result in a higher mean UCS value. It is noted that only the 7 day curing period
is specified in VicRoads Section 821(VicRoads, 2011a) but the 28 day curing period tests
were undertaken as an extra measure to determine the performance of the cement treated
crushed concrete blends under increased curing period.
26Table 11. UCS results of cement treated crushed concrete-crushed brick blends
Curing Strength, MPa MC Dry Density
Sample Type Sample ID
Days individual mean Std Dev %OMC %MDD
100CC-28-1 6 92.8 97.1
100CC-28-2 4.9 97.7 95.4
28 5.35 0.47
100CC-28-3 5.6 96 97.6
100CC
100CC-28-4 4.9 100 96.1
(3%GP)
100CC-7-5 3.8 100.2 96.1
100CC-7-6 7 4.2 4.0 0.17 103.1 96.0
100CC-7-7 4 98.7 96.1
85CC-28-1 6 92.3 97.8
85CC-28-2 6.6 94.3 95.8
28 7.02 0.76
85CC-28-3 7.9 97.1 98.0
85CC-15CB
85CC-28-4 7.6 95.7 97.7
(3%GP)
85CC-7-5 3.8 101.5 97.6
85CC-7-6 7 3.6 4.0 0.29 100.6 97.7
85CC-7-7 4.3 101.8 98.2
70CC-28-1 4.6 96.4 97.0
70CC-28-2 5.8 95.7 97.1
28 5.6 0.63
70CC-28-3 6.3 94.5 99.1
70CC-30CB
70CC-28-4 5.9 95.4 98.1
(3%GP)
70CC-7-5 4.8 93.2 98.9
70CC-7-6 7 4.7 4.63 0.17 95.7 99.8
70CC-7-7 4.4 98.3 98.3
50CC-28-1 5.6 89.1 98.7
50CC-28-2 5.8 93.0 98.5
28 5.2 0.54
50CC-28-3 4.5 94.8 97.6
50CC-50CB
50CC-28-4 4.8 95.9 98.2
(3%GP)
50CC-7-5 4.6 96.2 98.2
50CC-7-6 7 4 4.2 0.28 99.9 97.9
50CC-7-7 4 97.1 97.8
276.10 Beam Fatigue Test
A rectangular mould with internal dimensions of 400 mm long x 320 mm wide x 145 mm
high was used to compact the slabs by using BP Slab Compactor at an external laboratory
facility (Figure 15).
Figure 15. Slab compaction using BP compactor at an external
laboratory facility
The compacted slabs were left in the closed mould and covered with a wet cloth and lid to
minimise moisture loss and stored at 23°C for a minimum of 2 days before being de-moulded
and moist cured in a fog room at an external laboratory facility. Each slab was subsequently
cut into two beams after a minimum curing period of 14 days to ensure the slab was strong
enough to be cut. All the beams were cured in fog room for a total of 28 days.
Figure 16 shows three compacted slabs being cured in the fog room. Each slab was cut into
two identical beams which were then used for the flexural beam testing.
28Figure 16. Compacted slabs in fog room
The fatigue testing was conducted in a controlled stress mode. This was considered the most
appropriate simulation of normal repetitive wheel loads, particularly for a given Accelerated
Loading Facility experiment at a given axle load (Yeo, 2008). In accordance with Austroads
method (Yeo, 2008), the first beam from the same slab (Beam A) was used to determine the
peak load required to break the beam using the Modulus of Rupture test method. AS 1012.11
(2000) was used to run this test under a monotonic load. A set of pictures showing the
different stages of four point beam fatigue test are presented in Figure 17.
1 2
3 4
Figure 17. Four point beam fatigue test
29The results of the modulus of rupture tests are presented in Table 12. The modulus of rupture
or tensile stress ranged from 0.88 MPa for 70CC-30CB cement treated crushed concrete to
1.23 MPa for 100CC cement treated crushed concrete. The peak load varied between 3.6 kN
for 70CC-30CB cement treated crushed concrete to 4.29 kN for 100CC cement treated
crushed concrete. According to these results, the increase in crushed brick content in the
cement treated crushed concrete blends results in a corresponding decrease in the peak load
and modulus of rupture, which is as expected.
Table 12. Modulus of rupture results
Sample Type
85CC- 70CC- 50CC-
100CC
15CB 30CB 30CB
(3% GP
(3% GP (3% GP (3% GP
cement)
cement) cement) cement)
width, mm 100.9 101.5 100.23 100.6
height, mm 101.66 101.4 101.08 100.7
moisture content, %OMC 99.1 96.5 106 100.3
dry density, % MDD 96.5 96.5 96 95.4
peak load, kN 4.29 4.28 3.6 3.7
modulus of rupture, MPa 1.23 1.23 0.88 1.09
tensile strain at 95% of
94.22 93.08 57.85 87.48
peak load, microstrain
On completion of the modulus of rupture test on the first beam of each blend, the second
beam from the same slab (Beam B) was used for modulus testing. 40% of the peak load from
the previous test was applied on this second paired beam from the same slab with a haversine
pulse of 1 Hz comprising 250 ms for loading and 750 ms for resting for 100 cycles. This load
was selected to be low enough so as to not damage the sample but high enough to produce
sufficient displacement at the middle of the beam in order to accurately estimate the tensile
strain and consequently resilient (flexural in this case) modulus.
Beam B was subsequently used for fatigue testing. The load was increased to 70% of the
peak load with an increased frequency of 2 Hz comprising 250 ms for loading and 250 ms for
resting. By definition the number of cycles to achieve half the initial modulus is termed as
fatigue life. The half initial modulus is usually very close to the ultimate failure of the sample
for the flexural beam fatigue test. The fatigue life is highly sensitive to the applied load, the
less the applied load the greater the fatigue life. Therefore some samples may fail after a few
30hundred cycles while some other samples may last for several thousand cycles. Table 13
shows the results of flexural modulus and flexural fatigue beam tests. As evident from Table
13 the fatigue life for 100CC was 130 cycles while for 50CC-50CB it was 29401 cycles. This
variation in cycles could be due to the fact that 80% of peak load was applied on 100CC
while 70% of peak load was applied on 50CC-50CB. To obtain a wider spectrum of fatigue
life versus the applied load for each blend, it is recommended to undertake testing on
additional beams to determine true fatigue life characteristics as this is highly dependent on
load sensitivity.
Table 13. Four point flexural beam fatigue test results
Sample type
85CC- 70CC- 50CC-
100CC
15CB 30CB 50CB
(3% GP
(3% GP (3% GP (3% GP
cement)
cement) cement) cement)
width, mm 100.62 102.3 101.05 101.1
height, mm 101.68 100.3 100.6 100.6
moisture content, %OMC 100.8 97.4 107 103.5
dry density, % MDD 95.5 96.2 96.1 95.4
flexural modulus test
applied load, % peak load 40 40 40 40
mean flexural modulus
11463.25 11846.20 11351.33 11780.75
(cycles 50-100), MPa
tensile stress for modulus test,
494.15 496.79 420.26 432.91
kPa
flexural fatigue test
applied load, % peak load 80 70 70 70
tensile stress for fatigue test
978.28 872.18 737.711 758.21
(mean of first 50), kPa
Tensile strain (mean of first
102.05 83.06 78.26 70.95
50), microstrain
initial modulus (first 50), MPa 9601.05 10505.14 9435.30 10700
stress ratio 0.79 0.70 0.84 0.69
strain ratio 1.08 0.89 1.35 0.81
cycles to half initial modulus 130 6597 396 29401
A shift factor of about one third of the initial flexural modulus may give a rough estimation
of field design modulus, though this has yet to be adopted by Austroads protocols
(Choummanivong et al., 2006). Assuming a shift factor of one third of flexural modulus leads
to a minimum design modulus of 3700 MPa for the cement treated crushed concrete blends.
31The results of the flexural beam tests were compared with previous works by Yeo et al.
(2008) on cement treated base materials including hornfel and siltstone. The modulus of
rupture and flexural modulus for all the cement treated blends were found to be consistent
with the previous works which indicates that these blends are suitable for cement treated sub-
bases. The fatigue life was also within the range that has been previously reported, though
additional testing would appropriately determine the true fatigue life as just one test per blend
would not determine this sufficiently.
7 CONCLUSIONS
Samples of crushed concrete and crushed brick for this project were collected from Delta
Recycling site at Sunshine in Victoria to evaluate the influence of crushed brick as a
supplementary material in cement treated crushed concrete pavement applications. Basic
geotechnical tests and specialised tests with the RLT, UCS and flexural beam test were used
to determine the engineering properties of cement treated crushed concrete blends with
crushed brick.
The findings of the advanced tests including RLT, UCS and beam fatigue tests were:
It was found that all the crushed concrete blends had physical properties which comply with
VicRoads Section 821.
The results of RLT were used to ascertain the performance of cement-treated crushed
concrete blends under simulated traffic loading conditions. Based on the results 100CC
demonstrated the highest resilient modulus range and 50CC-50CB demonstrated the lowest
resilient modulus range, which is expected. The results of RLT were found to be very
sensitive to moisture content and degree of compaction. All blends, were found to perform
within the ranges expected of bound quarry sub-base materials with 50CC-50CB on the
borderline. It is noted that the RLT test method is not a Vicroads specification requirement
for use of cement treated aggregates but was undertaken to understand the performance of
the cement treated aggregates under simulated traffic loading.
Mean UCS values met the minimum requirement of 4 MPa for minimum of 7 days curing
for all blends. 20 and 24% increase in strength was observed for 28 days samples of 70CC-
3230CB and 50CC-50CB respectively compared to the 7 days samples, while the average 28
days strength of 85CC-15CB samples improved significantly from 4 to 7.02 MPa (by
almost 75%). The notable increase in strength after 28 days of curing compared to just 7
days of curing is as expected. It is noted that only the 7 day curing period is specified in
Vicroads Section 821. The achieved mean UCS values, particularly after 7 days of curing
were slightly lower than anticipated, and further assessment of this aspect showed that the
moulding moisture content will have a significant influence on the final outcome. The
water/cement ratio’s in the prepared UCS samples were commonly around 4.0 or above,
whereas industry practice is more to target a maximum water/cement ratio of 3.5 as this
provides certainty that the achieved UCS values will comfortably achieve the specification
limits.
The modulus of rupture varied from 0.88 MPa to 1.23 MPa while the flexural modulus
ranged from 11351.33 MPa to 11846.20 MPa. Assuming a shift factor of 0.3, the design
modulus was estimated based on the flexural modulus which ranged from 3405.39 MPa to
3553.86 MPa. The range of flexural fatigue life was between 130 to 29401 cycles. The wide
range of fatigue life is due to the fact that flexural fatigue test is highly sensitive to the
applied load. The results of the flexural beam tests were noted to be consistent with past
works with cement treated quarry produced crushed rock products.
Based on this laboratory assessment, up to 15% crushed brick can be initially recommended
for incorporation as a supplementary material in cement treated crushed concrete pavement
sub-base applications. Depending on the results of field trials, it may be possible to increase
the percentage of crushed brick added in the future.
338 REFERENCES
ARULRAJAH, A. & WILSON, J. 2008. Engineering properties and suitability of recycled crushed
brick for pavement sub-base and as a bedding / granular filter material for drainage systems.
Swinburne University of Technology
AUSTROADS. 2007. Commentary to AG:PT/T053 - determination of permanent deformation and
resilient modulus characteristics of unbound granular materials under drained conditions.
CHOUMMANIVONG, L., YEO, R. & LOURENSZ, S. 2006. Laboratory assessment of cemented
materials. arrb.
SHARP, K. 2009. Guide to Pavement Technology - Part 1: Introduction to Pavement Technology,
Austroads Limited.
STANDARDS AUSTRALIA. 1997. Methods of testing soils for engineering purposes AS 1298.4.3.1
STANDARDS AUSTRALIA. 1998a. Method of testing soils for engineering purposes. AS
1289.1.2.1-1998
STANDARDS AUSTRALIA. 1998b. Methods of testing soils for engineering purposes. AS
1289.6.1.1-1998
STANDARDS AUSTRALIA. 2000. Methods of testing concrete. AS 1012.11 - 2000
STANDARDS AUSTRALIA. 2003a. Method of testing soils for engineering purposes. AS
1289.3.6.3-2003
STANDARDS AUSTRALIA. 2003b. Methods of testing soils for engineering purposes. AS
1289.5.2.1-2003
STANDARDS AUSTRALIA. 2008. Methods for preparation and testing of stabilized materials. AS
5101.4 - 2008
STANDARDS AUSTRALIA. 2009a. Method of testing soils for engineering purposes. AS
1289.3.1.1-2009
STANDARDS AUSTRALIA. 2009b. Method of testing soils for engineering purposes. AS
1289.3.2.1-2009
STANDARDS AUSTRALIA. 2009c. Method of testing soils for engineering purposes. AS
1289.3.4.1-2008
STANDARDS AUSTRALIA. 2009d. Methods for sampling and testing aggregates. AS 1141.11.1-
2009
VICROADS. 2008. Manual of Testing: Foreign Materials in Crushed Concrete. RC 372.04
VICROADS. 2011a. Cementitious treated crushed concrete for pavement subbase. Section 821
VICROADS. 2011b. Crushed concrete for pavement subbase and light duty base. Section 820
VUONG, B. 2000. Technical basis in the development of the Austroads repeated load triaxial test
method and assessment method for granular materials. Vermont South, Victoria. : ARRB
Transport Research.
VUONG, B. & ARNOLD, G. 2006. Predicting in-service performance of alternative pavement
materials for New Zealand conditions. Wellington, NZ: Land Transport New Zealand.
VUONG, B. T., LUKE, R. & LOURENSZ, S. 2010. Laboratory Performance of Recycled Glass as
Subbase Filler. Melbourne: Australian Road Research Board (arrb).
YEO, R. 2008. The Development and Evaluation of Protocols for the Laboratory Characterisation of
Cemented Materials. Austroads.
34You can also read