CODA DIGEST Q1 2019 All-Causes Delay and Cancellations to Air Transport in Europe - Q1 2019 - Eurocontrol
←
→
Page content transcription
If your browser does not render page correctly, please read the page content below

EUROCONTROL

                                      CODA DIGEST
                                          Q1 2019

                                All-Causes Delay and Cancellations
                               to Air Transport in Europe - Q1 2019

                                        FOUNDING
                                        MEMBER
                                                      NETWORK
SUPPORTING EUROPEAN AVIATION                          MANAGER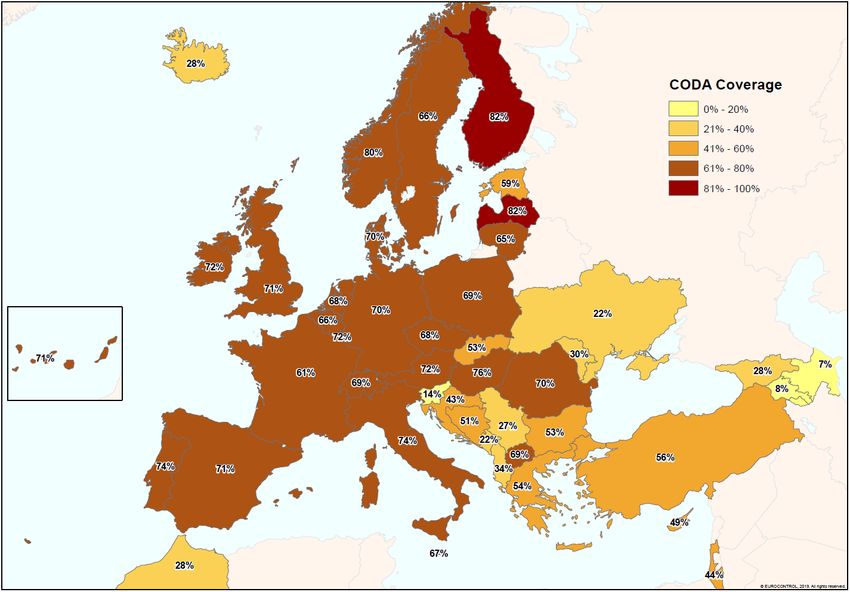
DOCUMENT CHARACTERISTICS
Document Subtitle
Document Title Edition Number Edition Validity Date
(optional)
Use pop-up to enter
CODA DIGEST Q1 2019 CDA_2019_001 11/06/2019
value.
Abstract
Author(s)
Contact Person(s) Tel/email Unit
C. Walker +32 2 729 3391 NMD/PFR/FNI
STATUS AND ACCESSIBILITY
Status Accessible via
Working Draft Intranet
Draft Extranet
Proposed Issue Internet (www.eurocontrol.int)
Released Issue
TLP STATUS
Intended for Detail
Red Highly sensitive, non-disclosable information
Amber Sensitive information with limited disclosure
Green Normal business information
White Public information
©2019 The European Organisation for the Safety of Air Navigation (EUROCONTROL). This document is
published by EUROCONTROL for information purposes. It may be copied in whole or in part, provided that
EUROCONTROL is mentioned as the source and the extent justified by the non-commercial use (not for sale).
The information in this document may not be modified without prior written permission from EUROCONTROL.
Edition Validity Date: 11/06/2019 Edition: CDA_2019_001 Status: Released Issue ii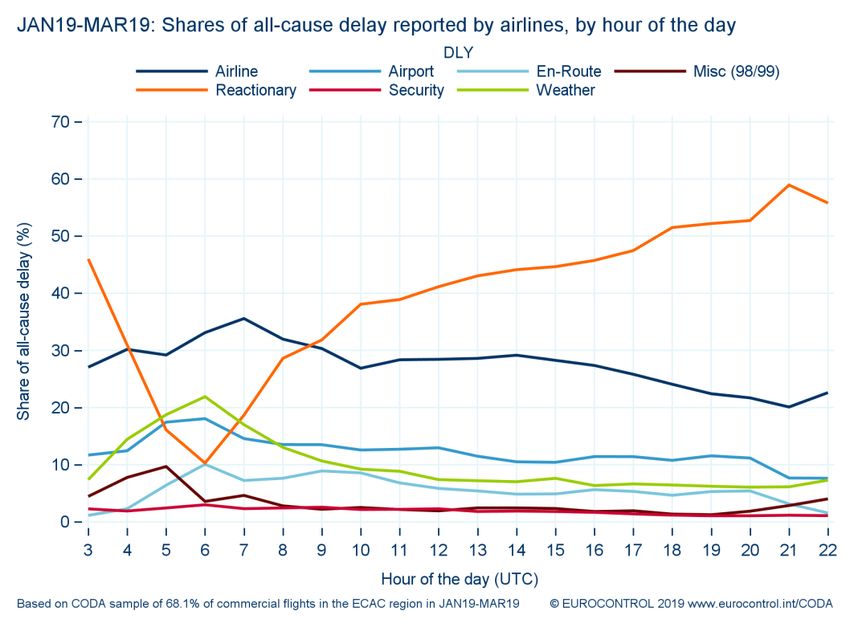
DOCUMENT APPROVAL

Edition Validity Date: 11/06/2019        Edition: CDA_2019_001   Status: Released Issue   iii
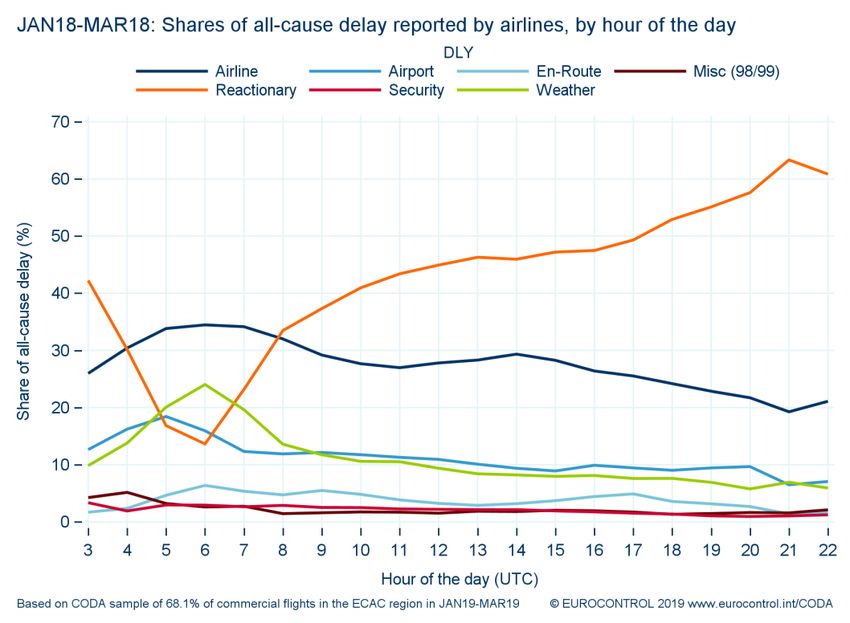
Table of Contents

  DOCUMENT CHARACTERISTICS .................................................................................................................................. II
  DOCUMENT APPROVAL ............................................................................................................................................... III
  TABLE OF CONTENTS .................................................................................................................................................. IV
  1                  EXECUTIVE SUMMARY ........................................................................................................................... 1
  2                  TRAFFIC AND AVERAGE DELAY PER FLIGHT OVERVIEW ................................................................. 2
  3                  Q1 2019 MONTHLY SUMMARY ............................................................................................................... 4
  4                  AVERAGE DELAY PER DELAYED FLIGHT (DEPARTURE) .................................................................. 5
  5                  AVERAGE DELAY PER DELAYED FLIGHT (ARRIVAL) ......................................................................... 6
  6                  NM VERSUS AIRCRAFT OPERATOR EXPERIENCE OF DELAY .......................................................... 7
  7                  PUNCTUALITY .......................................................................................................................................... 8
  8                  OPERATIONAL FLIGHT CANCELLATIONS.......................................................................................... 10
  9                  SCHEDULING INDICATORS .................................................................................................................. 11
  10                 REACTIONARY DELAY ANALYSIS....................................................................................................... 12
  11                 AVERAGE DEPARTURE DELAY PER FLIGHT BY HOUR ................................................................... 13
  12                 AVERAGE DELAY PER DELAYED FLIGHT VS PERCENTAGE OF DELAYED FLIGHTS .................. 14
  13                 TOP 20 DELAY AFFECTED DEPARTURE AIRPORTS ......................................................................... 15
  14                 TOP 20 DELAY AFFECTED ARRIVAL AIRPORTS ............................................................................... 16
  15                 TOP 20 DELAY AFFECTED AIRPORT PAIRS....................................................................................... 17
  16                 YEAR ON YEAR TRENDS IN ALL-CAUSES INDICATORS .................................................................. 18
  17                 CODA DEFINITIONS AND REFERENCES ............................................................................................. 20
  18                 CODA DELAY GROUPINGS................................................................................................................... 22
  19                 CORRELATION BETWEEN IATA DELAY CODES AND THE NM REGULATION CODES .................. 23
  20                 STANDARD IATA DELAY CODES (AHM 730) ...................................................................................... 24
  21                 STANDARD IATA DELAY CODE SUB-CODES (AHM 731) .................................................................. 26
  22                 GLOSSARY OF TERMS AND ABBREVIATIONS .................................................................................. 28
  23                 CODA COVERAGE OF IFR FLIGHTS IN Q1 2019 ................................................................................. 29
  EUROCONTROL MEMBER STATES AND PARTNER COUNTRIES .......................................................................... 29

Edition Validity Date: 11/06/2019                                        Edition: CDA_2019_001                                 Status: Released Issue                     iv

Arrival Punctuality                        Main Delay Causes                      Early Arrivals                                 Departure Delay
                                                    mins/flight

         80.8%                            Reactionary             4.6
                                          Airline                 2.9           12.3% +1.5 %pts                                   11.0 mins/flight
 +2.1 %pts vs. Q1 2018
 Flights arriving within 15 mins of STA   ATFM Airport            0.8             Flights arriving >15 mins of STA
                                                                                                                                 -1.3 mins vs. Q1 2018

    1              Executive Summary
                   Airline punctuality improved by 2.1 percentage points in the first quarter of 2019 (Q1 2019),
                   with 80.8% of arrivals punctual compared to 78.7% in Q1 2018.

                   Airline operations remained the main cause of primary delay, contributing 2.9 minutes to the
                   average delay per flight. However, this was 0.3 minutes per flight better, with airlines making
                   considerable efforts such as scheduling improvements and using spare aircraft to improve on-
                   time performance during Q1 2019. This also meant that reactionary delay fell by 0.9 minutes.

                   Reactionary (knock-on) remained the main cause of delay contributing 4.6 minutes to the
                   average delay per flight. However, its proportion fell with a 42% share of the total generated
                   delay minutes.

                   While their own performance improved, airlines reported that ATFM airport and ATFM en-
                   route delays increased at 0.8 minutes and 0.6 minutes per flight respectively. Reasons driving
                   this were ATC staffing and capacity issues as well as weather.

                   Operational cancellations decreased to 1.8% (from 2.1% in Q1 2018) with industrial action
                   and seasonal weather remaining factors, although to a lesser extent than Q1 2018.

                   Average daily traffic in ECAC increased by 2.4% in Q1 2019 compared to Q1 2018.

                   Put together, these factors resulted in an average all-causes departure delay of 11.0 minutes
                   per flight, down by 1.3 minutes per flight on Q1 2018 when the average delay per flight was
                   12.3 minutes per flight.

    Edition Validity Date: 11/06/2019                             Edition: CDA_2019_001                              Status: Released Issue       1
2 Traffic and Average Delay per Flight Overview
Figure 1. Total Flights per Day in ECAC
European flights (ECAC) in average daily terms increased by 2.4% in Q1 2019 compared with Q1
2018. March saw flight restrictions applied to the Boeing 737 Max, with the network seeing
approximately 200-250 fewer flights by the type. Further information regarding traffic and forecasts
can be found at the STATFOR website and via the STATFOR Interactive Dashboard (SID).
Figure 2. Breakdown of the Average Delay per Delay Flight Q1 2018 vs. Q1 2019
Q1 2019 saw an average departure delay per flight of 11.0 minutes for all-causes delay (Figure 2),
a decrease of 10% in comparison to Q1 2018. Analysis of the delay reasons shows that reactionary
delays contributed the most to the average delay with 4.6 minutes per flight. Airline-related delays
decreased to 2.9 minutes per flight. En-route ATFM delay increased to 0.6 minutes per flight.
Edition Validity Date: 11/06/2019 Edition: CDA_2019_001 Status: Released Issue 2Figure 3. Primary Delay Causes Q1 2018 vs .Q1 2019
Total ATFM delays (airport, en-route and weather delay) reported by airlines increased to 1.7
minutes per flight, with en-route ATFM delay contributing 0.6 minutes flight, predominantly caused
by ATC capacity and ATC staffing issues. Weather delay decreased slightly in the quarter, however
it remained a factor for delays and cancellations.
Figure 4. Long Departure Delays >60 Minutes
In Q1 2019, longer delays (those greater than 60 mins in orange) decreased when compared to Q1
2018 with 3.7% of flights experiencing long delays compared to 4.2% in Q1 2018.
Edition Validity Date: 11/06/2019 Edition: CDA_2019_001 Status: Released Issue 33 Q1 2019 Monthly Summary
Section 3 provides a month-by-month view for Q1 2019, highlighting the particular locations, causes
of delay or disruptions in further detail.
January 2019. Industrial actions by security personnel in Germany caused disruptions at Berlin
Tegel airport on 07 January and Dusseldorf airport on 09 and 10 January. On 15 January eight
further German airports were affected these being Frankfurt-Main, Hamburg, Bremen, Hannover,
Erfurt, Leipzig, Dresden and Munich. Italian ATC industrial action occurred on 11 January with NM
estimating that approximately 250 flights did not operate. Winter weather conditions affected
operations at Lisbon, Istanbul Ataturk and especially Amsterdam Schiphol airports.
February 2019. Industrial action by security personnel at Hamburg on 04 February and Düsseldorf
airport on 07 February affected their respective operations. Belgian ATC industrial action on 13
February generated delays as well as cancellations, NM estimates that 835 flights did not operate
to/from Belgian airports and approximately 1,340 fewer flights did not operate through Brussels ACC.
The volcanic ash cloud due to the eruption of Mt. Etna generated delay at Catania airport from 17 to
22 February. Low visibility and strong winds affected operations at London Heathrow, London
Gatwick, Istanbul Atatürk and Amsterdam Schiphol airports.
March 2019. ATC industrial action occurred in Brussels from 19 to 28 March, there was also ATC
industrial action in France on 19 March. There were en-route ATFM delays in Karlsruhe UAC, as
well as ATC staffing issues in Brussels and Vienna ACCs. Strong winds and low visibility affected
operations particularly at Amsterdam Schiphol and to a lesser extent at London Heathrow. Madrid
Barajas also experienced delays following single runway operations due to work in progress. March
saw flight restrictions applied to the Boeing 737 Max, with the network seeing approximately 200-
250 fewer flights by the type.
Edition Validity Date: 11/06/2019 Edition: CDA_2019_001 Status: Released Issue 44 Average Delay per Delayed Flight (Departure)
The average delay per flight (Figure 5) decreased to 11.0 minutes per flight, compared to 12.3
minutes per flight in Q1 2018. Lower delays during February and March drove this decrease. The
average delay per delayed departure (>=5 minutes) (Figure 6) decreased by 1.0 minute to 27.6
minutes per flight. The percentage of flights delayed on departure (Figure 7) (>=5 minutes) also
decreased, these falling to 40.2% vs. 43.1% in Q1 2018.
Figure 5. Average Delay per Flight (All-Causes) for Departures
Figure 6. Average Delay per Delayed Flight (All-Causes) for Departures
Figure 7. Percentage of Delayed Flights (All-Causes) for Departures
Edition Validity Date: 11/06/2019 Edition: CDA_2019_001 Status: Released Issue 55 Average Delay per Delayed Flight (Arrival)
The average delay per flight on arrival (Figure 8) showed a similar trend to that of the departure
delay at 10.8 minutes per flight, a decrease of 2 minutes per flight when compared to Q1 2018. The
average delay per delayed flight was 29.8 minutes per flight, a decrease of 0.7 minutes when
compared to Q1 2018. The percentage of delayed arrivals (Figure 10) also decreased by 3
percentage points to 36.3%.
Figure 8. Average Delay per Flight (All-Causes) for Arrivals
Figure 9. Average Delay per delayed Flight (All-Causes) for Arrivals
Figure 10. Percentage of Delayed Flight (All-Causes) for Arrivals
Edition Validity Date: 11/06/2019 Edition: CDA_2019_001 Status: Released Issue 66 NM Versus Aircraft Operator Experience of Delay
Figure 11. Breakdown of Average Delay per Flight Q1 2019 vs. Q1 2018 (Network Manager vs. Aircraft
Operator)
Airline data in (Figure 11) shows that the average en-route ATFM delay from all-causes was 0.5
minutes per flight. This was 0.1 minutes per flight higher than the NM-recorded average en-route
ATFM delay per flight for the quarter of 0.4 minutes per flight.
Primary delays (e.g. passenger and ramp handling delays) counted for 58% (6.4 min/flt), with
reactionary delays representing the remaining share of 42% (or 4.6 min/flt). This resulted in an
average departure delay per flight of 11.0 minutes per flight as reported in previous sections.
Edition Validity Date: 11/06/2019 Edition: CDA_2019_001 Status: Released Issue 77 Punctuality
In Q1 2019 overall departure punctuality improved, with 40.5% of flights departing within the 5-
minute threshold before or after the scheduled departure time (STD). Flights delayed >30 minutes
from all causes decreased by 1.2 percentage points to 9.7% compared to Q1 2018.
Figure 12. All-Causes Departure and Arrival Punctuality Q1 2018 vs. Q1 2019
Airline arrival punctuality also improved, with 80.8% of flights arriving within 15 minutes or earlier
than their scheduled arrival time (STA), compared to 78.7% in Q1 2018.
Flights arriving >15 minutes ahead of schedule increased by 1.5 percentage points to 12.3%. Whilst
being good for the passenger experience, this high share may affect operations. Effects being stand
availability and air traffic flow management operations (demand shifts) in the event of aircraft
frequently arriving excessively ahead of their schedule.
Edition Validity Date: 11/06/2019 Edition: CDA_2019_001 Status: Released Issue 8Figure 13. Top 50* Airlines by Arrival On-Time Performance Q1 2019
*The top 50 airlines reporting to CODA by number of flights. Arrival punctuality is calculated as the share of flights arriving within 15 minutes of the scheduled
time (time of arrival at gate)
Figure 14. Top 50* Airlines by Arrival On-Time Performance Q1 2018
During the quarter, more airlines were able to maintain 15-minute arrival punctuality above 85%. A
total of 14 airlines saw more than 85% of their flights arrive within 15 minutes of the scheduled time
of arrival vs. 13 airlines in Q1 2018.
Edition Validity Date: 11/06/2019 Edition: CDA_2019_001 Status: Released Issue 98 Operational Flight Cancellations
Figure 15. Monthly Rate of Operational Cancellations Q1 2019
Figure 16. Average Daily Cancellation 2018 – Q1 2019
Figure 15 shows the monthly rate of operational cancellations (Figure 16) providing details of
cancellations by day from January 2018 to the end of March Q1 2019. It should be noted that initial
cancellations count as ‘operational cancellations’ under the terms of the regulation EC Regulation
N° 390 2013.
In Q1 2019, the operational cancellation rate was 1.8% compared to 2.1% in Q1 2018.
Weather conditions (mainly snowfall) and industrial actions caused disruption during the quarter.
Peaks in cancellations were observed on 15 January following industrial action by German airport
security staff. Snow caused disruption at Munich and Stockholm airports on 03 February. Later in
the quarter, there was industrial action in Belgium on 13 March as well as a bad weather day on 25
March affecting Amsterdam, Frankfurt and Munich.
Edition Validity Date: 11/06/2019 Edition: CDA_2019_001 Status: Released Issue 109 Scheduling Indicators
Two CODA scheduling indicators help airline schedulers determine the optimal schedule based on
historical flight data:
The Delay Difference Indicator - Flight (DDI-F) or the difference between departure and arrival
punctuality expressed in minutes. This can be indicated as a positive or negative figure, for example,
a flight departing with 20 minutes delay and arriving with 30 minutes arrival delay will have a DDI-F
of +10 minutes.
The European DDI-F in Q1 2019 was -4.1 minutes, this was increase in comparison to Q1 2018
where the DDI-F was -3.9 indicating an increase of schedule buffering.
The Block Time Overshoot (BTO) is the percentage of flights with an actual block time that exceeds
the scheduled block time.
The European BTO in Q1 2019 fell at 28.3% compared to 29.6% in Q1 2018.
Figure 17. Block Time Overshoot (BTO) and Delay Difference Indicator - Flight (DDI-F) Q1 2019
Edition Validity Date: 11/06/2019 Edition: CDA_2019_001 Status: Released Issue 1110 Reactionary Delay Analysis
In Q1 2019, the share of reactionary delay (IATA delay codes 91-96) was 42% of delay minutes
contributing 4.6 minutes per flight.
This section concentrates on IATA delay code 93 rotational delays, as these have a significant share
of overall reactionary delays (approximately 90%) and the largest effect on network performance
and passenger experience. In Q1 2019, the share of IATA delay code 93 fell from 40% to 38% when
compared to Q1 2018.
(Figure 18) analysis shows that the median number of scheduled flights per sequence for an aircraft
in Q1 2019 was 5, up from 4 during Q1 2018. The first and third quartile also increased compared
to Q1 2018. A sequence combines flights operated by the same aircraft with a normal planned
ground time between flights. A sequence will end when the aircraft remains on the ground for a
longer time compared to a normal turn-around time, e.g. night stop, maintenance slots etc. An
increase in the scheduled sequence depth may also drive an increase in reactionary delays.
Figure 18. Median Scheduled Flight Sequence Depth and Share of Reactionary Departure Delay on Intra
European Flights: 2018 –Q1 2019.
Edition Validity Date: 11/06/2019 Edition: CDA_2019_001 Status: Released Issue 1211 Average Departure Delay per Flight by Hour
Figure 19. Breakdown of the Average Departure Delay per Flight by Hour of the Day Q1 2018 (top) vs. Q1
2019 (bottom)
Figure 19 highlights the relative stability in the delay situation for the quarter. A slightly higher share
of airport delay can be observed. Reactionary delay share also fell, with its share falling and
remaining below 60% at the end of the operational day.
Edition Validity Date: 11/06/2019 Edition: CDA_2019_001 Status: Released Issue 1312 Average Delay per Delayed Flight vs Percentage of Delayed Flights
Figure 20. ADD vs. PDF on Departure
The better performance in Q1 2019 can be
observed in Figure 20 and Figure 21.
When grouped together in Q1 2019 the
percentage of flights delayed on
departure (>=5 minutes) decreased to
40.2%. The average delay per delayed
(ADD) flight was 27.6 minutes, a
decrease of 1 minute.
Figure 21. ADD vs. PDF on Arrival
The average delay per delayed flight (>=5
minutes) on arrival from all-causes was
29.8 minutes per flight in Q1 2019 a
decrease of 0.7 minutes per flight. The
percentage of delayed arrivals also
decreased, this by 3 percentage points to
36.3% in comparison to Q1 2018.
Use of schedule buffering can be
observed as the percentage of delayed
arrivals decreases, by comparing Figures
20 and 21, as the difference between the
percentage of delayed arrivals and
delayed departures in percentage points.
This has increased year on year from 1.6
% points in Q1 2015 to 3.9 % points in Q1
2019.
Edition Validity Date: 11/06/2019 Edition: CDA_2019_001 Status: Released Issue 1413 Top 20 Delay Affected Departure Airports
Figure 22. All-Causes Delay. Top 20 Affected Departure Airports Q1 2019 (flights delayed >5 mins)
Average
Average Average
Percentage Reactionary
ICAO delay per Delay delay per
Departure airport delayed Delay Per
Code departure Change delayed
departures Departure
(mins) departure
Rank (Mins)
1 PRAGUE VACLAV HAVEL LKPR 14.6 21% 29.3 49.9% 6.0
2 TENERIFE SUR GCTS 14.5 . 31.0 46.8% 5.3
3 SCHIPHOL AMSTERDAM EHAM 14.3 20% 27.9 51.5% 6.6
4 MANCHESTER EGCC 14.2 0% 30.9 46.0% 5.3
5 BRUSSELS NATIONAL EBBR 14.0 -5% 26.6 52.7% 5.1
6 BIRMINGHAM EGBB 14.0 -6% 29.9 46.7% 6.0
7 LONDON CITY EGLC 13.6 . 29.9 45.4% 8.1
8 STOCKHOLM ARLANDA ESSA 13.6 -19% 27.5 49.5% 5.6
9 MUNICH EDDM 13.1 16% 24.7 53.3% 5.0
10 BUDAPEST FERIHEGY LHBP 12.3 -13% 27.6 44.5% 4.5
11 BERLIN SCHOENEFELD EDDB 12.2 -1% 27.8 43.9% 4.3
12 GENEVA LSGG 12.2 -19% 27.0 45.1% 5.9
13 LONDON GATWICK EGKK 12.1 -7% 27.8 43.5% 5.0
14 FRANKFURT MAIN EDDF 12.0 -16% 21.5 55.8% 3.4
15 PARIS CH DE GAULLE LFPG 11.9 -27% 24.4 48.9% 2.4
16 TEL AVIV BEN GURION LLBG 11.8 -16% 24.9 47.5% 4.5
17 BUCHAREST OTOPENI LROP 11.7 -8% 28.3 41.2% 3.5
18 ISTANBUL ATATURK LTBA 11.5 35% 24.4 47.3% 3.1
19 WARSAW CHOPIN EPWA 11.4 . 25.6 44.6% 5.2
20 MILAN MALPENSA LIMC 11.3 -2% 28.0 40.5% 5.4
Prague ranked 1st in the top 20 affected airports (Figure 22) with an average delay per departure of
14.6 minutes, flights departing from the airport suffered from airport and weather delays. Tenerife
Sur airport ranked 2nd with an average delay per flight of 14.5 minutes, with airlines suffering en-route
delays. In a typical seasonal trend, many airports suffered from delays due to weather as shown in
green in (Figure 23). Overall, following the slight improvement in delays for the quarter, the average
delay remained at or below 15 minutes/flight.
Figure 23. Main Delay Causes at the Top 10 Affected Departure Airports
Edition Validity Date: 11/06/2019 Edition: CDA_2019_001 Status: Released Issue 1514 Top 20 Delay Affected Arrival Airports
Figure 24. All-Causes Delay. Top 20 Affected Arrival Airports Q1 2019 (flights delayed >5 mins)
Average Average Average
delay delay Percentage Reactionary
ICAO Delay
Arrival airport per per delayed Delay Per
Code Change
arrival delayed arrivals Arrival
Rank (mins) arrival (Mins)
1 ISTANBUL ATATURK LTBA 15.2 9% 35.6 42.6% 5.9
2 STOCKHOLM ARLANDA ESSA 14.0 -13% 29.6 47.4% 6.6
3 MANCHESTER EGCC 14.0 4% 34.2 40.8% 7.0
4 PRAGUE VACLAV HAVEL LKPR 13.9 16% 30.2 45.8% 7.6
5 LONDON GATWICK EGKK 13.8 2% 34.3 40.3% 6.9
6 HELSINKI VANTAA EFHK 13.5 -1% 27.8 48.6% 6.7
7 BUCHAREST-OTOPENI LROP 13.2 -8% 30.0 43.9% 6.5
8 TEL AVIV BEN GURION LLBG 13.0 13% 26.0 49.8% 3.6
9 AMSTERDAM SCHIPHOL EHAM 12.9 38% 37.2 34.6% 5.1
10 BERLIN SCHOENEFELD EDDB 12.6 10% 32.4 38.9% 6.6
11 BIRMINGHAM EGBB 12.4 -12% 32.4 38.2% 6.7
12 LONDON LUTON EGGW 12.0 -23% 32.1 37.3% 6.8
13 OSLO GARDERMOEN ENGM 11.8 -16% 27.3 43.4% 6.5
14 BRUSSELS NATIONAL EBBR 11.5 -7% 29.3 39.2% 4.3
15 MUNICH EDDM 11.5 16% 28.1 40.7% 7.1
16 LISBON LPPT 11.1 -26% 29.8 37.4% 5.1
17 DUBLIN EIDW 11.0 1% 29.1 37.9% 4.3
18 LONDON STANSTED EGSS 11.0 -30% 31.0 35.5% 4.3
19 EDINBURGH EGPH 10.7 -1% 29.3 36.6% 5.8
20 BUDAPEST FERIHEGY LHBP 10.6 -13% 26.8 39.5% 5.1
Istanbul Ataturk ranked number one for arrival delays in Q1 2019 (Figure 24), with an average delay
per flight on arrival of 15.2 minutes, with high airport and weather delays being observed. Stockholm
Arlanda saw high shares of reactionary delays as well as weather. Amsterdam Schiphol suffered
from very high weather delays during the quarter (Figure 25).
Figure 25. Main Delay Causes at the Top 10 Affected Arrival Airports
Edition Validity Date: 11/06/2019 Edition: CDA_2019_001 Status: Released Issue 1615 Top 20 Delay Affected Airport Pairs
Figure 26. All-Causes Delay Situation for the 20 Most Delayed Airport Pairs Q1 2019
Change
Average since Average Delay Percentage
Delay Per Previous Per Delayed Delayed
Rank Departure Airport Arrival Airport Departure Period Departure Departures
1 BERLIN TEGEL ZURICH 15.0 30% 23.5 64.0%
2 STOCKHOLM ARLANDA HELSINKI VANTAA 14.9 -4% 29.2 51.1%
3 ROME FIUMICINO CATANIA 13.9 52% 29.6 47.0%
4 MUNICH LONDON HEATHROW 12.4 41% 25.7 48.3%
5 STOCKHOLM ARLANDA OSLO GARDERMOEN 12.2 -31% 26.9 45.5%
6 BERLIN TEGEL MUNICH 12.0 39% 27.8 42.9%
7 OULU HELSINKI VANTAA 11.9 -15% 21.1 56.4%
8 GENEVA LONDON HEATHROW 11.7 -20% 27.3 42.9%
9 OSLO-GARDERMOEN STOCKHOLM 11.1 -14% 30.9 36.0%
ARLANDA
10 HELSINKI VANTAA STOCKHOLM 10.9 -15% 26.8 40.6%
ARLANDA
11 LONDON GATWICK DUBLIN 10.8 -3% 31.3 34.7%
12 STOCKHOLM ARLANDA COPENHAGEN 10.6 -28% 22.3 47.6%
KASTRUP
13 CATANIA ROME FIUMICINO 10.5 62% 31.8 32.8%
14 DUSSELDORF MUNICH 10.3 5% 25.4 40.5%
15 THESSALONIKI ATHENS 10.2 5% 52.6 19.4%
16 BERLIN-TEGEL FRANKFURT MAIN 10.1 13% 21.0 48.2%
17 HAMBURG MUNICH 10.1 -25% 24.9 40.4%
18 MUNICH HAMBURG 10.0 0% 21.5 46.7%
19 MUNICH COLOGNE BONN 10.0 14% 26.2 38.0%
20 MUNICH BERLIN TEGEL 9.9 46% 24.9 39.8%
Flights between Berlin Tegel and Zurich ranked highest in the most delayed airport pairs (Figure
26) in Q1 2019, with flights on this route suffering from reactionary and ATFM en-route delays.
Flight between Stockholm and Helsinki were mainly delayed by weather. Flights between Rome
Fiumicino and Catania experienced arrivals delays following works in progress. The airport was
also affected by the eruption of Mt. Etna from 17 to 22 February. Munich features in seven of the
top 20 affected pairs with weather being the main cause of delays at the airport during the quarter.
Edition Validity Date: 11/06/2019 Edition: CDA_2019_001 Status: Released Issue 1716 Year on Year Trends in All-Causes Indicators
This section summarises the year-on-year trends in the main indicators of delay from all-causes. A
flight is considered delayed from 5 minutes.
The improved performance in Q1 2019 can be observed in (Figures 27, 28 and 29). Further
references to these graphs can be found in sections 4 and 5.
Figure 27 Average all-causes delay delayed flight (departures top, arrivals bottom)
Figure 28. Percentage of flights delayed for all-causes delay (departures top, arrivals bottom)
Edition Validity Date: 11/06/2019 Edition: CDA_2019_001 Status: Released Issue 18Figure 29. Percentage of flights delayed >15mins for all-causes (departures top, arrivals bottom) Edition Validity Date: 11/06/2019 Edition: CDA_2019_001 Status: Released Issue 19
17 CODA Definitions and References
NM Versus Aircraft Operator Experience of Delay
ATFM delays calculated by NM are the (flight) planned “delays” based on restrictions applied; the
airlines report the “actual” experienced ATFM delay on departure. For instance, a flight with an ATFM
restriction may also have a handling delay. For the airline, a part of this delay is the ATFM delay and
the rest is the handling delay; for NM it is all ATFM delay.
In the event of a longer duration delay, an example being during ATC industrial action, a flight may
keep its original schedule however when its flight plan is submitted for example a day later any ATFM
delay allocated may be lower or zero, in this case airline reported delay will exceed NM reported
ATFM delay.
Operational Flight Cancellations
These results are based on operational cancellation data supplied by 30 European coordinated
airports reporting to CODA under EC Regulation N° 390 2013. Albeit based on data supplied by
a restricted list (see the conditions below) of major European airports, these results already give a
good indication of trends and effects of Network events like industrial actions or extreme weather.
The IFR flight coverage at the individual airports included in this analysis is 100%. Those airports
currently unable to report operational cancellations in the required data format or those not meeting
all of the criteria for operational cancellations were excluded from the analysis.
According to Annex V of EC Regulation N°390 2013 an ‘Operational Cancellation’ means an arrival
or departure scheduled flight to which the following conditions apply:
The flight received an airport slot, and
The flight was confirmed by the air carrier the day before operations and or it was
contained in the daily list of flight schedules produced by the airport operator the day
before of operations, but
The actual landing or take-off never occurred.
Therefore this section of the CODA Digest reports on monthly and daily shares of operational
cancellations of the total planned flights at day -1. Like delays, operational cancellations provide an
insight into the impact of network events and associated disruption; e.g. industrial action or extreme
weather events.
CODA Scheduling Indicators
Two CODA scheduling indicators help airline schedulers determine the optimal schedule based on
historical flight data.
Scheduling correctly is a difficult art: if too long a time is blocked for a flight, the airline will not be
able to make best use of resources - staff, airframes, infrastructure. Too short a time can arguably
be worse as late flights generate rotational delay with late incoming aircraft and passengers from
previous flights having to be accommodated. When flights leave on time but arrive after the
scheduled time of arrival they cause reactionary delays. Schedule padding is essential for air
carriers in order to find schedules which work with the typical patterns of delay, so that they can
deliver passengers on time, and get maximum use out of their aircraft. Consequently, when delays
decrease it takes one or two (IATA) seasons for the airline to adapt its schedule accordingly.
The Delay Difference Indicator - Flight (DDI-F) or the difference between departure and arrival
punctuality expressed in minutes. This can be indicated as a positive or negative figure, for example,
a flight departing with 20 minutes delay and arriving with 30 minutes arrival delay will have a DDI-F
of +10 minutes.
The Block Time Overshoot (BTO) is the percentage of flights with an actual block time that exceeds
the scheduled block time.
Edition Validity Date: 11/06/2019 Edition: CDA_2019_001 Status: Released Issue 20Reactionary Delay Analysis
Reactionary delays are generated as a result of an aircraft’s late arrival from a previous flight, which
in turn affects the punctuality of its next flight with the same aircraft, as well as potentially delaying
connecting passengers. See the IATA Standard Delay Codes section for an overview of the IATA
reactionary delay codes. Subsequently there are two types of reactionary delays: firstly as a result
of the same aircraft being delayed on its next flight (rotational delay) and secondly when another
aircraft is delayed as a result of another aircraft typically through passengers, crew and load
connection (non-rotational delays).
A sequence combines flights operated by the same aircraft with a normal planned ground time
between flights. A sequence will end when the aircraft remains on the ground for a longer time
compared to a normal turn-around time, e.g. night stop, maintenance slots etc. An increase in the
scheduled sequence depth may also drive an increase in reactionary delays.
Edition Validity Date: 11/06/2019 Edition: CDA_2019_001 Status: Released Issue 2118 CODA Delay Groupings
IATA
CODA CAUSE Description
Code
Passenger and Baggage 11-19
Cargo and Mail 21-29
Aircraft and Ramp Handling 31-39
Technical and Aircraft Equipment 41-48
Airline
Damage to Aircraft & EDP Automated Equipment
Failure 51-58
Flight Operations and Crewing 61-69
Primary Delay Causes
Other Airline Related Causes Others
ATFM due to Restriction at Destination Airport 83
Airport Facilities 87
Airport
Restrictions at Airport of Destination 88
Restrictions at Airport of Departure 89
ATFM due to ATC En-Route Demand Capacity 81
En-Route
ATFM due to ATC Staff Equipment En-Route 82
Governmental Security and Immigration 85-86
Weather (other than ATFM) 71-77
Weather
ATFM due to Weather at Destination 84
Miscellaneous Miscellaneous 98-99
Reactionary Late Arrival of Aircraft, Crew, Passengers or Load 91-96
Edition Validity Date: 11/06/2019 Edition: CDA_2019_001 Status: Released Issue 2219 Correlation between IATA Delay Codes and the NM Regulation Codes
Note: updated version published in the ATFCM Users Manual 20.1.11
1
http://www.eurocontrol.int/sites/default/files/content/documents/nm/network-operations/HANDBOOK/atfcm-users-
manual-current.pdf
Edition Validity Date: 11/06/2019 Edition: CDA_2019_001 Status: Released Issue 2320 Standard IATA Delay Codes (AHM 730)
Others
00-05 AIRLINE INTERNAL CODES
06 (OA) NO GATE STAND AVAILABILITY DUE TO OWN AIRLINE ACTIVITY Including Early Arrivals
09 (SG) SCHEDULED GROUND TIME LESS THAN DECLARED MINIMUM GROUND TIME
Passenger and Baggage
11 (PD) LATE CHECK-IN, acceptance after deadline
12 (PL) LATE CHECK-IN, congestions in check-in area
13 (PE) CHECK-IN ERROR, passenger and baggage
14 (PO) OVERSALES, booking errors
15 (PH) BOARDING, discrepancies and paging, missing checked-in passenger
16 (PS) COMMERCIAL PUBLICITY PASSENGER CONVENIENCE, VIP, press, ground meals and missing
personal items
17 (PC) CATERING ORDER, late or incorrect order given to supplier
18 (PB) BAGGAGE PROCESSING, sorting etc.
19 (PW) REDUCED MOBILITY, boarding deboarding of passengers with reduced mobility.
Cargo and Mail
21 (CD) DOCUMENTATION, errors etc.
22 (CP) LATE POSITIONING
23 (CC) LATE ACCEPTANCE
24 (CI) INADEQUATE PACKING
25 (CO) OVERSALES, booking errors
26 (CU) LATE PREPARATION IN WAREHOUSE
27 (CE) DOCUMENTATION, PACKING etc (Mail Only)
28 (CL) LATE POSITIONING (Mail Only)
29 (CA) LATE ACCEPTANCE (Mail Only)
Aircraft and Ramp Handling
31 (GD) AIRCRAFT DOCUMENTATION LATE INACCURATE, weight and balance, general declaration, pax
manifest, etc.
32 (GL) LOADING UNLOADING, bulky, special load, cabin load, lack of loading staff
33 (GE) LOADING EQUIPMENT, lack of or breakdown, e.g. container pallet loader, lack of staff
34 (GS) SERVICING EQUIPMENT, lack of or breakdown, lack of staff, e.g. steps
35 (GC) AIRCRAFT CLEANING
36 (GF) FUELLING DEFUELLING, fuel supplier
37 (GB) CATERING, late delivery or loading
38 (GU) ULD, lack of or serviceability
39 (GT) TECHNICAL EQUIPMENT, lack of or breakdown, lack of staff, e.g. pushback
Technical and Aircraft Equipment
41 (TD) AIRCRAFT DEFECTS.
42 (TM) SCHEDULED MAINTENANCE, late release.
43 (TN) NON-SCHEDULED MAINTENANCE, special checks and or additional works beyond normal
maintenance schedule.
44 (TS) SPARES AND MAINTENANCE EQUIPMENT, lack of or breakdown.
45 (TA) AOG SPARES, to be carried to another station.
46 (TC) AIRCRAFT CHANGE, for technical reasons.
47 (TL) STAND-BY AIRCRAFT, lack of planned stand-by aircraft for technical reasons.
48 (TV) SCHEDULED CABIN CONFIGURATION VERSION ADJUSTMENTS.
Damage to Aircraft & EDP Automated Equipment Failure
51 (DF) DAMAGE DURING FLIGHT OPERATIONS, bird or lightning strike, turbulence, heavy or overweight
landing, collision during taxiing
52 (DG) DAMAGE DURING GROUND OPERATIONS, collisions (other than during taxiing), loading off-loading
damage, contamination, towing, extreme weather conditions
55 (ED) DEPARTURE CONTROL
56 (EC) CARGO PREPARATION DOCUMENTATION
57 (EF) FLIGHT PLANS
58 (EO) OTHER AUTOMATED SYSTEM
Flight Operations and Crewing
61 (FP) FLIGHT PLAN, late completion or change of, flight documentation
62 (FF) OPERATIONAL REQUIREMENTS, fuel, load alteration
63 (FT) LATE CREW BOARDING OR DEPARTURE PROCEDURES, other than connection and standby
(flight deck or entire crew)
64 (FS) FLIGHT DECK CREW SHORTAGE, sickness, awaiting standby, flight time limitations, crew meals,
valid visa, health documents, etc.
65 (FR) FLIGHT DECK CREW SPECIAL REQUEST, not within operational requirements
66 (FL) LATE CABIN CREW BOARDING OR DEPARTURE PROCEDURES, other than connection and
standby
Edition Validity Date: 11/06/2019 Edition: CDA_2019_001 Status: Released Issue 2467 (FC) CABIN CREW SHORTAGE, sickness, awaiting standby, flight time limitations, crew meals, valid visa,
health documents, etc.
68 (FA) CABIN CREW ERROR OR SPECIAL REQUEST, not within operational requirements
69 (FB) CAPTAIN REQUEST FOR SECURITY CHECK, extraordinary
Weather
71 (WO) DEPARTURE STATION
72 (WT) DESTINATION STATION
73 (WR) EN ROUTE OR ALTERNATE
75 (WI) DE-ICING OF AIRCRAFT, removal of ice and or snow, frost prevention excluding unserviceability of
equipment
76 (WS) REMOVAL OF SNOW, ICE, WATER AND SAND FROM AIRPORT
77 (WG) GROUND HANDLING IMPAIRED BY ADVERSE WEATHER CONDITIONS
Air Traffic Flow Management Restrictions
81 (AT) ATFM due to ATC EN-ROUTE DEMAND CAPACITY, standard demand capacity problems
82 (AX) ATFM due to ATC STAFF EQUIPMENT EN-ROUTE, reduced capacity caused by industrial action or
staff shortage, equipment failure, military exercise or extraordinary demand due to capacity reduction
in neighbouring area
83 (AE) ATFM due to RESTRICTION AT DESTINATION AIRPORT, airport and or runway closed due to
obstruction, industrial action, staff shortage, political unrest, noise abatement, night curfew, special
flights
84 (AW) ATFM due to WEATHER AT DESTINATION
Airport and Government Authorities
85 (AS) MANDATORY SECURITY
86 (AG) IMMIGRATION, CUSTOMS, HEALTH
87 (AF) AIRPORT FACILITIES, parking stands, ramp congestion, lighting, buildings, gate limitations, etc.
88 (AD) RESTRICTIONS AT AIRPORT OF DESTINATION, airport and or runway closed due to obstruction,
industrial action, staff shortage, political unrest, noise abatement, night curfew, special flights
89 (AM) RESTRICTIONS AT AIRPORT OF DEPARTURE WITH OR WITHOUT ATFM RESTRICTIONS,
including Air Traffic Services, start-up and pushback, airport and or runway closed due to obstruction
2
or weather , industrial action, staff shortage, political unrest, noise abatement, night curfew, special
flights
Reactionary
91 (RL) LOAD CONNECTION, awaiting load from another flight
92 (RT) THROUGH CHECK-IN ERROR, passenger and baggage
93 (RA) AIRCRAFT ROTATION, late arrival of aircraft from another flight or previous sector
94 (RS) CABIN CREW ROTATION, awaiting cabin crew from another flight
95 (RC) CREW ROTATION, awaiting crew from another flight (flight deck or entire crew)
96 (RO) OPERATIONS CONTROL, re-routing, diversion, consolidation, aircraft change for reasons other than
technical
Miscellaneous
97 (MI) INDUSTRIAL ACTION WITH OWN AIRLINE
98 (MO) INDUSTRIAL ACTION OUTSIDE OWN AIRLINE, excluding ATS
99 (MX) OTHER REASON, not matching any code above
SOURCE: IATA – Airport Handling Manual (730 & 731)
2
Restriction due to weather in case of ATFM regulation only, else refer to code 71 (WO)
Edition Validity Date: 11/06/2019 Edition: CDA_2019_001 Status: Released Issue 2521 Standard IATA Delay Code Sub-Codes (AHM 731)
73 (WR) WEATHER: EN ROUTE OR ALTERNATE
Z OUTSIDE AIRCRAFT LIMITS
Y OUTSIDE CREW LIMITS
X ETOPS
81 (AT) ATFM DUE TO ATC EN-ROUTE DEMAND CAPACITY, standard demand capacity problems
Z ATC ROUTEING
Y HIGH DEMAND OR CAPACITY
X ENVIRONMENTAL
W WEATHER
G OTHER
82 (AX) ATFM DUE TO ATC STAFF EQUIPMENT EN-ROUTE, reduced capacity caused by industrial
action or shortage or equipment failure, extraordinary demand due to capacity reduction in
neighbouring area
Z INDUSTRIAL ACTION
Y EQUIPMENT FAILURE
X STAFF SHORTAGE
W MILITARY ACTIVITY
V SPECIAL EVENT
83 (AE) ATFM DUE TO RESTRICTION AT DESTINATION AIRPORT, airport and or runway closed due
to obstruction, industrial action, staff shortage, political unrest, noise abatement, night
curfew, special flights
Z HIGH DEMAND ATC CAPACITY
Y INDUSTRIAL ACTION
X EQUIPMENT FAILURE
W STAFF SHORTAGE
V ACCIDENT INCIDENT
U MILITARY ACTIVITY
T SPECIAL EVENT
S NOISE ABATEMENT NIGHT CURFEW
P HIGH DEMAND AIRPORT FACILTIES
85 (AS) MANDATORY SECURITY
Z MANDATORY SECURITY CHECK
Y SECURITY CONTROL CHECKPOINTS
X BAGGAGE AVI SECURITY
W BAGGAGE IDENTIFICATION UNLOADING INTENDED
V AIRPORT TERMINAL SECURITY
U AIRLINE AIRCRAFT SECURITY CHECK
T EXTRAORDINARY SECURITY EVENTS
G OTHER
86 (AG) IMMIGRATION, CUSTOMS, HEALTH
Z IMMIGRATION EMMIGRATION
Y CUSTOMS
X HEALTH
G OTHER
87 (AF) AIRPORT FACILITIES, parking stands, ramp congestion, lighting, buildings, gate limitations,
etc.
Z PARKING STANDS LIMITATION NO PARKING STANDS AVAILABLE, EXCLUDING EARLY ARRIVALS
Y RAMP CONGESTION, ABNORMAL STAND ACCESS LIMITATION (NON-ATC)
X BUILDINGS
W GATE LIMITATION NO GATE AVAILABLE EXCLUDING EARLY ARRIVALS
V BAGGAGE SORTING SYSTEM DOWN SLOW
U NO PUSH BACK CLEARANCE DUE TO INFRASTRUCTURE (NON-ATC)
T JET BRIDGE INOPERATIVE
S LACK OF CHECK IN COUNTERS
R AIRFIELD ELECTRICAL SYSTEM FAILURE
P PASSENGER TRANSPORT SYSTEM FAILURE
N PUBLIC ADDRESS FLIGHT INFORMATION DISPLAY SYSTEM FAILURE
M INSUFFICIENT FIRE COVER
J LATE POSITIONING OF AIRCRAFT (WHEN RESPONSIBILITY OF AIRPORT)
I SERVICE ROAD RESTRICTION
H LATE ARRIVAL OR LACK OF FOLLOW ME VEHICLE
G ANY OF THE ABOVE AT THE DESTINATION AIRPORT
Edition Validity Date: 11/06/2019 Edition: CDA_2019_001 Status: Released Issue 2689 (AM) RESTRICTIONS AT AIRPORT OF DEPARTURE WITH OR WITHOUT ATFM RESTRICTIONS,
including Air Traffic Services, start-up and pushback, airport and or runway closed due to
obstruction or weather.
Z ATC CAPACITY
Y ATC INDUSTRIAL ACTION
X ATC STAFFING
W ATC EQUIPMENT
V ATC ACCIDENT INCIDENT
U MILITARY ACTIVITY SPECIAL FLIGHTS VIP
T ATC SPECIAL EVENT
S ATC WEATHER
O ENVIRONMENTAL BENEFIT, DELAYED START-UP PUSHBACK DUE TO USE OF REDUCED STANDARD
TAXI TIMES
R ATC RESTRICTIONS DUE TO CURFEW
P ATC POLITICAL UNREST
N ATC ENVIRONMENTAL
M AIRPORT CLOSURE
L RUNWAY CLOSURE
K MISCELLANEOUS START-UP DELAY (LOCAL ATC)
J LOST FLIGHT PLAN BY ATC
I LATE PUSHBACK GIVEN DUE TO OTHER REASONS THAN INFRASTRUCTURE
H CONSTRUCTION WORK MAINTENENCE
G OTHER
93 (RA) AIRCRAFT ROTATION, late arrival of aircraft from another flight
Z LATE ARRIVAL DUE DEPARTURE DELAY AT PREVIOUS STATION
Y LATE ARRIVAL DUE ENROUTE DELAY
X LATE ARRIVAL DUE DELAY AFTER LANDING
W LATE ARRIVAL DUE TO HIGH DEMAND FOR DESTINATION STATION
V LATE ARRIVAL DUE TO WEATHER AT DESTINATION
U LATE ARRIVAL DUE TO TECHNICAL REASONS
Edition Validity Date: 11/06/2019 Edition: CDA_2019_001 Status: Released Issue 2722 Glossary of Terms and Abbreviations
ACC Area Control Centre
ADD Average Delay per Delayed Flight
AHM Airport Handling Manual
AIBT Actual In Block Time
AOBT Actual Off Block Time
ATFCM Air Traffic Flow and Capacity Management
ATFM Air Traffic Flow Management (used by IATA in the Standard IATA
Delay Codes)
ATS Air Traffic Services
BTO Block Time Overshoot
CODA Central Office for Delay Analysis
DDI-F Delay Difference Indicator – Flight
ECAC European Civil Aviation Conference
FIR Flight Information Region
IATA International Air Transport Association
ICAO International Civil Aviation Organization
IFR Instrument Flight Rules
NM Network Manager
NMOC Network Manager Operations Centre
PDF Percentage of Delayed Flights
STA Scheduled Time of Arrival
STD Scheduled Time of Departure
TDF Total Delayed Flights
TDM Total Delay in Minutes
TTF Total Flights
Edition Validity Date: 11/06/2019 Edition: CDA_2019_001 Status: Released Issue 2823 CODA Coverage of IFR Flights in Q1 2019
EUROCONTROL Member States and Partner Countries
Edition Validity Date: 11/06/2019 Edition: CDA_2019_001 Status: Released Issue 29DOCUMENT FINAL PAGE Edition Validity Date: 11/06/2019 Edition: CDA_2019_001 Status: Released Issue 30
EUROCONTROL

© EUROCONTROL - June 2019
This document is published by EUROCONTROL for information purposes. It may be copied
in whole or in part, provided that EUROCONTROL is mentioned as the source and it is not used for
commercial purposes (i.e. for financial gain). The information in this document may not be modified
without prior written permission from EUROCONTROL.

www.eurocontrol.int
You can also read