Learn-/Training Document - Industrial Automation
←
→
Page content transcription
If your browser does not render page correctly, please read the page content below
Learn-/Training Document | PA Module P03-01, Edition 02/2020 | Digital Industries, FA

                                                 Learn-/Training Document
                                                 Siemens Automation Cooperates with Education
                                                 (SCE) | As of Version V9 SP1

                                                 PA Module P03-01
                                                 SIMATIC PCS 7 – Advanced layout of UIs

                                                                                                   siemens.com/sce

For unrestricted use in educational / R&D institutions. © Siemens 2020. All rights reserved.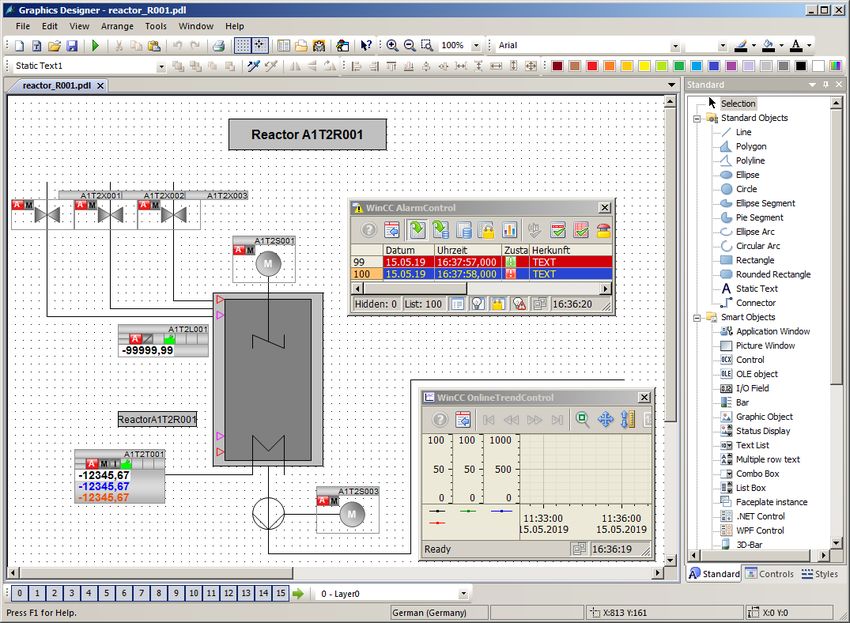
Learn-/Training Document | PA Module P03-01, Edition 02/2020 | Digital Industries, FA Matching SCE Trainer Packages for this Learn-/Training Document • SIMATIC PCS 7 Software Package V9.0 (set of 3) Order No.: 6ES7650-0XX58-0YS5 • SIMATIC PCS 7 Software Package V9.0 (set of 6) Order No.: 6ES7650-0XX58-2YS5 • SIMATIC PCS 7 Software Upgrade Packages (set of 3) Order No.: 6ES7650-0XX58-0YE5 (V8.x V9.0) • SIMIT Simulation Platform with Dongle V10 (contains SIMIT S & CTE, FLOWNET, CONTEC libraries) – 2500 simulation tags Order No.: 6DL8913-0AK00-0AS5 • Upgrade SIMIT Simulation Platform V10 (contains SIMIT S & CTE, FLOWNET, CONTEC libraries) from V8.x/V9.x Order No.: 6DL8913-0AK00-0AS6 • Demo Version SIMIT Simulation Platform V10 Download • SIMATIC PCS 7 AS RTX Box (PROFIBUS) only in combination with ET 200M for RTX – Order No.: 6ES7654-0UE23-0XS1 • ET 200M for RTX Box (PROFIBUS) only in combination with PCS 7 AS RTX Box – Order No.: 6ES7153-2BA10-4AB1 Note that these trainer packages are replaced with successor packages when necessary. An overview of the currently available SCE packages is available at: siemens.com/sce/tp Continued training For regional Siemens SCE continued training, get in touch with your regional SCE contact siemens.com/sce/contact Additional information regarding SCE siemens.com/sce Information regarding use The SCE Learn-/Training Document for the integrated automation solution Totally Integrated Automation (TIA) was prepared for the program "Siemens Automation Cooperates with Education (SCE)" specifically for training purposes for public educational facilities and R&D institutions. Siemens does not guarantee the contents. This document is to be used only for initial training on Siemens products/systems, which means it can be copied in whole or part and given to those being trained for use within the scope of their training. Circulation or copying this Learn-/Training Document and sharing its content is permitted within public training and advanced training facilities for training purposes. Exceptions require written consent from the Siemens. Send all related requests to scesupportfinder.i-ia@siemens.com. Offenders will be held liable. All rights including translation are reserved, particularly if a patent is granted or a utility model or design is registered. Use for industrial customer courses is explicitly not permitted. We do not consent to commercial use of the Learn-/Training Document. For unrestricted use in educational / R&D institutions. © Siemens 2020. All rights reserved. 2 p03-01-advanced-layout-of-uis-v9-tud-0719-en.docx
Learn-/Training Document | PA Module P03-01, Edition 02/2020 | Digital Industries, FA

We wish to thank the TU Dresden, particularly Prof. Dr.-Ing. Leon Urbas and the Michael Dziallas
Engineering Corporation and all other involved persons for their support during the preparation of this
Learn-/Training Document.

For unrestricted use in educational / R&D institutions. © Siemens 2020. All rights reserved.                           3
p03-01-advanced-layout-of-uis-v9-tud-0719-en.docx
Learn-/Training Document | PA Module P03-01, Edition 02/2020 | Digital Industries, FA

Table of contents
1     Goal ................................................................................................................................................. 5

2     Prerequisite...................................................................................................................................... 5

3     Required hardware and software ...................................................................................................... 6

4     Theory ............................................................................................................................................. 7

    4.1     Theory in brief ............................................................................................................................7

    4.2     Hierarchy of flow diagrams .........................................................................................................8

    4.3     Trends .......................................................................................................................................9

    4.4     ActiveX controls ....................................................................................................................... 13

    4.5     User-defined objects ................................................................................................................ 16

    4.6     References .............................................................................................................................. 16

5     Task ............................................................................................................................................... 17

6     Planning......................................................................................................................................... 17

7     Learning objective .......................................................................................................................... 17

8     Structured step-by-step instructions................................................................................................ 18

    8.1     Creating a faceplate for Reactor R001 ..................................................................................... 18

    8.2     Editing the faceplate for Reactor R001 ..................................................................................... 26

    8.3     WinCC AlarmControl ................................................................................................................ 34

    8.4     WinCC OnlineTrendControl ...................................................................................................... 39

    8.5     Creating a user-defined object ................................................................................................. 49

    8.6     Using a user-defined object ...................................................................................................... 58

    8.7     Checklist – step-by-step instruction .......................................................................................... 62

9     Exercises ....................................................................................................................................... 63

    9.1     Tasks ....................................................................................................................................... 63

    9.2     Checklist – exercise ................................................................................................................. 65

10    Additional information ..................................................................................................................... 66

For unrestricted use in educational / R&D institutions. © Siemens 2020. All rights reserved.                                                                     4
p03-01-advanced-layout-of-uis-v9-tud-0719-en.docx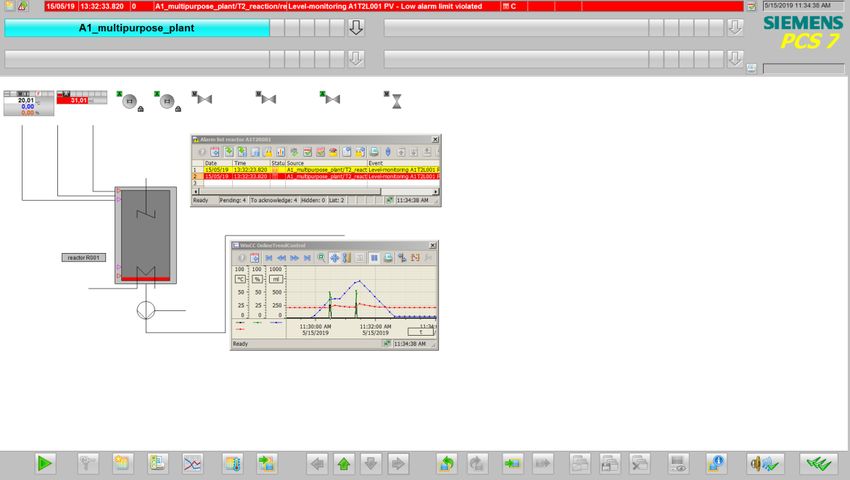
Learn-/Training Document | PA Module P03-01, Edition 02/2020 | Digital Industries, FA

Advanced layout of UIs
1          Goal
           After working through this module, the students have advanced knowledge regarding the design
           of the user interface of an operator station. They are able to make additional information available
           on the detail level. In doing so, they use adapted message lists and trend curves. The students
           can combine created composites into a user-defined object and redesign existing objects as
           user-defined objects. These objects can then be made available for reuse.

2          Prerequisite
           This chapter builds on chapter 'Functional safety'. To implement this chapter, you can use an
           existing project from the previous chapter or the archived project 'p02-03-exercise-r1905-en.zip'
           provided by SCE. The download of the project(s) is stored on the SCE Internet for the respective
           module.

           The (optional) simulation for the SIMIT program can be retrieved from the file 'p01-04-plantsim-
           v10-r1905-en.simarc'. It can be run in demo mode.

For unrestricted use in educational / R&D institutions. © Siemens 2020. All rights reserved.                           5
p03-01-advanced-layout-of-uis-v9-tud-0719-en.docx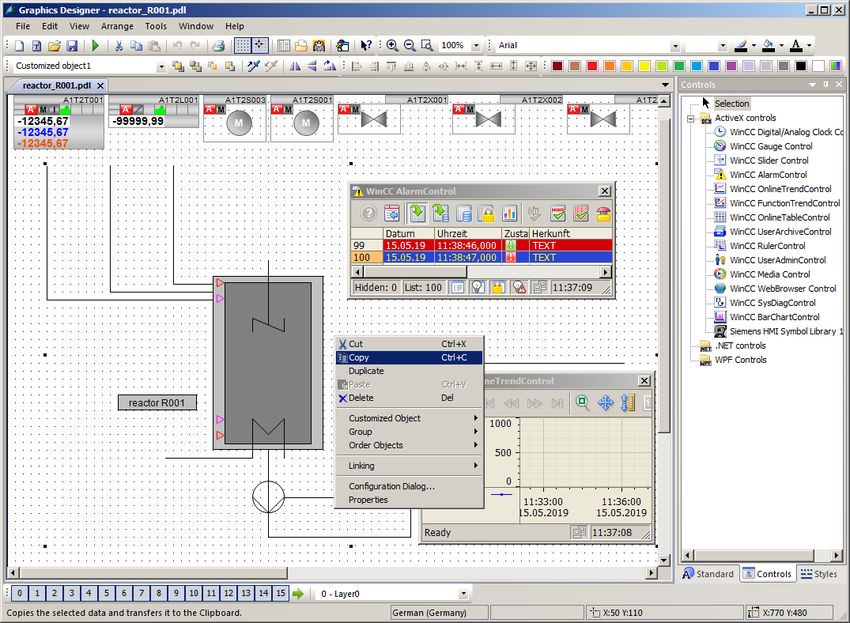
Learn-/Training Document | PA Module P03-01, Edition 02/2020 | Digital Industries, FA
3 Required hardware and software
1 Engineering station: Requirements include hardware and operating system
(for further information, see Readme on the PCS 7 installation DVD)
2 SIMATIC PCS 7 software V9 SP1 or higher
Installed program packages (contained in SIMATIC PCS 7 Software Trainer
Package):
Engineering PCS 7 Engineering
Engineering BATCH Engineering
Runtime Single Station OS Single Station
Runtime Single Station BATCH Single Station
Options SIMATIC Logon
Options S7-PLCSIM V5.4 SP8
3 Demo Version SIMIT Simulation Platform V10
2 SIMATIC PCS 7
V9 SP1 or higher
1 Engineering Station
3 SIMIT V10 or higher
For unrestricted use in educational / R&D institutions. © Siemens 2020. All rights reserved. 6
p03-01-advanced-layout-of-uis-v9-tud-0719-en.docx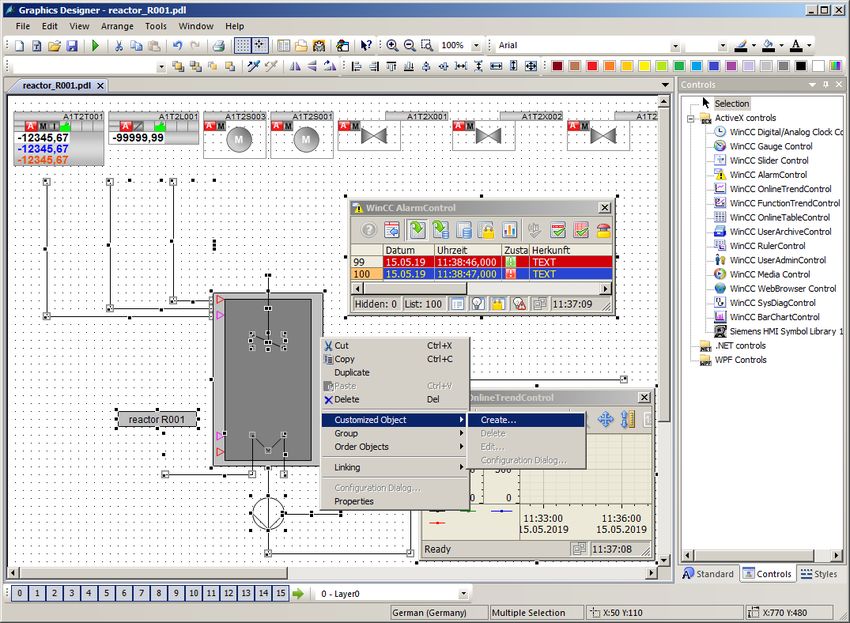
Learn-/Training Document | PA Module P03-01, Edition 02/2020 | Digital Industries, FA

4          Theory
4.1        Theory in brief
           In this chapter, some aspects of OS engineering are considered in greater depth. While in
           chapter P02-01 automatic generation of process pictures was primarily discussed, now
           supplementary techniques for designing process control are described.

           The flow diagrams (see P02-01) are usually structured in the following hierarchical levels:

           –    Plant picture

           –    Area picture

           –    Unit picture/group picture

           –    Detail picture

           This structuring can result from the plant hierarchy. While the upper levels aim for a good
           overview of the entire plant or corresponding areas, the unit picture and detail picture are to
           provide considerably more information about the area under consideration to allow appropriate
           setting of parameters for the given situation and diagnostics of faults.

           In addition to detailed information about the current state of the areas under consideration, the
           representation of process values in trends is particularly helpful for analyzing deviations. Trends
           show the time variation of a process value. With one glance, the operator can immediately read
           off the following information:

           –    Times at which step changes of the process value occur.

           –    Process values at the time of such step changes

           –    Gradients at certain points in time

           –    Dependencies between process values when displayed simultaneously

           –    Extreme values (when and how large)

           –    Fluctuation ranges

           –    Deviations from the setpoint

           –    Frequencies

           Trend displays provide the operator with an expanded basis for decisions regarding control
           action. If a process value is outside the permissible range, the user can retrieve the trend of the
           process value in the recent past and see whether the value is getting worse or has already
           improved.

For unrestricted use in educational / R&D institutions. © Siemens 2020. All rights reserved.                           7
p03-01-advanced-layout-of-uis-v9-tud-0719-en.docx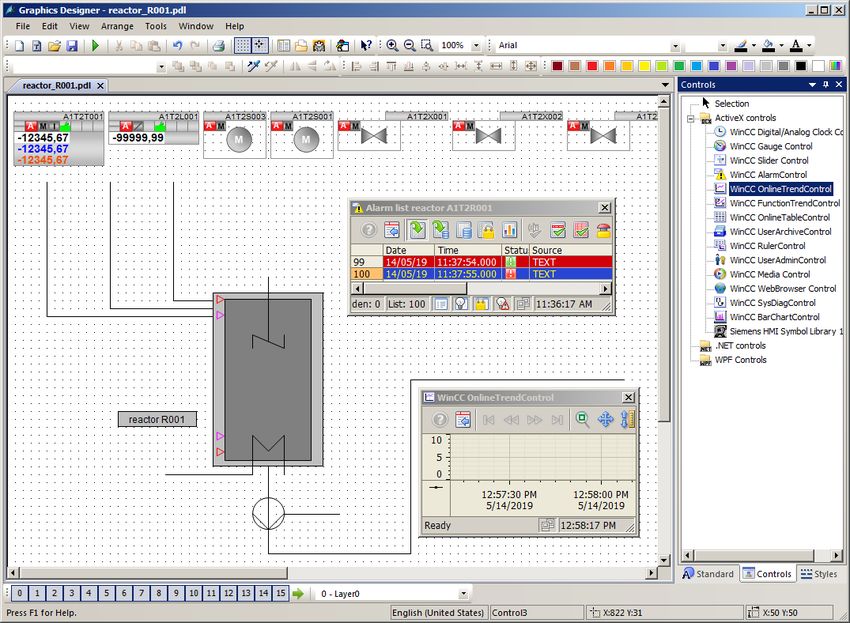
Learn-/Training Document | PA Module P03-01, Edition 02/2020 | Digital Industries, FA

4.2        Hierarchy of flow diagrams
           In chapter P02-01 the objectives of process control as well as of basic design concepts and
           techniques for OCM interfaces (operator control and monitoring interfaces) were described.

           Chapter P01-03 introduced the physical model of a plant consisting of a plant, unit, equipment
           module and control module. Similarly, a hierarchy of flow diagrams is available in process
           visualization that is structured as follows, according to [1]:

           –     Plant picture

           –     Area picture

           –     Unit picture/group picture

           –     Detail picture

           The hierarchy of the flow diagrams facilitates orientation and specific picture selection. The
           uppermost plant picture and area picture levels provide an overview and are usually represented
           only schematically. In small plants, the plant picture corresponds to the area picture (refer to
           Figure 1). The direct selection of each area must be possible in the plant picture. In the area
           picture, the units are represented in a manner that their state can be recognized and the unit can
           be selected and controlled. The unit or group picture represents functional relationships, and
           typical equipment groups, final controlling elements and controllers can be operated. Detail
           pictures are of great importance to parameter assignment, commissioning and troubleshooting in
           the event of plant malfunctions. In detail pictures, individual items of equipment and groups of
           equipment are represented, and their functional relationship can be visualized using action lines.
           This is particularly well-suited for tracking the signal flows of a control loop [1].

                                                                                                        Plant and area
                                              Multi purpose plant
                                                                                                            display

                                                                                                        Plant section
                        Educt tanks                 Reaction         Product tanks         Rinsing
                                                                                                           display

                                               Reactor   Reactor
               Tank 1     Tank 2     Tank 3                          Tank 1    Tank 2          Tank 1   Detail display
                                                  1         2

           Figure 1: Hierarchy of flow diagrams

For unrestricted use in educational / R&D institutions. © Siemens 2020. All rights reserved.                               8
p03-01-advanced-layout-of-uis-v9-tud-0719-en.docx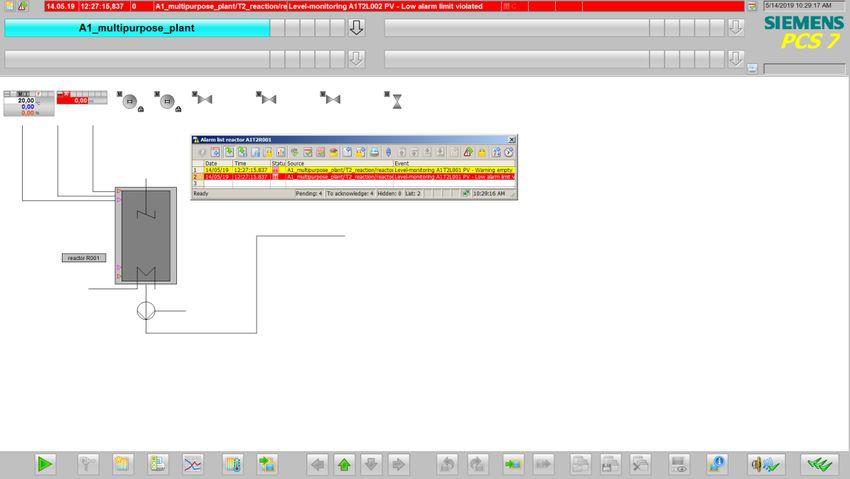
Learn-/Training Document | PA Module P03-01, Edition 02/2020 | Digital Industries, FA

4.3        Trends
           Trends are used for process control during intended operation or for diagnosing faults [2]. They
           supplement the displays with flow diagrams and particularly with the option of displaying the
           variation of process values over time.

           Related displays are displays of a process value as a function of displacement, other process
           tags, and even multiple reference values. These are not described here, however.

           Purpose of trends

           Trends are displayed to show the trend of something. By selecting different time horizons,
           different tasks can be implemented. There are three variants with respect to the time the operator
           has the trend displayed.

           First, the operator can have a trend display the past without the present. Such a trend is called a
           history and is used for analysis. This can be a fault analysis but also an analysis for optimization
           of process control.

           The operator can also call up a trend of the present and recent past. This type of trend is called a
           recent history. It can be used to display a trend. It is the most frequently used type of display for
           process control. From the recent history trend, operators can read qualitative values such as
           rising, falling, or steady. They can also read quantitative values such as the process value at a
           certain time or the difference from a setpoint.

           The third variant is the display of the recent past, the present and the future, which is called
           prediction display (refer to Figure 2). It is used to predict a process value and allows the user to
           intervene before an event occurs. To represent the future, the possible value trend has to be
           calculated in advance.

           Figure 2: Prediction display according to [2]

For unrestricted use in educational / R&D institutions. © Siemens 2020. All rights reserved.                           9
p03-01-advanced-layout-of-uis-v9-tud-0719-en.docx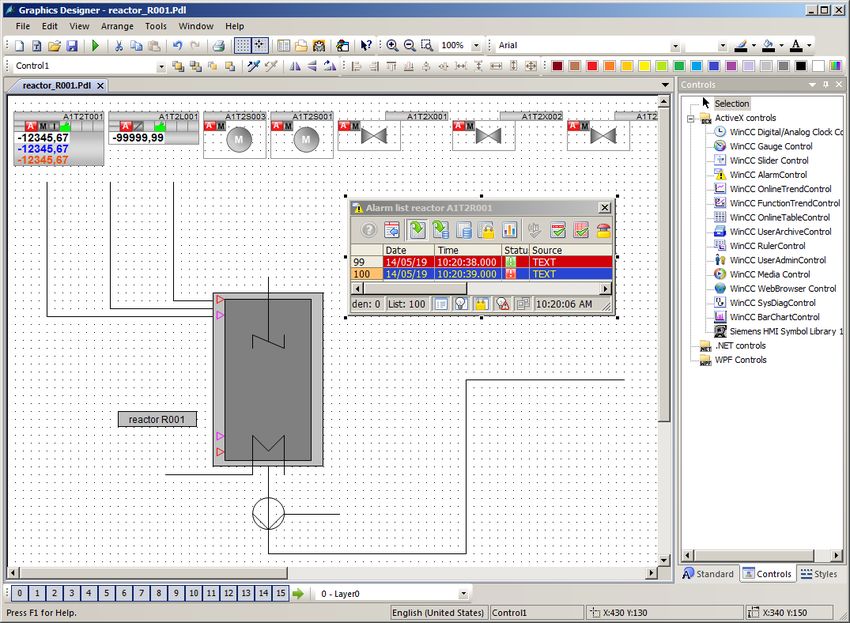
Learn-/Training Document | PA Module P03-01, Edition 02/2020 | Digital Industries, FA

           In general, the following values can be determined through trends:

           –    Times at which step changes of the process value occur.

           –    Process values at the time of such step changes

           –    Gradients at certain points in time

           –    Dependencies between process values when displayed simultaneously

           –    Extreme values (when and how large)

           –    Fluctuation ranges

           –    Deviations from the setpoint

           –    Frequencies

           The many values that can be read off shows the importance of the trend display. While the
           current process values and any extreme values can be represented otherwise, e.g. with analog
           or digital displays, the display of the other characteristics in such a compressed and immediately
           understandable form is difficult to conceive [3].

           Acquisition and storage of trend values

           Because plants produce large volumes of data, usually, only a certain amount can be archived
           over a certain period. The amount of data depends largely on the cost of the storage medium and
           on the data transmission rate. On the other hand, the acceptable level of data loss has to be
           considered. The degree of compression results from weighing these two criteria.

           When data is compressed, not only the quantity of the stored data changes but also its statistics,
           e.g. mean value and variance. For that reason, such values should be calculated from the
           original data and if needed, archived also. This should be done time-controlled, similarly to the
           archived process data.

           Direct and transformation methods can be used for the data compression.

           When the direct method is used, the data is archived in real time. There are rules that govern the
           archiving of individual measured values. The data is reconstructed by connecting the individual
           data points.

           When transformation methods are used, the data is not archived in real time because the
           previous data history is included in the transformation. The original data is transformed in a
           different range. With this method, there is the possibility to design the compression adaptively,
           since the algorithms often have a parameter that is critical for the quality of the compression,
           depending on the process.

For unrestricted use in educational / R&D institutions. © Siemens 2020. All rights reserved.                           10
p03-01-advanced-layout-of-uis-v9-tud-0719-en.docx
Learn-/Training Document | PA Module P03-01, Edition 02/2020 | Digital Industries, FA
Recent history History
Position of the time span Always relative to the present Through an absolute time
shown in the trend display and a selected time span or
field through two absolute times
Labeling of the time axis Relative time indications; if Absolute time indications, can
needed, can be switched to be switched to relative time
absolute time indications indications that are relative to
a defined time of an event
Updating Trend is updated during the Trend does not change
display whereby all trend
points are shifted
Value axis The value axis is usually The value axis is located on
located at the point in time of the left edge of the picture
the present (on the right edge
of the picture)
Table 1: Visible differences between recent history and history according to [2]
Design of trend pictures
In [2], guidelines for designing trend displays are provided. PCS 7 implements the basic design
details by default; for that reason, they are described here only briefly. There are design rules,
however, that you can implement yourself using the settings in the OS engineering. To do this in
a specific way, a few details are introduced here.
The trend picture is displayed in the working area of the display area (refer to P02-01). It consists
of the title field, the trend labeling field, and the trend display field. The title field should contain
information for unambiguous assignment to the process environment. In the trend labeling field, it
should be possible to read off the relationship between the displayed trend and the process
value. The trend display field is used to display the trend and should be as large as possible. To
implement the trend display field, the following information is provided.
To facilitate reading off the values, grid lines must be available. The value axis should display
several lines as an extension of the scale marks, and the time axis several lines according to the
current time grid. The number of grid lines should be low and remain in the background visually.
To this end, they should not be shown in color or blue. Reading rulers can provide additional
support.
For unrestricted use in educational / R&D institutions. © Siemens 2020. All rights reserved. 11
p03-01-advanced-layout-of-uis-v9-tud-0719-en.docxLearn-/Training Document | PA Module P03-01, Edition 02/2020 | Digital Industries, FA
The trends should be displayed colored as continuous lines or as a series of dots. Color coding
can be selected as required. The number of trends for each trend display field should be limited
to six. The colors of the trends should be easily distinguishable from each other.
To implement the trend line, the following directions are recommended:
– From right to left: more recent values to the right, older values to the left
– From top to bottom: more recent values on top, older values on the bottom
The deciding factor in this case is whether a display time span that is as large as possible (from
left to right) or a value resolution that is as high as possible (from top to bottom) is needed.
When trends with a recent history are displayed, the trend line is updated. The entire trend is
shifted in the direction of the past (see Figure 2). If there is a shift with each new entry, the entire
trend display field can be used to display the recent history, and the operator can easily follow the
display since the trend is shifted only a little each time. If needed, it should be possible to stop the
updating.
For labeling the value axis, a scale division of 1, 2 and 5 as well as multiples of ten of these
should be used. The value axis can be scaled in units or in percent. The location of the value axis
can be found in Fehler! Verweisquelle konnte nicht gefunden werden.. Also, a display with
two value axes can be useful; in this case, the percent axis for all curves is displayed to the left,
and the display of the values of a curve in units to the right. The time axis should always be
labeled as shown in Table 1.
To display time spans, [2] offers the time spans and scale marks recommended in Fehler!
Verweisquelle konnte nicht gefunden werden.. This ensures that if there is a change to
another display time span, the same point in time can be located again.
For unrestricted use in educational / R&D institutions. © Siemens 2020. All rights reserved. 12
p03-01-advanced-layout-of-uis-v9-tud-0719-en.docxLearn-/Training Document | PA Module P03-01, Edition 02/2020 | Digital Industries, FA
Primary task Preassigned display Update cycle (only for Scale division
time spans recent history)
Commissioning 5 min 1s 1 min
Process control 15 min 1s 5 min
or analysis
30 min 2s 5 min
2h 8s 30 min
8h 32 s 1h
24 h 96 s 4h
4 days 384 s 12 h
Analysis 7 days 1 day
30 days 7 days
90 days 15 days
360 days 90 days
Table 2: Recommended display time spans [2]
4.4 ActiveX controls
Trends are configured in the OS engineering of PCS 7 either by creating trend groups (chapter
P02-03) or by using configurable ActiveX controls. PCS 7 provides ActiveX controls for alarms,
trends and tables. Trends can be used to display time variations (Online Trend Control) and to
display dependencies between process values (Function Trend Control). In the Online Trend
Control, two different sources exist for displaying a trend. The first source is the process value
that is buffered while the ActiveX control is active. With this source, the trend can be displayed
during monitoring. Here it is important that when the ActiveX control is closed, the values can no
longer be retrieved. If the second source is used, the data is taken from the archive (refer to P02-
03). The process values retrieved from there can be displayed again and again. Depending on
the time span selected, past data (history) can be retrieved as well as the most recent data
(recent history).
For unrestricted use in educational / R&D institutions. © Siemens 2020. All rights reserved. 13
p03-01-advanced-layout-of-uis-v9-tud-0719-en.docxLearn-/Training Document | PA Module P03-01, Edition 02/2020 | Digital Industries, FA
These values can be retrieved again as long as they are in the circular log. The size of the
circular log depends on the configuration as described in chapter P02-03.
Additional ActiveX controls are the display of process values in tables (Online Table Control) and
alarms in alarm lists (Alarm Control). Alarm Control receives always receives its data from the
archive while the table, similar to the Online Trend Control, has different sources.
ActiveX controls are quite suitable for designing detail pictures, since they provide additional
information specifically for a detail area. Specific process values for the corresponding detail
picture or filters for alarm lists can be selected and pre-configured for this, e.g. using the source
attribute.
Detail display of Reactor R001
M
Message list filtered by Reactor R001
T L
Curve display with process values for Reactor R001
- temperature
- level
- manipulated value of the controller
- ...
PID-Regler
M
Working area
Figure 3: Sketch of a detail picture sketches a possibility for designing the detail picture.
For unrestricted use in educational / R&D institutions. © Siemens 2020. All rights reserved. 14
p03-01-advanced-layout-of-uis-v9-tud-0719-en.docxLearn-/Training Document | PA Module P03-01, Edition 02/2020 | Digital Industries, FA
Detail display of Reactor R001
M
Message list filtered by Reactor R001
T L
Curve display with process values for Reactor R001
- temperature
- level
- manipulated value of the controller
- ...
PID-Regler
M
Working area
Figure 3: Sketch of a detail picture
For unrestricted use in educational / R&D institutions. © Siemens 2020. All rights reserved. 15
p03-01-advanced-layout-of-uis-v9-tud-0719-en.docxLearn-/Training Document | PA Module P03-01, Edition 02/2020 | Digital Industries, FA
4.5 User-defined objects
A user-defined object (UDO for short) is a dynamizable object that consists of individual objects.
In OS Engineering, you identify the variable properties and select them for the user-defined
object. Thus, only the most important properties of all individual objects are visible and provide a
good overview of the properties. In addition, it is possible to specify some properties as invariable
for all instances. At the same time, the need to connect every individual object for every instance
is eliminated.
Offsetting this is the increased effort for careful selection of the properties; however, the effort
quickly pays off after multiple reuse. User-defined objects that are to be used multiple times are
stored in the library.
Also, the ability to make modifications is facilitated since, for example, a block name or a CFC
name only has to be changed at the user-defined object and not at all individual objects.
The individual instances can be changed or supplemented with additional objects at any time. If
C actions are used for dynamization, this is done in the case of user-defined objects in a script,
and not in many individual objects. This increases the performance of the visualization.
4.6 References
[1] VDI/VDE 3699, sheet 3 (Ed. 2014-01): Prozessführung mit Bildschirmen – Fließbilder
(Process control using display screens – Mimics).
[2] VDI/VDE 3699, sheet 4 (Ed. 2014-01): Prozessführung mit Bildschirmen – Kurven
(Process control using display screens – Curves).
[3] Kindsmüller, M. C.: Trend-Literacy, Shaker Verlag 2006.
[4] SIEMENS (2017-10): SIMATIC Process Control System PCS 7 Operator Station (V9.0
SP1). A5E39219186-AB. (support.automation.siemens.com/WW/view/en/109754982)
For unrestricted use in educational / R&D institutions. © Siemens 2020. All rights reserved. 16
p03-01-advanced-layout-of-uis-v9-tud-0719-en.docxLearn-/Training Document | PA Module P03-01, Edition 02/2020 | Digital Industries, FA
5 Task
In this task, you will add an additional level to your picture structure in order to show more details
for the individual tanks and reactors.
In the example, you will create a detail view in the picture for Reactor R001 with a bar display for
the reactor level, an Online Trend Display and an alarm window for displaying the alarms
associated with Reactor R001.
You will then convert the detail view with the bar display to a user-defined object for better
reusability (for example, for Reactor 002).
6 Planning
Because a third level for faceplates is to be added, it is necessary to add Level 3 to the levels
included in the HID. The block icons can then be automatically generated again by PCS 7.
The 'Bar' smart object is suitable for the visual representation of the level.
For the further representation of local information, the ActiveX controls 'WinCC AlarmControl' and
'WinCC OnlineTrendControl' are to be used.
The creation and reuse of user-defined objects (configurable library objects) will also be shown.
7 Learning objective
In this chapter, students learn the following:
– Creation of an ActiveX control for displaying alarms
– Filtering of alarms matching the hierarchy
– Insertion and parameter assignment for display of archive tags
– Creation of a user-defined object from a group of objects
– Parameter assignment and use of user-defined objects
For unrestricted use in educational / R&D institutions. © Siemens 2020. All rights reserved. 17
p03-01-advanced-layout-of-uis-v9-tud-0719-en.docxLearn-/Training Document | PA Module P03-01, Edition 02/2020 | Digital Industries, FA
8 Structured step-by-step instructions
8.1 Creating a faceplate for Reactor R001
1. First, insert a picture in the 'reactor R001' folder and name it 'reactor R001'. ( reactor R001
Insert New Object Picture reactor_R001)
For unrestricted use in educational / R&D institutions. © Siemens 2020. All rights reserved. 18
p03-01-advanced-layout-of-uis-v9-tud-0719-en.docxLearn-/Training Document | PA Module P03-01, Edition 02/2020 | Digital Industries, FA
2. Then, adapt the settings of the plant hierarchy to the expansion. ( Options Plant
Hierarchy Settings)
For unrestricted use in educational / R&D institutions. © Siemens 2020. All rights reserved. 19
p03-01-advanced-layout-of-uis-v9-tud-0719-en.docxLearn-/Training Document | PA Module P03-01, Edition 02/2020 | Digital Industries, FA
3. The number of hierarchy levels is retained. However, for the third level the 'Included in HID'
check box must be selected; otherwise, there may be problems during simulation. (
Included in HID OK Yes)
For unrestricted use in educational / R&D institutions. © Siemens 2020. All rights reserved. 20
p03-01-advanced-layout-of-uis-v9-tud-0719-en.docxLearn-/Training Document | PA Module P03-01, Edition 02/2020 | Digital Industries, FA
4. Then, the block icons must be generated in the new picture. ( reactor R001 Plant
Hierarchy Create/Update Block Icons)
For unrestricted use in educational / R&D institutions. © Siemens 2020. All rights reserved. 21
p03-01-advanced-layout-of-uis-v9-tud-0719-en.docxLearn-/Training Document | PA Module P03-01, Edition 02/2020 | Digital Industries, FA
5. Have the object name created from the chart names and include, as previously, a lower level
hierarchy level. ( Object name: Chart Lower hierarchy levels included: 1 OK)
6. Now, read the note regarding the need to compile the OS. The log can also be displayed.
Click 'Yes' to confirm the dialog. ( Yes )
For unrestricted use in educational / R&D institutions. © Siemens 2020. All rights reserved. 22
p03-01-advanced-layout-of-uis-v9-tud-0719-en.docxLearn-/Training Document | PA Module P03-01, Edition 02/2020 | Digital Industries, FA For unrestricted use in educational / R&D institutions. © Siemens 2020. All rights reserved. 23 p03-01-advanced-layout-of-uis-v9-tud-0719-en.docx
Learn-/Training Document | PA Module P03-01, Edition 02/2020 | Digital Industries, FA
7. Back in the plant view, start the compilation and download of the objects of the project. (
SCE_PCS7_Prj PLC Compile and Download Objects)
For unrestricted use in educational / R&D institutions. © Siemens 2020. All rights reserved. 24
p03-01-advanced-layout-of-uis-v9-tud-0719-en.docxLearn-/Training Document | PA Module P03-01, Edition 02/2020 | Digital Industries, FA
8. Prior to starting the compilation, make sure that S7-PLCSIM is started and the CPU is in the
'STOP' mode. For the charts, compile and download everything. For the OS, compile the
entire OS (memory reset is not necessary). ( Start Close)
For unrestricted use in educational / R&D institutions. © Siemens 2020. All rights reserved. 25
p03-01-advanced-layout-of-uis-v9-tud-0719-en.docxLearn-/Training Document | PA Module P03-01, Edition 02/2020 | Digital Industries, FA
8.2 Editing the faceplate for Reactor R001
1. Now, start WinCC by selecting and opening 'OS(1)' in the 'Component view'. ( OS(1)
Open Object)
For unrestricted use in educational / R&D institutions. © Siemens 2020. All rights reserved. 26
p03-01-advanced-layout-of-uis-v9-tud-0719-en.docxLearn-/Training Document | PA Module P03-01, Edition 02/2020 | Digital Industries, FA
2. In the 'Graphics Designer' folder, open the picture 'reactor_R001.Pdl'. ( Graphics Designer
reactor_R001.Pdl)
3. In the Object Properties, first change the geometry corresponding to your resolution (for
example, 1920x847 for 1920x1080) and the background colors to 'white'. For the color
setting to be applied, the 'Static' setting in the global color scheme must be changed to 'No'. (
Object Properties Colors Background Color white Effects Global Color
Scheme No)
For unrestricted use in educational / R&D institutions. © Siemens 2020. All rights reserved. 27
p03-01-advanced-layout-of-uis-v9-tud-0719-en.docxLearn-/Training Document | PA Module P03-01, Edition 02/2020 | Digital Industries, FA
4. From the project library, drag the faceplate for reactor R001 into the picture. ( View
Toolbars Symbol library Project Library reactor_V1_0)
For unrestricted use in educational / R&D institutions. © Siemens 2020. All rights reserved. 28
p03-01-advanced-layout-of-uis-v9-tud-0719-en.docxLearn-/Training Document | PA Module P03-01, Edition 02/2020 | Digital Industries, FA
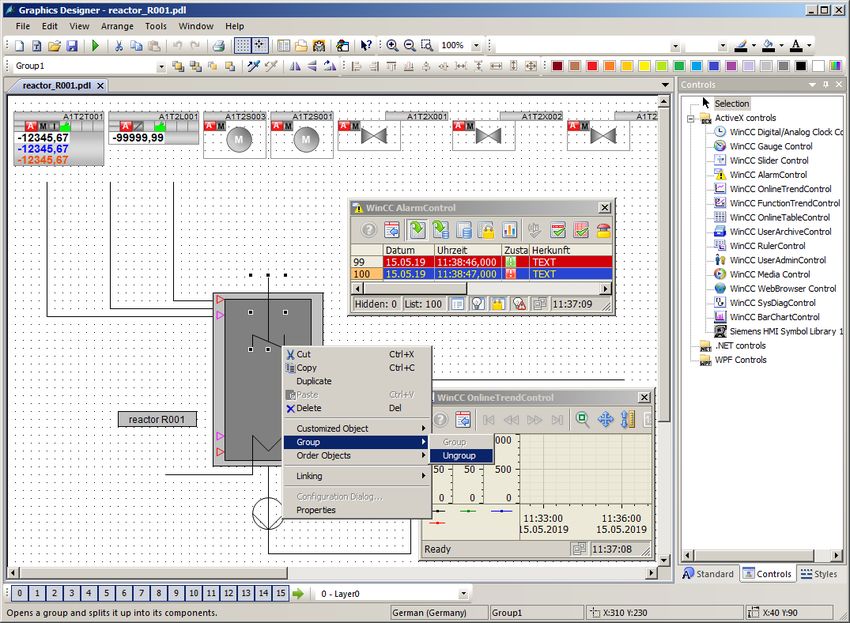
5. In 'reactor_R001.Pdl' picture, ungroup the group with the reactor in the center.
( Group Ungroup)
For unrestricted use in educational / R&D institutions. © Siemens 2020. All rights reserved. 29
p03-01-advanced-layout-of-uis-v9-tud-0719-en.docxLearn-/Training Document | PA Module P03-01, Edition 02/2020 | Digital Industries, FA
6. Next, select the Smart objects in the object palette, and select 'Bar' here. Then drag the bar
over the reactor tank. ( Standard palette Smart Objects Bar)
For unrestricted use in educational / R&D institutions. © Siemens 2020. All rights reserved. 30
p03-01-advanced-layout-of-uis-v9-tud-0719-en.docxLearn-/Training Document | PA Module P03-01, Edition 02/2020 | Digital Industries, FA
7. In the configuration dialog that appears, open the tag selection, select ES Variables as the
data source and open the hierarchy 'A1_multipurpose_plant/T2_reaction/reactor R001/
A1T2L001/A1T2L001/monitor…'. On the right side, select the tag 'PV_Out#Value'.
( Tag ES Variables A1_multipurpose_plant/T2_reaction/reactor R001/
A1T2L001/Mon_A1T2L001/PV_OUT#Value OK)
For unrestricted use in educational / R&D institutions. © Siemens 2020. All rights reserved. 31
p03-01-advanced-layout-of-uis-v9-tud-0719-en.docxLearn-/Training Document | PA Module P03-01, Edition 02/2020 | Digital Industries, FA
8. Next, select the update, the maximum value and the minimum value.
( Update: Upon change Max. Value: 1000 Minimum value: 0 OK)
9. Now place the display on top of the reactor and move it down a few layers (Arrange Order
Objects Send backward ). This makes the stirrer, heater and labeling visible again.
Then, open the properties for additional adaptations. ( Properties)
For unrestricted use in educational / R&D institutions. © Siemens 2020. All rights reserved. 32
p03-01-advanced-layout-of-uis-v9-tud-0719-en.docxLearn-/Training Document | PA Module P03-01, Edition 02/2020 | Digital Industries, FA
10. In the 'Properties', change the 'Tooltip Text' to 'A1T2L001' in 'Miscellaneous'.
( Properties Miscellaneous Tooltip Text A1T2L001)
11. Then, select 'Axis'. Here, set the 'Scale' attribute to 'No'.
12. In 'Limits', specify the known low and high limits, their monitoring and the color of the bars if
the limit is exceeded. ( Properties Bar Limits Low/High limit: see figure/ Monitoring:
Yes Close)
For unrestricted use in educational / R&D institutions. © Siemens 2020. All rights reserved. 33
p03-01-advanced-layout-of-uis-v9-tud-0719-en.docxLearn-/Training Document | PA Module P03-01, Edition 02/2020 | Digital Industries, FA
8.3 WinCC AlarmControl
1. In the 'Controls' tab of the object palette, select the WinCC AlarmControl. Then draw a
rectangle with the mouse. ( Object palette Controls WinCC AlarmControl)
For unrestricted use in educational / R&D institutions. © Siemens 2020. All rights reserved. 34
p03-01-advanced-layout-of-uis-v9-tud-0719-en.docxLearn-/Training Document | PA Module P03-01, Edition 02/2020 | Digital Industries, FA
2. In the properties dialog that is displayed automatically, change the text for the window title to
'Alarm list reactor A1T2R001'. ( General Text: Alarm list reactor A1T2R001)
For unrestricted use in educational / R&D institutions. © Siemens 2020. All rights reserved. 35
p03-01-advanced-layout-of-uis-v9-tud-0719-en.docxLearn-/Training Document | PA Module P03-01, Edition 02/2020 | Digital Industries, FA
3. In the 'Message lists' tab, select the 'Message blocks' as shown here. Make the selection by
adding message blocks with the buttons and removing message blocks with
the buttons. To ensure that only the alarms that match the picture are
displayed, select 'Fixed selection'. ( Message lists
Selected message blocks: as shown Fixed selection: Edit)
For unrestricted use in educational / R&D institutions. © Siemens 2020. All rights reserved. 36
p03-01-advanced-layout-of-uis-v9-tud-0719-en.docxLearn-/Training Document | PA Module P03-01, Edition 02/2020 | Digital Industries, FA
4. In the next screen, select 'Source' for 'Criterion', 'contains' for 'Operand' and the text 'R001'
for 'Setting' as shown. ( Criterion: Source Operand: contains Setting: R001 OK)
5. Under 'Online Configuration', select that the setting changes are not to be retained during
runtime. ( Online configuration Online configuration: Do not retain OK)
For unrestricted use in educational / R&D institutions. © Siemens 2020. All rights reserved. 37
p03-01-advanced-layout-of-uis-v9-tud-0719-en.docxLearn-/Training Document | PA Module P03-01, Edition 02/2020 | Digital Industries, FA
6. In runtime of the PCS7 project, you then see the alarms in picture 'reactor_R001'. You can
change the configuration with the button. However, this will be lost after a picture
change.
For unrestricted use in educational / R&D institutions. © Siemens 2020. All rights reserved. 38
p03-01-advanced-layout-of-uis-v9-tud-0719-en.docxLearn-/Training Document | PA Module P03-01, Edition 02/2020 | Digital Industries, FA
8.4 WinCC OnlineTrendControl
1. Next, select the WinCC OnlineTrendControl in the 'Control' tab of the object palette. Draw a
rectangle with the mouse to position the window for the trend view. ( Object palette
Controls WinCC OnlineTrendControl)
For unrestricted use in educational / R&D institutions. © Siemens 2020. All rights reserved. 39
p03-01-advanced-layout-of-uis-v9-tud-0719-en.docxLearn-/Training Document | PA Module P03-01, Edition 02/2020 | Digital Industries, FA
2. In the configuration dialog that is displayed automatically, first go to the 'Trends' tab and
change the object name of 'Trend 1' to 'PID – Setpoint'. ( Trends Object name 'PID –
Setpoint')
For unrestricted use in educational / R&D institutions. © Siemens 2020. All rights reserved. 40
p03-01-advanced-layout-of-uis-v9-tud-0719-en.docxLearn-/Training Document | PA Module P03-01, Edition 02/2020 | Digital Industries, FA
3. Next, link the trend to an archive tag by clicking on the button and then selecting the
setpoint SP#Value of A1T2T001. ( Tag name SystemArchive
…/control_A1T2T001.SP#Value)
For unrestricted use in educational / R&D institutions. © Siemens 2020. All rights reserved. 41
p03-01-advanced-layout-of-uis-v9-tud-0719-en.docxLearn-/Training Document | PA Module P03-01, Edition 02/2020 | Digital Industries, FA
4. Now add another trend and apply the settings shown. ( Trends New Object name:
'PID – Actual value' Name: PV Tag name: control_A1T2T001.PV#Value Limit Values
High limit value: 60 Apply)
For unrestricted use in educational / R&D institutions. © Siemens 2020. All rights reserved. 42
p03-01-advanced-layout-of-uis-v9-tud-0719-en.docxLearn-/Training Document | PA Module P03-01, Edition 02/2020 | Digital Industries, FA
5. The next trend is the manipulated variable and has the following settings.
( Trends New Object name: 'PID – Output value' Name: MV Tag name:
control.MV#Value Trend color: Green OK Apply)
For unrestricted use in educational / R&D institutions. © Siemens 2020. All rights reserved. 43
p03-01-advanced-layout-of-uis-v9-tud-0719-en.docxLearn-/Training Document | PA Module P03-01, Edition 02/2020 | Digital Industries, FA
6. The last trend you add is Level A1T2L001. ( New Object name: Level Tag name:
A1T2L001.PV#Value Trend color: Blue OK Apply)
For unrestricted use in educational / R&D institutions. © Siemens 2020. All rights reserved. 44
p03-01-advanced-layout-of-uis-v9-tud-0719-en.docxLearn-/Training Document | PA Module P03-01, Edition 02/2020 | Digital Industries, FA
7. Now change to the Time Axes tab. There, change the parameters shown ( Time Axes
Object name: Time axis Label: t Time range: 5 x 1 minute)
For unrestricted use in educational / R&D institutions. © Siemens 2020. All rights reserved. 45
p03-01-advanced-layout-of-uis-v9-tud-0719-en.docxLearn-/Training Document | PA Module P03-01, Edition 02/2020 | Digital Industries, FA
8. On the Value Axes tab, you must now create three value axes: one for the temperature
values of 0 ... 100 °C, one for the manipulated variable of 0 ... 100% and one for the level of
0 ... 1000 ml. ( Value Axes Object name: Value axis temperature Label: °C Value
range: not automatic New …)
For unrestricted use in educational / R&D institutions. © Siemens 2020. All rights reserved. 46
p03-01-advanced-layout-of-uis-v9-tud-0719-en.docxLearn-/Training Document | PA Module P03-01, Edition 02/2020 | Digital Industries, FA For unrestricted use in educational / R&D institutions. © Siemens 2020. All rights reserved. 47 p03-01-advanced-layout-of-uis-v9-tud-0719-en.docx
Learn-/Training Document | PA Module P03-01, Edition 02/2020 | Digital Industries, FA
9. Now you must assign the value axes to the trends. ( Trends PID - Setpoint: Value axis
temperature PID - Actual Value: Value axis temperature PID - Output Value: Value axis
output value Level: Value axis level OK)
For unrestricted use in educational / R&D institutions. © Siemens 2020. All rights reserved. 48
p03-01-advanced-layout-of-uis-v9-tud-0719-en.docxLearn-/Training Document | PA Module P03-01, Edition 02/2020 | Digital Industries, FA
10. In the runtime of the PCS 7 project, you now see the following trend display in picture
'reactor_R001'.
8.5 Creating a user-defined object
1. The steps below show how a number of objects can be grouped into a single 'User-defined
object'. First, however, it is important that none of the included objects has already been
included in groups. If such groups already exist, they must be ungrouped. ( Group
Ungroup)
For unrestricted use in educational / R&D institutions. © Siemens 2020. All rights reserved. 49
p03-01-advanced-layout-of-uis-v9-tud-0719-en.docxLearn-/Training Document | PA Module P03-01, Edition 02/2020 | Digital Industries, FA
2. Now select all objects, and right-click on the selection. Select 'Customized Object' -> 'Create'.
( Customized Object Create)
For unrestricted use in educational / R&D institutions. © Siemens 2020. All rights reserved. 50
p03-01-advanced-layout-of-uis-v9-tud-0719-en.docxLearn-/Training Document | PA Module P03-01, Edition 02/2020 | Digital Industries, FA
3. In the configuration dialog, click on 'User-defined' in the left window and select the first
property of one of the sub-objects whose parameters are to be assigned later in the finished
user-defined object. Drag this property to the left window to UserDefined2. ( User-defined
Bar1 Process Driver Connection User-defined)
For unrestricted use in educational / R&D institutions. © Siemens 2020. All rights reserved. 51
p03-01-advanced-layout-of-uis-v9-tud-0719-en.docxLearn-/Training Document | PA Module P03-01, Edition 02/2020 | Digital Industries, FA
4. In this manner, select the 'Process Driver Connection', 'Maximum Value', 'Minimum Value',
'Limit AL', 'Limit WL', 'Limit AH' and 'Limit WH' properties of the Bar object. ( Bar1:
Maximum value Bar1: Minimum value Bar1: Limit AL Bar1: Limit WL Bar1: Limit
AH Bar1: Limit WH)
For unrestricted use in educational / R&D institutions. © Siemens 2020. All rights reserved. 52
p03-01-advanced-layout-of-uis-v9-tud-0719-en.docxLearn-/Training Document | PA Module P03-01, Edition 02/2020 | Digital Industries, FA
5. For the text window 'Static Text1' that describes the reactor, have the 'Text' displayed. Then,
accept the user-defined object with OK. ( Static Text1: Text OK)
For unrestricted use in educational / R&D institutions. © Siemens 2020. All rights reserved. 53
p03-01-advanced-layout-of-uis-v9-tud-0719-en.docxLearn-/Training Document | PA Module P03-01, Edition 02/2020 | Digital Industries, FA
6. Now, copy the finished user object to store it for later use in the project library. ( Copy)
7. Next, select the button to display the library. ( Project Library right-click ->
Paste)
8. Next, change the name of the user-defined object in the project library to
'CustomizedObject_reactor_V1_0'. ( CustomizedObjekt_reactor_V1_0)
For unrestricted use in educational / R&D institutions. © Siemens 2020. All rights reserved. 54
p03-01-advanced-layout-of-uis-v9-tud-0719-en.docxLearn-/Training Document | PA Module P03-01, Edition 02/2020 | Digital Industries, FA
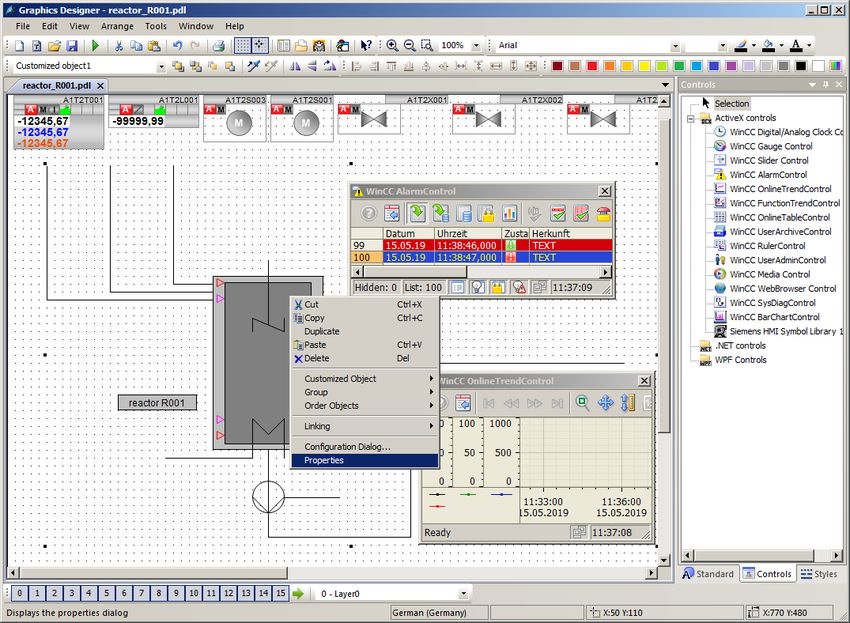
9. Now return to the user-defined object in the 'reactor_R001.Pdl' picture and select its
properties. ( Properties)
10. You will find the selected properties of the sub-objects in the properties under 'UserDefined'.
For the 'Process Driver Connection', click in the ' ' icon for 'Dynamic' and select 'Tag'. (
Tag)
For unrestricted use in educational / R&D institutions. © Siemens 2020. All rights reserved. 55
p03-01-advanced-layout-of-uis-v9-tud-0719-en.docxLearn-/Training Document | PA Module P03-01, Edition 02/2020 | Digital Industries, FA
11. From the ES Variables, select 'A1_multipurpose_plant/T2_reaction/reactor_R001
/A1T2L001/A1T2L001/Monitor_A1T2L001/PV_Out#Value'. ( ES Variables
A1_multipurpose_plant/T2_reaction/reactor_R001/A1T2L001/
A1T2L001/Mon_A1T2L001/PV_Out#Value OK)
12. For 'Dynamic', also select an 'Update cycle' of '1 s'. Set the other properties as shown here.
Then close the window. ( Update cycle 1 s Text Reactor A1T2R001 )
For unrestricted use in educational / R&D institutions. © Siemens 2020. All rights reserved. 56
p03-01-advanced-layout-of-uis-v9-tud-0719-en.docxLearn-/Training Document | PA Module P03-01, Edition 02/2020 | Digital Industries, FA
13. Finally, you should position the faceplates correctly, insert a heading and save them.
For unrestricted use in educational / R&D institutions. © Siemens 2020. All rights reserved. 57
p03-01-advanced-layout-of-uis-v9-tud-0719-en.docxLearn-/Training Document | PA Module P03-01, Edition 02/2020 | Digital Industries, FA
8.6 Using a user-defined object
1. Now, the user-defined object is also to be used in picture 'reactor_R002.Pdl'. To this end,
create a new picture in the plant view of SIMATIC Manager in the folder 'reactor R002', and
compile the changes of the OS(1).
For unrestricted use in educational / R&D institutions. © Siemens 2020. All rights reserved. 58
p03-01-advanced-layout-of-uis-v9-tud-0719-en.docxLearn-/Training Document | PA Module P03-01, Edition 02/2020 | Digital Industries, FA
2. Then, open picture 'reactor_R002' in the Graphics Designer. ( Graphics Designer
reactor_R002.Pdl Open picture)
3. Start by setting the same properties as in step 11. Then click the icon to display the
libraries and drag the 'CustomizedObject_reactor_V1_0' from the 'Project Library' into the
picture. ( Project Library CustomizedObject_Reactor_V1_0)
For unrestricted use in educational / R&D institutions. © Siemens 2020. All rights reserved. 59
p03-01-advanced-layout-of-uis-v9-tud-0719-en.docxLearn-/Training Document | PA Module P03-01, Edition 02/2020 | Digital Industries, FA
4. In the properties, you can now access the selected properties of the user-defined object
again under 'UserDefined'. Thus, you have created an object with a specific selection of
properties that can be used again and again quickly and efficiently. ( Properties Object
Properties UserDefined)
For unrestricted use in educational / R&D institutions. © Siemens 2020. All rights reserved. 60
p03-01-advanced-layout-of-uis-v9-tud-0719-en.docxLearn-/Training Document | PA Module P03-01, Edition 02/2020 | Digital Industries, FA
5. Finally, arrange the faceplates and insert a caption.
For unrestricted use in educational / R&D institutions. © Siemens 2020. All rights reserved. 61
p03-01-advanced-layout-of-uis-v9-tud-0719-en.docxLearn-/Training Document | PA Module P03-01, Edition 02/2020 | Digital Industries, FA
8.7 Checklist – step-by-step instruction
The following checklist helps students to independently check whether all steps of the step-by-
step instruction have been carefully completed and enables them to successfully complete the
module on their own.
No. Description Checked
1 Faceplate for Reactor R001 created and configured
2 AlarmControl inserted in faceplate for Reactor R001 and configured
3 TrendControl inserted in faceplate for Reactor R001 and configured
4 User-defined object for reactor created in library
5 Faceplate for Reactor R002 created and configured
6 User-defined object from library inserted for Reactor R002 and
configured
7 Project successfully archived
Table 3: Checklist for step-by-step instructions
For unrestricted use in educational / R&D institutions. © Siemens 2020. All rights reserved. 62
p03-01-advanced-layout-of-uis-v9-tud-0719-en.docxLearn-/Training Document | PA Module P03-01, Edition 02/2020 | Digital Industries, FA
9 Exercises
In the exercises, you apply what you learned in the theory section and in the step-by-step
instructions. The existing multiproject from the step-by-step instructions (p03-01-project-r1905-
en.zip) is to be used and expanded for this. The download of the project is stored as zip file
"Projects" on the SCE Internet for the respective module.
A new user-defined object will be created for the tanks with an upper and lower sensor. It can
now also be used to create detail pictures for the other plant units.
In addition, the detail pictures are to be accessible from the overview page by clicking on the
corresponding text.
The previously created detail picture of Reactor R002 is to be supplemented with a further
ActiveX control 'Online Table Control'.
9.1 Tasks
1. Create a new picture on the level of educt_tank B001. Get the template for the tank from the
library and ungroup the group.
2. Now, create a user-defined object from the tank. Select the variable parameters. The names
of the new parameters are possibly not unique and should be adapted.
For unrestricted use in educational / R&D institutions. © Siemens 2020. All rights reserved. 63
p03-01-advanced-layout-of-uis-v9-tud-0719-en.docxLearn-/Training Document | PA Module P03-01, Edition 02/2020 | Digital Industries, FA
3. In the overview picture, create links to the newly created pictures by expanding the existing
static texts to include a dynamic. For this, use the Dynamic Wizard – Picture Functions –
Picture change in working area, as in chapter P02-01.
4. In the detail picture 'reactor_R002', insert an AlarmControl and configure the list in a way that
only alarms for Reactor R002 are displayed.
5. Last, instead of an OnlineTrendControl configure an OnlineTableControl and have the level,
the actual value, the setpoint and the manipulated value of the controller displayed.
For unrestricted use in educational / R&D institutions. © Siemens 2020. All rights reserved. 64
p03-01-advanced-layout-of-uis-v9-tud-0719-en.docxLearn-/Training Document | PA Module P03-01, Edition 02/2020 | Digital Industries, FA
9.2 Checklist – exercise
The following checklist helps students to independently check whether all steps of the exercise
have been carefully completed and enables them to successfully complete the module on their
own.
No. Description Checked
1 Faceplate created for Educt tank B001
2 User-defined object for educt tank created and configured
3 Link from overview picture A1_multipurpose_plant to all newly created
sub-pictures created
4 AlarmControl inserted in faceplate for Reactor R002 and configured
5 OnlineTableControl inserted in faceplate for Reactor R002 and
configured
6 Project successfully archived
Table 4: Checklist for exercises
For unrestricted use in educational / R&D institutions. © Siemens 2020. All rights reserved. 65
p03-01-advanced-layout-of-uis-v9-tud-0719-en.docxLearn-/Training Document | PA Module P03-01, Edition 02/2020 | Digital Industries, FA
10 Additional information
More information for further practice and consolidation is available as orientation, for example:
Getting Started, videos, tutorials, apps, manuals, programming guidelines and trial software/
firmware, under the following link:
siemens.com/sce/pcs7
Preview "Additional information"
For unrestricted use in educational / R&D institutions. © Siemens 2020. All rights reserved. 66
p03-01-advanced-layout-of-uis-v9-tud-0719-en.docxYou can also read