Think Blue Massachusetts Social Marketing Guide - WORCESTER POLYTECHNIC INSTITUTE - Worcester ...
←
→
Page content transcription
If your browser does not render page correctly, please read the page content below
WORCESTER POLYTECHNIC INSTITUTE
Abdulmalek Alshehri, Reid Bailey, Nick Cumello, Constantina Gatsonis

               ThinkBlueMassachusetts
                SocialMarketingGuide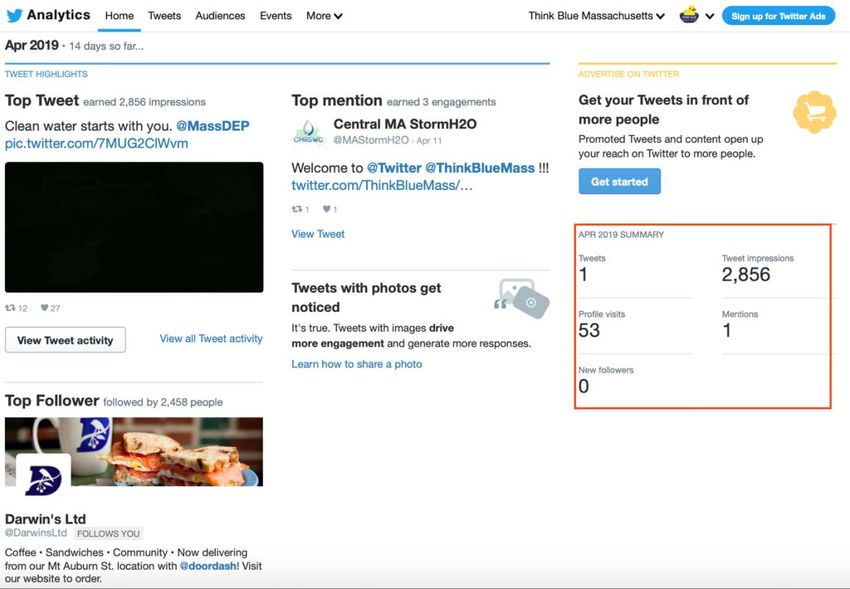
Introduction
       This guide was created by the 2019 Think Blue Massachusetts Interactive Qualifying
Project (IQP) team from WPI to serve as a reference for Think Blue Massachusetts in
effectively managing their social media as part of their social marketing campaign. This
document is intended to work in conjunction with the team’s IQP report, which is available
at the link below. This guide details the process of setting up advertisements on popular
social media platforms, how to retrieve metrics (including from third party tracking sites
connected to a website of choice), and what metrics are the most important for an analyst
to track. This document is specifically created for use by Think Blue Massachusetts but has
the potential to be useful for advancing the social media efforts of other campaigns or
organizations.
       This guide includes a general strategy to most effectively manage social media for
the purpose of outreach and brand growth. It also features step by step how-to sections
which include instructions regarding how to initiate advertisement campaigns on a variety
of social media platforms. Additionally, a general overview of the metrics each platform
provides is given, along with how to access key metrics.
       The purpose of this guide is primarily to provide a generalized method for Think
Blue Massachusetts’ social media management. Furthermore, it aims to help with launching
advertisement campaigns on a number of social media platforms and provide a method to
track and analyze the resulting metrics. Overall, the guide can be used to start up
advertisements and effectively use social media as part of a social marketing campaign.

For more information, follow the links below:
Think Blue Massachusetts
       https://www.thinkbluemassachusetts.org
2019 WPI Think Blue Team
       https://wp.wpi.edu/wroc/evaluation-of-think-blue-massachusetts-social-
       marketing-campaign/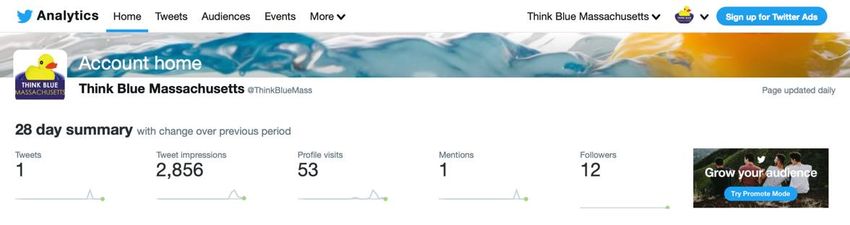
WORCESTER POLYTECHNIC INSTIT UTE

Think Blue Massachusetts Social
        Marketing Guide

                        Table of Contents
Introduction ............................................................................... i
Social Media Strategy for Think Blue Massachusetts ............... 1
Social Media Metrics ................................................................ 4
        Page and Post Likes.......................................................................... 4
        Reach ................................................................................................. 4
        Impressions ....................................................................................... 4
        Engagement ...................................................................................... 5
        Amplification Rate .............................................................................. 5
        Conversion Rate ................................................................................ 5
        Timing Metrics ................................................................................... 5
        Traffic Sources................................................................................... 6
        Click-Through Rate (CTR)................................................................. 6
        Cost per Click (CPC) ......................................................................... 6
        Cost per Thousand Impressions (CPM) ........................................... 6
        Bounce Rate ...................................................................................... 7
        Watch Time ........................................................................................ 7
        Average View Duration and Percentage Viewed ............................. 7
        Audience Retention ........................................................................... 7
Facebook ................................................................................. 8
        Facebook Metrics Overview .............................................................. 8
        Accessing the Metrics ....................................................................... 8
        Facebook Advertisements............................................................... 10
YouTube ................................................................................ 12
        YouTube Metrics Overview ............................................................. 12
        Accessing the Metrics ..................................................................... 13
        YouTube Advertisements ................................................................ 15
Twitter.................................................................................... 17
        Twitter Metrics Overview ................................................................. 17
                  Promote Mode ......................................................................................... 17
        Accessing the Metrics ..................................................................... 18
        Twitter Advertisements .................................................................... 22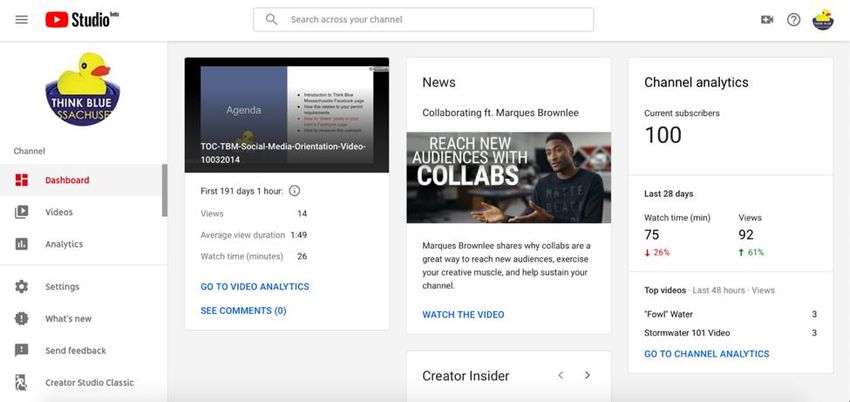
Website ................................................................................. 24
        Website Metrics Overview ............................................................... 24
        Metric Collection Tools .................................................................... 24
                 Google Analytics ...................................................................................... 24
        Accessing Metrics ............................................................................ 25
                 Wix Analytics ........................................................................................... 29
Works Cited ........................................................................... 30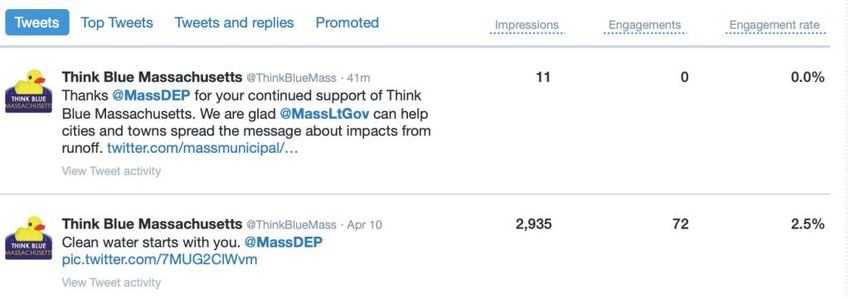
1
                                                                                         Chapter

Social Media Strategy for Think Blue

Massachusetts
        Social media can play a large role in audience engagement if integrated into an
organization’s marketing or outreach campaign. It allows for a direct connection to the general
public and, potentially, your target audience.
        A target audience should be identified. According to Bridgett Colling, the Director of
Content Marketing at See3 Communications, “A lot of nonprofits say, ‘well, our audience is the
general public,’ but if you think you’re speaking to the general public, you’re probably speaking
to nobody.” Colling instead recommends that an audience persona is developed, which is a
representation of an organization’s ideal supporters based on the demographics and general
information related to members of the target audience. This allows the organization to tailor their
content specifically to what their target audience most likely resonates with, thus increasing their
engagement and overall interest with the cause.
        The target audience will partially determine which social media platforms should be
focused on. Each social media varies in its demographics and is most popular with different age
groups, genders, races, etc. For example, Twitter’s highest age demographic is 18 – 29 years old,
whereas Facebook’s is 30 - 49 years old. A basic understanding of such demographics for social
media platforms is necessary in determining which platform will be most useful in reaching your
target audience.
        Content strategy is a method of using an organization’s preexisting social media posts
and shares to evaluate what their audience wants to see. A big question for these strategies is
“what to share”; by looking back at what got people to interact with posts and messages, an

                                                     1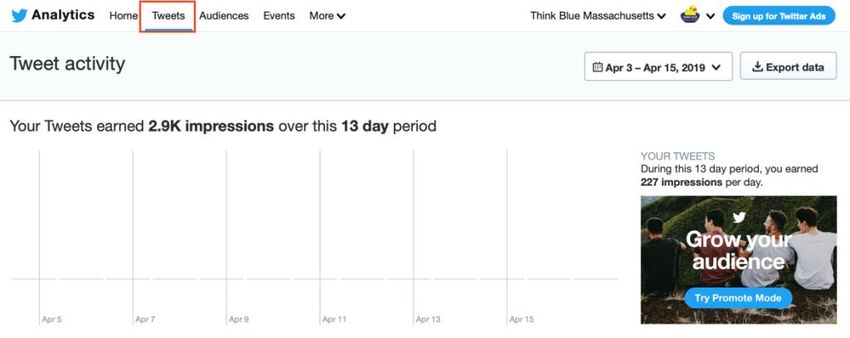
analyst can determine what the best way to approach their audience is. Another important point
is to vary the content of your page, as a mix of content will always engage your audience more
than repetition. The content should link back to the organization’s website or information
network. The next question, “when to post”, is simply answered by creating a calendar.
Determining a regular schedule to post your content, including the amount of content, will help
an organization stay on top of their social media efforts. Calendars can also decrease the workload
of making social media posts because they can be performed beforehand.
        Sprout Social collected data regarding when their customer networks, including
nonprofits, were engaged with to create heat maps of engagement. Engagement charts for both
Facebook and Twitter can be seen in Figures 1 and 2.
        According to their Facebook data, the best time for nonprofit organizations to post on
social media is Wednesday and Friday at 2 pm, followed by Monday at 9 am, Tuesday at 6 pm,
Thursday at 10 am and 12 pm, and Friday at 9 am and 11 am. It is generally safe to post from 9
am to 4 pm on weekdays. Weekends (most notably Sunday) and Monday receive the least
engagement (see Figure 1).

                  Figure 1: Facebook nonprofit organization engagement heat map.

                                                    2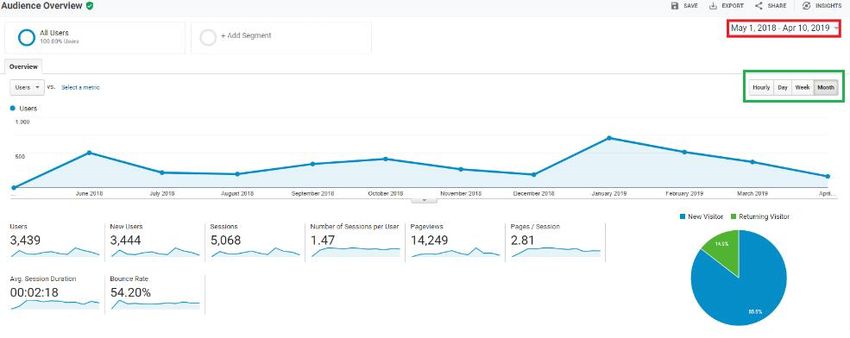
According to their Twitter data, the best time for nonprofit organizations to post on
social media is Thursday at 12 pm and Friday from 11 am to 12 pm, followed by 10 am to 2 pm
on Tuesday, Thursday, and Friday. It is generally safe to post from 10 am to 4 pm on weekdays.
Sunday receives the least engagement (see Figure 2).

                   Figure 2: Twitter nonprofit organization engagement heat map.

        Cross-promotion helps make the information on an organization’s social media
platforms as comprehensive as possible. Make means of communication such as phone numbers
and emails available and include links to the organization’s website or other social media
platforms. In the case that an organization manages multiple platforms, create and share pre-
written content that can be posted on social media platforms. Encourage your followers to share
your content, which will increase your reach.
        Tracking social media metrics is essential to monitoring campaign progress. The specific
metrics of interest to a campaign depend on the campaign’s desired goals. For example, if the
goal is engaging and educating the public, user engagement, impressions, and reach can be
tracked to measure success.

                                                   3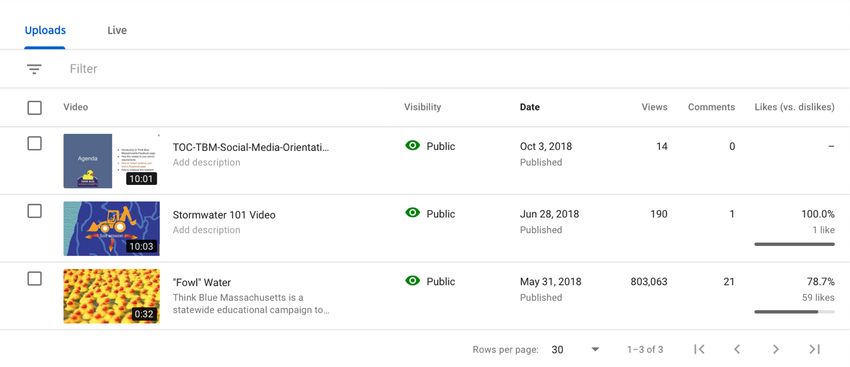
2
                                                                                        Chapter

Social Media Metrics
        There are various metrics that can be used to measure the effectiveness of a social
media page. These metrics quantitatively and qualitatively reflect the different types of
activity that occur on a social media page. They are useful in assessing the success of user
engagement with a social media page. Below, many different social media metrics are
defined to make the task of analyzing a social media page easier.

Page and Post Likes
     Page or post likes refers to the number of users who have liked your page or post. Total
likes are the number of likes amassed over a certain time period. The net likes are the total likes
minus the amount of unlikes. The source of these likes can be either organic, meaning that the
likes occurred directly on your page or post or they may have resulted from an advertisement.
Viewing likes allows for monitoring the overall growth of followers.

Reach
        Reach is a measure of the total amount of people that have watched or seen your content
or advertisement. Reach is particularly valuable for brand new campaigns, because it shows how
many people have seen the organization’s content in their feeds. In terms of advertisements,
when reach is compared with impressions, you can determine the number of effective ads versus
the number of ads that had no impact.

Impressions
        Impressions are a measurement of the number of interactions that people have with your
content or advertisements. Impressions are measured every time a user views the content or
advertisement. This metric allows an organization to measure the amount of times that their
message is shown.

                                                     4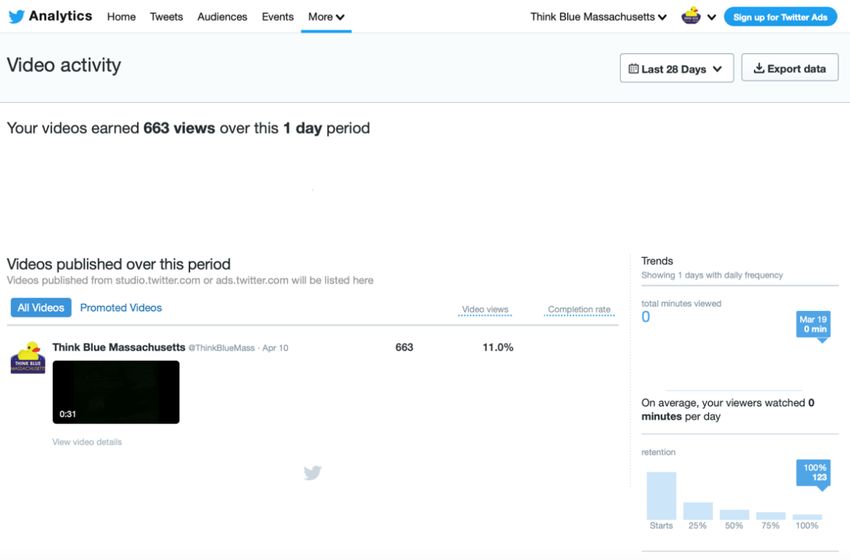
Engagement
           Engagement measures user interaction with the content or advertisements on social
media. It includes likes, clicks, comments, shares, or saves (e.g. downloads). Engagement
represents the audience’s interest in the content and advertisements. It allows for the adjustment
of new content based on what was previously well received to increase user interaction, or to
bring attention to an advertisement campaign.

Amplification Rate
           Amplification rate is the ratio of shares to followers. It is the rate at which your followers
will share your content and represents their willingness to associate with your brand. As such,
sharing the content expands a brand’s reach by exposing it to new audiences without having to
pay for advertisements. Amplification rate is often not automatically calculated by social media
platforms. It is defined as the number of shares divided by the number of total followers
multiplied by 100.

Conversion Rate
           Conversion rate is the rate at which people interact with your post versus the number of
people who potentially see your post. Using this number, the percentage of engaged audience
members can be determined. Engaged audience members are those that feel the desire to add
their voice to the poster’s own, beginning a dialogue or conversation in the comments section of
a post. Conversion rate is also entirely dependent on the sample size, or number of potential
viewers.

Timing Metrics
           Timing metrics are used to determine the peak activity hours of the website or social
media page. It is important to understand what time of day draws the most attention to your
content. Posting during these time frames will be more effective, and ads shown will have a
higher chance of generating feedback. An analyst can determine the best time to post and reach
the maximum number of people in a short time. Timing metrics help the advertiser determine
when their audience is most active and when they can expect the most feedback on their posts.

                                                         5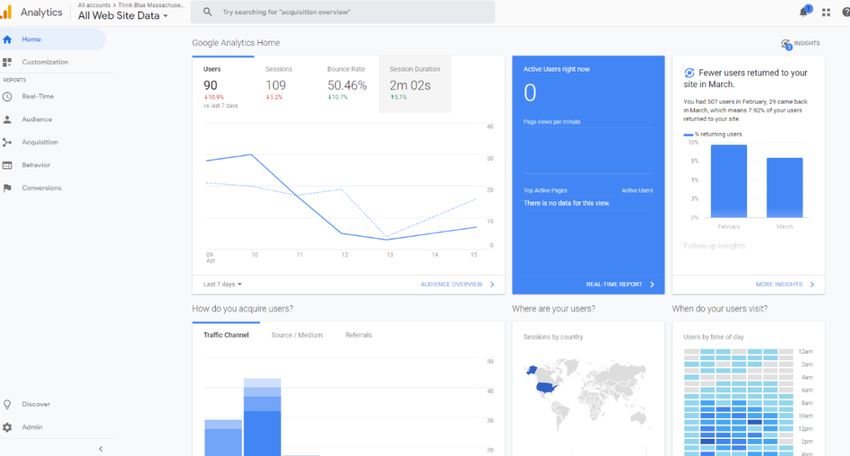
Traffic Sources
          Traffic source metrics are used to measure and track the different sources of all traffic
on your web page or social media. Using the traffic sources, an analyst can determine the most
effective way to get generate traffic. This metric will also give an indication for which source
features the highest number of “engaged views” or views by people that are curious about the
ad after seeing it. Using traffic sources is valuable in getting your message across in the right
places.

Click-Through Rate (CTR)
          Click-through rate (CTR) tracks clicks to content or advertisements, which usually
redirect the user to another link (typically to a separate website). CTR, which is automatically
calculated by most social media platforms, is the number of clicks divided by the number of
impressions, multiplied by 100. Similar to engagement, CTR relates to user resonance and can be
used to improve future content or advertisements.

Cost per Click (CPC)
          Cost per Click (CPC) is the predicted cost of every click generated over the course of an
ad campaign. CPC is defined as the division of the current advertisement costs by the number
of clicks to determine the cost of each ad per click. A good analyst will compare the CPC of each
platform to determine the maximum possible number of clicks that they can generate for their
budget.

Cost per Thousand Impressions (CPM)
          Cost per Thousand Impressions (CPM) is a measurement of how much it will cost to
generate one thousand impressions on a website. The CPM is an important metric because it
allows the advertiser to evaluate the cost of putting their ad on a website enough times that it will
create a decent outreach. Knowing this an advertiser may determine the most cost effective
websites to show their ads on by comparing the websites average traffic with the CPM.

                                                      6
Bounce Rate
Bounce rate is the number of users who arrive at individual content or websites and do
not navigate away from their destination page before leaving. A higher bounce rate indicates a
greater occurrence of this. This is sometimes due to an accidental click but is more often because
there is little value in the content or site for the user. Bounce rate is available for multiple traffic
sources, which can be compared to determine which source is effective at lowering the rate.
Watch Time
Watch time is the total number of minutes that viewers have spent watching a video.
YouTube allows for the monitoring of an individual video’s watch time and for a channel’s
cumulative watch time. The videos on a channel can be ranked by their watch times so that it
can be determined what kind of video is most engaging to your audience. This metric is important
because YouTube’s algorithm promotes channels and videos with higher watch times. YouTube
does this with a few other metrics as well, including average view duration, average percentage
viewed, and audience retention.
Average View Duration and Percentage Viewed
Average view duration is the total watch time of a video divided by its total number of
views. This metric represents the video’s capacity to engage and retain viewers. Average
percentage viewed is the percentage of each video watched by the average viewer. Increasing the
average view duration and average percentage watched will boost the video’s search and
recommendation rankings on YouTube’s website, making it easier for others to find.
Audience Retention
Audience retention refers to the percentage of viewers leave at specific parts of a video.
Portions of a video with higher audience retention rates can be mirrored in future outreach
attempts in order to keep viewers engaged. Similarly, portions of a video with lower audience
retention rates can be determined as unengaging or boring to the audience. YouTube boosts
videos with higher audience retention rate in their search and recommendation rankings.
73
Chapter
Facebook
Facebook is an important outreach tool. Homeowners typically fall in the age range of
30 - 60 years old, and within that group, 84% of people between of 30 - 49 years of age and 72%
of people between 50 - 64 years of age are on Facebook. Facebook also allows advertisers to
tailor their advertisements to specifically show up for the target audience.
Facebook Metrics Overview
Facebook Analytics (https://www.facebook.com/insights) offers a variety of account
metrics. The Facebook page’s total likes, unlikes, and follows are available, as well as additional
metrics on the type (organic vs. paid) of like and where it occurred (on your page, suggestions,
etc.). An individual post’s reach, engagement, and overall impressions can be viewed. Facebook
also offers video metrics, including how long the video is typically viewed for, when the audience
drops off, total video engagement, etc. Google Analytics (further discussed in Chapter 6) can be
used to monitor referral traffic, which is the users who visited your website from your Facebook
page. Finally, advertising metrics, such as click-through rate, cost per click, cost per thousand
impressions, cost per action, and ad frequency, are also available.
Accessing the Metrics
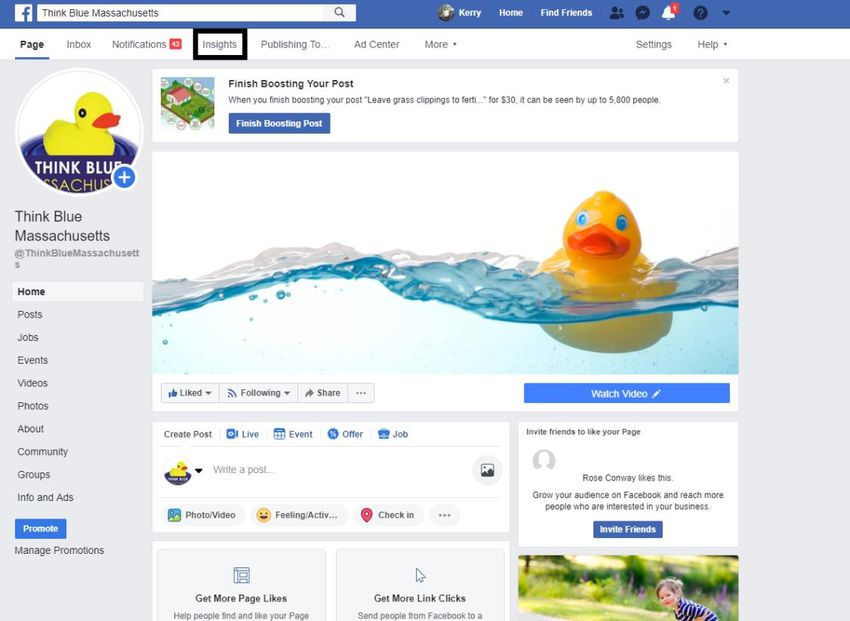
To access Facebook metrics, first go to the home page of the Facebook page. There
is a bar along the top of the page (as shown in Figure 3). To access the metrics for the page,
click on the metrics tab (boxed in black in Figure 3). Clicking the metrics tab will lead to an
overview page of all the metrics (shown in Figure 4). This page shows graphs for the page’s
major metrics over either the past week, two weeks, or month depending on the timing
window selected. The different types of metrics collected are listed on the left side of this
8page (boxed in Figure 4). Clicking on any of these metrics will show a more in depth look
at that specific metric.
Figure 3: To see a page with an overview of all the metrics Facebook collects about a page, click
the “Insights” tab, which is boxed in black, on the task bar at the top of the page.
9Figure 4: This is the overview page that shows all the different metrics that Facebook collects.
To see more detailed information about any individual metric, click on one of the metrics from
the menu on the left side of the page (boxed in black).
Facebook Advertisements
1. Log into the Think Blue Massachusetts Facebook page
2. Search and open Facebook Business in Google and select “Create ad” in the top right
corner
3. Create the ad
a. Choose the marketing objective
i. Recommended: Reach or Brand Awareness
b. Create ad account
i. IMPORTANT: Select Advanced Options and set Think Blue Massachusetts as
the account name
c. Link Think Blue Massachusetts Facebook page
d. Create new audience
i. Location: type Massachusetts out fully in the audience bar to receive the whole
state as an option
ii. Age range: Recommended 30 - 60 years old
10iii. Gender: Select All
iv. Language: leave blank
v. Detailed Targeting: Add demographics of people Think Blue wants to target, i.e.
under Demographics then under Parents you may choose Parents All or select
the age range of the children of the parents you want to target
vi. Add a Connection Type: Recommended that you scroll to the bottom of the
selection and choose Advanced Combination, then add Think Blue
Massachusetts Facebook page for the first two entries and leave the third entry
blank
e. Placements
i. Recommended to use Auto Placements
f. Budget and schedule
i. Select Advanced Options
ii. Budget: Recommended that you choose a Lifetime Budget so that the ads will
not cost over a certain amount
iii. Schedule: Recommended that you choose Start and End Date as this will
determine how long your chosen ads will run for
iv. Optimization for ad delivery: Reach for more people, Impressions for more ads
per person.
v. Frequency cap: Set how many times a person will see your ad for a period of days,
e.g. your ad will be shown a maximum amount of three times every seven days.
vi. Bid strategy: Recommended you leave this blank for the most cost-effective
strategy; this will, however, put Facebook in charge of your ad bids
vii. Ads scheduling: Set times for when the ads will be shown, recommended: 7am,
12am, 6pm - 11pm
g. Make your ad
114
Chapter
YouTube
YouTube, which is both a social network and a search engine, is a powerful outreach
tool due to its reach and traffic. It reaches more people in the 18 – 49 age group than any cable
network provider in the United States. Almost one-third of the internet (over 1.9 billion people)
are YouTube users, and they generate one billion hours of views daily. YouTube has also seen
rapid growth in the recent years. The number of channels on YouTube with more than one
million subscribers increases by 75% annually. YouTube is an indispensable social marketing and
advertising platform.
YouTube Metrics Overview
YouTube offers easily accessible metrics regarding your channel and videos. Similar to
other social media platforms, you can view your subscriber growth, engagement (e.g. likes,
comments, shares), and traffic sources. Regarding a channel’s videos, YouTube has a variety of
metrics. The total amount of minutes viewers have watched your videos (watch time), the
percentage of each video watched, viewing duration, audience retention, and click-through rates
are available. The demographics of the audience, such as their age, gender, and geographical
locations, can be viewed. This specific feature allows for the comparison of your actual audience
versus your target audience, which can be useful in determining how your messages are reaching
your target audience and what adjustments should be made.
12Accessing the Metrics
To access the YouTube metrics, click on your
profile picture on the top right corner of the YouTube
website after logging in. A popup with options will appear.
Select “YouTube Studio”, which is outlined in a red box in
Figure 5. This option will bring redirect you to your
channel’s dashboard (as seen in Figure 6), which allows you
to navigate to your video and channel analytics. Figure 5: Popup menu which allows
you to navigate to YouTube Studio.
Figure 6: After redirecting to YouTube Studio, your channel’s dashboard will
appear, which features quick metric summarizations and news.
Under the YouTube Studio logo on the left of the screen, the
two most important options are “Videos” and “Analytics”. Selecting
“Videos” (see Figure 7) shows a dashboard with your uploaded videos.
For each video, its visibility (whether it is public or private), its publish
date, total views and comments, and likes vs. dislikes ratio is available.
Figure 8 below shows the dashboard format, along with the video
metrics. Figure 7: The “Videos”
tab, which is available
on the left of the screen.
13Figure 8: After redirecting to YouTube Studio, your channel’s dashboard will
appear, which features quick metric summarizations and news.
Selecting “Analytics” (see Figure 9) will redirect you to the
overview tab of your dashboard, which includes your watch time, views,
and subscribers over the last 28 days (outlined in red). The time range can
be altered to reflect changes over any particular period of time (outlined
in yellow). Additionally, the channel’s top videos are available on the
bottom left panel, ranked by their watch time (outlined in green). The
panel on the bottom right shows your most recent channel activity,
including the most viewed videos (outlined in purple) (see Figure 10).
Figure 9: The “Analytics”
tab, which is available on
the left of the screen.
14Figure 10: The Analytics overview dashboard. Watch time, views, and subscribers
are seen in red. The time range, which can be changed, is outlined in yellow. The bottom
left panel, outlined in green, shows the most popular videos in terms of watch time over a
time range. The bottom right panel, outlined in purple, shows the channel’s most recent
view activity.
YouTube Advertisements
1. Create an account on Google AdWords
a. Adwords.google.com/video
2. Link AdWords and YouTube
3. Set your desired daily budget
a. Typical price is $0.1 to $0.23 per ad
15b. Only paid if viewer watches the entire ad
4. Set ad location
a. Useful for targeting viewers around the organization
b. Can be very specific, such as zip codes, IP addresses, etc., or broad, such as regional
5. Upload the advertisement to your YouTube account
6. Advanced settings
a. Shut off ads from 12 am – 6 am
b. Schedule ads to run more frequently during lunch hours and other times that your
audience may be free (ex. 6 pm – 9 pm)
7. Target specific devices (if necessary)
8. Target specific ages, genders, topics/interests/categories, etc.
9. Choose keywords
a. Make the keywords as specific as possible to capture the right audience
165
Chapter
Twitter
Twitter is a social media platform used by 40% of people aged 18-29. This demographic
represents future and current young parents and homeowners. It is the single fastest source of
news in the world, allowing real time updates to world events and issues; it is estimated that 71%
of Twitter users read news there. Additionally, people are 31% more likely to remember things
they have seen through Twitter. Twitter’s advertising engagement saw a 50% increase between
October 2017 and 2018, and this trend is expected to continue. Twitter is an effective platform
to reach millennials.
Twitter Metrics Overview
Twitter Analytics (https://business.twitter.com/en/analytics.html) is key to tracking the
quality of your tweets and the engagement of your audience. By using the metrics provided by
Twitter Analytics a marketer can determine who their audience is, what resonates with them,
what their peak usage hours are, and how effective their tweets and ads are. This allows marketers
to quantitatively gauge responses and engagement. If you are more money conscious, then these
metrics can also tell you the cost of engagement per tweet. Using these tools can improve a
marketing campaign.
Promote Mode
Twitter also features a “Promote Mode” which costs a flat rate of $99 a month for
accounts that are eligible. In order to define an eligible account Twitter has set the following
requirements: first, that the account is active and public. Second, the account must have a proper
header image, profile image, description (including a linked website). This will allow the user to
have their Tweets spread to new user’s feeds. Despite costing a flat rate, it is more effective the
17more often you use Twitter. Twitter Business states that promoted tweets with videos saved 50%
on their cost per engagement and attracted ten times as much user engagement.
Accessing the Metrics
To access the Twitter metrics, click on your profile
picture on the top right of the Twitter website. Select
“Analytics” from the menu that appears, which is outlined
in red in Figure 11. You will be redirected to the Analytics
home page, seen in Figure 12. A 28 day summary for the
account is available at the top of the dashboard, which
features the number of tweets, impressions, profile visits,
account mentions, and followers.
Figure 11: The “Analytics” tab, which is
available from the drop menu.
Figure 12: After redirecting to Twitter Analytics, you will be redirected to the account’s
dashboard. At the top of the dashboard is the 28 day summary.
Underneath the 28 day summary is a dashboard of recent Twitter highlights, such as
your top Tweet (measured by its total impressions), top mention (measured by total
engagements), and top follower. On the bottom right of the dashboard, outlined in red in Figure
13, there is a recent Twitter summary which displays the same metrics as the 28 day summary.
18Figure 13: Overview of the Analytics Home dashboard.
Clicking on the “Tweets” tab, outlined in red in Figure 14, redirects you to metrics
regarding your Tweets. The impressions for all Tweets in a given time period, which can be
altered, are available. Additionally, metrics for individual Tweets are given, also seen in Figure 14.
The impressions, engagements, and engagement rate are available next to their respective Tweet.
19Figure 14: Overview of the Analytics Tweets dashboard.
On the right of the screen, a summarization of key
metrics is provided in a column. A few of these metrics can be
seen in Figure 15. The metrics included in the sample
screenshots are engagement rate, link clicks, and retweets,
though there is information available for likes and replies.
Figure 15: Sample metrics
available in the column on the
right side of the page.
20If there are videos posted on the Twitter account, their metrics can also be viewed. To
do this, click on the “More” tab
and click on “Videos”. These
options are outlined in red in
Figure 16. Figure 16: Reaching video metrics on Twitter.
Once redirected to the video activity dashboard (seen in Figure 17), you are presented
with a summary of videos published over the last 28 days, and this time period can be altered.
Directly under “video activity” is a count of the total video views over the span of time since
they were uploaded. Underneath the view count is an overview of the videos posted, along with
their respective views and completion rate, which represents the percentage of viewers that
watched the entirety of the video.
Figure 17: Overview of the Analytics Videos dashboard.
At the top right of the page on any Analytics tab, there is the option to export the data,
usually placed next to the time range (seen in Figure 18). Selecting this option will download a
21Microsoft Excel sheet of the data relevant to the dashboard you are viewing. It is often more
comprehensive than the summaries provided.
Figure 18: “Export data” option next to the time range.
Twitter Advertisements
1) Log into the Think Blue Massachusetts Twitter profile
2) Search and open Twitter Ads in Google and select “Go to Twitter Ads” on the right
3) Create the ad
a) Choose the marketing objective
i) Recommended: Awareness, Followers or Tweet Engagement
b) Create your campaign
i) Name your campaign: Any name, specify if you plan on creating more
than one
ii) Campaign budget: Recommended that you choose a Total Budget so
that the ads will not cost over a certain amount
iii) Pacing: Standard is recommended, this is under Advanced Options
iv) Schedule: Recommended that you choose a start and end date for the
campaign to run
v) Ad group: A single ad for your campaign, name it
(1) Specify the start and end time if it is seasonal
(2) Set a total ad group budget if you want this ad to have its own
budget (separate to Campaign Budget)
(3) Recommended you choose Automatic for the bid type
vi) Gender: Select Any
vii) Age Range: Recommended 35 years and older
22viii) Location: type Massachusetts out fully in the audience bar to receive
the whole state as an option
ix) Audience Features: Type in keyword Stormwater
x) Recommendations: Turn ON
xi) Retarget people who…: Turn ON
xii) Select Tweets you want to advertise
c) Launch the campaign
236
Chapter
Website
Having a website is one of the most important tools for any program because you
can not only provide a central location for all your materials, but you can also see exactly
how many people are directly engaging with your information. Using an analytics program
is one of the most direct ways to track engagement on your website. Since the website is
where Think Blue’s outreach materials on stormwater awareness and prevention are located,
monitoring how many people view the website is an instrumental part of tracking the
effectiveness of the program.
Website Metrics Overview
The types of data you can get by tracking a website depends on the tool used for
collecting the metrics. Generally, the tracking tool shows how many visitors have been to
the website and at what times of the day. In addition to this, certain metrics show how much
time people spent on the website. Some tools may include visitor demographics rather than
only the quantity of people. Having all these analytics is important because they give an
accurate representation of how successful the website is in outreach.
Metric Collection Tools
There are two suggested ways to track the traffic of your website. The Wix Analytics tool
can only be used if you have a website created through Wix. This tool easy to use and implement,
but it does not show a detailed report. Google Analytics is a free tool that provides a wide range
of data including demographics, interests, location, and other metrics.
Google Analytics
1. Create Google Analytics account
24a. Go to www.google.com/analytics
b. Click Start for Free and follow the steps
2. Set up a property (your website) in the account
a. Click Admin
b. In the Account column, use the menu to select the account to which you want to
add the property
c. In the Property column, select Create new property
d. Select website and enter the name and the URL of the website
e. Select an Industry Category so that you can use goal templates
f. Select the Reporting Time Zone
g. Click Get Tracking ID, as this will allow you to access your data
3. Set up a reporting view in your property
a. Click Admin
b. In the View Column, select Create new view
c. Select Website
d. Enter Name and select Reporting Time Zone
e. Click the toggle ON to create a User ID View
4. Add the tracking code to your website
a. In Wix, go to Marketing Integrations
b. Go to Google Analytics and click Go for it
c. At the top right click Connect Google Analytics and paste the User ID View
d. Select IP Anonymization checkbox and Click Save
Accessing Metrics
To access metrics on Google Analytics, first go to www.google.com/analytics and sign in.
From the top of the homepage select the property (your website) you want to view the metrics
for. An overview of most of the graphs is shown in Figure 19 below.
25Figure 19: Home page of Think Blue Massachusetts’ Google Analytics.
In order to view the total users graph and determine the total amount of users that have
visited the site, navigate to the left-hand side of the screen and choose the “Audience” tab.
Under the “Audience” tab, select “Overview” (see Figure 20).
26Figure 20: Left side tab on the home page, which redirects you to “Audience”.
Set the graph to show metrics for a certain period on the right top of the page, outlined
in red in Figure 21 below. Set the graph to show months by clicking on the right top of the graph,
outlined in green. The page shows data in forms of a graph, pie chart, and row data.
Figure 21: Total users graph set up to reflect May 1, 2018 to April 10, 2019. The time range
is outlined in red. The time intervals on the graph are outlined in green.
27To view the “Impressions and Engagement” graph, select “Behavior” on the left menu and
click “Overview” (see Figure 22).
Figure 22: Left side tab on the home page, which redirects you to “Behavior” (outlined in red)
and “Overview” (outlined in green).
The graph can be altered to reflect metrics for specific time periods. The time range is
outlined in red at the top right of the graph in Figure 23. The graph can be set to show different
time intervals for metrics, which is outlined in green. This graph shows how much time a website
visitor spends on all website pages. The yellow box includes metrics that are important to analyze.
28Figure 23: Engagement and impression graph. The time range is outlined in red, the time
intervals on the graph are outlined in green, and the important metrics are outlined in yellow.
Wix Analytics
1. Access the Blog Manager
a. Accessing the Blog Manager from the Editor:
b. Click My Blog on the left side of the Editor
c. Click the Blog Manager tab
d. Click Manage Your Blog
2. Click Insights
3. Click Site traffic
4. Under “How Many Times is Your Site Visited?” choose the time frame you wish to view
from the top right corner:
a. Last Week: This view displays the number of site visits during the past 7 days
b. Last 3 Months: This view displays the number of site visits during the past 3 months
c. Last Year: This view displays the number of site visits during the past year
d. Note: The number beneath the title is a sum of the site’s visits in the chosen time
frame
29Works Cited
Chi, C. (2018). YouTube analytics: The 15 metrics that actually matter. Retrieved from
https://blog.hubspot.com/marketing/youtube-analytics
Christensen, A. (2013). How to start YouTube advertising in 9 steps. Retrieved from
https://searchenginewatch.com/sew/how-to/2269060/how-to-start-youtube-
advertising-in-9-steps
Cooper, P. (2019). 28 twitter statistics all marketers need to know in 2019. Retrieved
from https://blog.hootsuite.com/twitter-statistics/
Dogulin Digital. (2013). 13 advantages of having a website for your business. Retrieved
from https://www.dogulindigital.com.au/advantages-benefits-website-for-business/
Gaitho, M. (2017). How to make YouTube your social media marketing tool. Retrieved
from https://www.simplilearn.com/youtube-marketing-article
Google Analytics. (2018). Think blue google analytics. Retrieved
from https://analytics.google.com/analytics/web/?authuser=1#/report-
home/a121190341w179048609p177450970/%3F_u.date00=20180501&_u.date01=2
0190409
Google Support. (2019). Get started with analytics. Retrieved from
https://support.google.com/analytics/answer/1008015?hl=en
Jackson, D. (2017). 11 Facebook metrics every brand needs to track. Retrieved from
https://sproutsocial.com/insights/facebook-metrics/
Johnston, A. (2017). A strategic guide to social media for nonprofits. Retrieved
from https://sproutsocial.com/insights/nonprofit-social-media-guide/
Omnicore. (2019). Facebook by the numbers: Stats, demographics & fun facts. Retrieved
from https://www.omnicoreagency.com/facebook-statistics/
Sehl, K. (2018). How to use twitter analytics: The complete guide for marketers. Retrieved
from https://blog.hootsuite.com/twitter-analytics-guide/
Sterling Fair. (2019). Vendors. Retrieved from http://sterlingfair.org/vendors/
The Spencer Fair. (2019). Vendors. Retrieved from https://spencerfair.org/vendors.html
Wachusett Area Chamber of Commerce. (2019). Holden days. Retrieved from
https://wachusettareachamber.org/events/holden-days/
30Wix. (2019a). Adding your google analytics tracking ID to your Wix site. Retrieved from
https://support.wix.com/en/article/adding-your-google-analytics-tracking-id-to-
your-wix-site
Wix. (2019b). Viewing the number of visits to your site. Retrieved from
https://support.wix.com/en/article/viewing-the-number-of-visits-to-your-site
York, A. (2018). Best times to post on social media: 2018 industry research. Retrieved
from https://sproutsocial.com/insights/best-times-to-post-on-social-media/
YouTube. (2019). YouTube for press. Retrieved from
https://www.youtube.com/yt/about/press/
31You can also read