Assessment of the Gross Impact of the Columbus Blue Jackets and Nationwide Arena on the Greater Columbus Area - Prepared by
←
→
Page content transcription
If your browser does not render page correctly, please read the page content below
Assessment of the Gross Impact of the Columbus
      Blue Jackets and Nationwide Arena
        on the Greater Columbus Area

                                             Prepared by

                                                   Contact:
                                                David Wirick
                                                614-292-5360
                           david.wirick@jgippm.ohio-state.edu

                   July 2008
TABLE OF CONTENTS
TABLE OF CONTENTS ..................................................................................................................................... i
LIST OF FIGURES AND TABLES .................................................................................................................. ii
Project Overview ............................................................................................................................................... 1
Summary of the Results of the Study and Conclusions ........................................................................ 1
The Study ............................................................................................................................................................ 2
Gross Economic Impact of the Blue Jackets and Nationwide Arena ................................................. 4
Facility Costs.................................................................................................................................................... 5
Player Costs..................................................................................................................................................... 5
Other Hockey Costs........................................................................................................................................ 6
Blue Jackets and Nationwide Arena Operating Costs .............................................................................. 7
Costs Incurred by Vendors and Other Third Parties ................................................................................. 7
Concert and Entertainment Events (Non-Hockey, Non-Football) ........................................................... 8
Columbus Destroyers ..................................................................................................................................... 9
Taxes Paid........................................................................................................................................................ 9
Job Creation................................................................................................................................................... 10
Geographic Draw of the Fan Base ............................................................................................................. 11
The Role of the Blue Jackets and Nationwide Arena in Building a Sense of Community among
Central Ohioans............................................................................................................................................... 13
Charitable Contributions from the Blue Jackets Foundation ............................................................. 15
Contributions of the City of Columbus to the Arena............................................................................. 15
Concluding Comments.................................................................................................................................. 15
Notes .................................................................................................................................................................. 16
iLIST OF FIGURES AND TABLES
Figure 1. Blue Jackets Related Expenditures ................................................................................................... 4
Figure 2. Nationwide Events and Blue Jackets Sales by Zip Code in 2007..................................................... 12
Figure 3. Tickets Sold at Nationwide Arena Events ....................................................................................... 13
Figure 4. Blue Jackets Fan Involvement and Community Connection............................................................ 14
Table 1. Facility Costs ...................................................................................................................................... 5
Table 2. Hockey Player Costs.......................................................................................................................... 6
Table 3. Other Hockey Costs........................................................................................................................... 6
Table 4. Cost of Operations............................................................................................................................. 7
Table 5. Vendor/Third Party Payments ............................................................................................................. 8
Table 6. Local Spending on other Nationwide Arena Events ........................................................................... 9
Table 7. Columbus Destroyers Expenditures.................................................................................................... 9
Table 8. Local Income Tax Revenue Generated by Sporting Events .............................................................. 10
Table 9. Blue Jackets, Destroyers, and Contractor Employment and Expenditures ........................................ 10
Table 10. Nationwide and CBJ Ticket Sales and Season Ticket Holders........................................................ 13
iiProject Overview
In the last 10 years, much has changed in that area of Columbus now commonly known as the Arena
District. Where there was once a crumbling state prison and little of economic or community value,
there is now a thriving economic engine and point-of-pride for the Central Ohio area. Where there
was once a “brownfield,” there is now a centrally located venue for sports and entertainment
activities of the variety sought by cities seeking to establish a unique sense of local identity.
There is little argument that the driving forces in that remarkable transition have been the
establishment and operation of the Columbus Blue Jackets of the National Hockey League and the
construction and operation of the Nationwide Arena, the home of the Blue Jackets and site of
approximately 40 non-hockey events each year.
As the 10th anniversary of the establishment of the Columbus Blue Jackets approached, the
managers of the franchise, who also manage the Nationwide Arena; Nationwide Arena, LLC, who
own the arena; and the Franklin County Convention Facilities Authority (FCCFA) expressed their
interest in assessing the value of the Blue Jackets and the Arena, not simply as an economic entity
itself but as a community asset for the Central Ohio area.
The study was conducted by the John Glenn School of Public Affairs at The Ohio State University
and analyzed the gross impact of the Columbus Blue Jackets and the Nationwide Arena on the
Central Ohio area. Researchers from the Glenn School collected data from the Blue Jackets,
Nationwide Arena, and a variety of other sources in order to assess the annual contribution of the
Blue Jackets and the Nationwide Arena to the Central Ohio economy and the historical contribution
of the Blue Jackets and the Nationwide Arena across the decade since the vision of professional
hockey and a downtown arena began to be realized.
In addition to assessing the gross economic impact of the Blue Jackets, the study also examined the
extent to which the presence of a professional hockey team assists in the development of a sense of
community in Central Ohio.
Summary of the Results of the Study and Conclusions
It is clear from this analysis that the Columbus Blue Jackets and Nationwide Arena have an
important economic and social impact on central Ohio. Beyond the millions of dollars that are now
being spent in a completely revitalized neighborhood just north of downtown, the Blue Jackets are
considered by their fans to be an important community asset that enhances their perceptions of their
hometown. Nationwide Arena and the surrounding area have also become a prime destination for
visitors to Columbus.
Some of the major findings and conclusions of this study include the following:
• The Blue Jackets and the Nationwide Arena represent a substantial economic force in central
Ohio. Across the 10 years of initiation, founding, and operation of the Blue Jackets and the
Nationwide Arena, more than $850 million of spending in central Ohio is directly attributable to
the Blue Jackets, Columbus Destroyers, and Nationwide Arena.
1• Over the past nine years, an average of 159 full time employees, 972 part time employees
and 87 athletes can be attributed to Nationwide Arena and the Blue Jackets’ presence in
Columbus. In addition, an average of 1,185 people per year volunteer with Delaware North
Sports Service at the concession stands serving food at games and events.
• A survey conducted at a March 2008 Blue Jackets game provides clear evidence of the
emotional connection between hockey fans and the community.
• Over 90% of survey respondents were proud of Columbus for having a NHL team, and 96% of
the fans’ experience is characterized by very or moderately intense emotions, indicating that
the Blue Jackets are delivering an emotionally absorbing entertainment experience.
• 78% of the survey respondents believed that the “Blue Jackets give the rest of the country the
idea that Columbus is a big time city.”
• Memories of Blue Jackets games also help build a sense of community identity. 77% of the
respondents indicated that memories of the Blue Jackets involved family and friends.
• 45% of survey respondents indicated that they have “taken an interest in community events
through their participation as a Blue Jackets fan.”
• Almost $4 million in local income tax revenue, net of taxes paid in other jurisdictions, was
generated by the Blue Jackets and Destroyers since fiscal year 2002. This total includes a tax
on visiting Arena Football and National Hockey League teams.
• Patrons and fans attending events and games at Nationwide Arena also add to the economic
impact. As Figure 2 in the report indicates, many attendees are from central Ohio, but the
draw to Columbus for events extends well beyond Columbus. Attendees from outside central
Ohio are particularly beneficial for the local economy, as their spending can be considered to
be new spending in the local economy rather than a substitution from other local expenditures.
• It is estimated that $160 million in indirect spending in area hotels and restaurants can be
attributed to out-of-town visitors to games and other events in Nationwide Arena.
• The Blue Jackets have also had an important impact on the community through their
charitable giving through the Blue Jackets Foundation. Between fiscal years 2002 and 2006,
the Foundation has made grants to 28 different non-profit organizations and participated in 17
different hockey development initiatives in Central Ohio. Over the five years, over $1 million
has been donated to programs through grants and donations.
• Vendor sales have led to more than $4.6 million earned by non-profit agencies due to a
percentage of sales they received for their volunteer work for the vendors.
• Respondents were familiar with the community involvement activities of the Columbus Blue
Jackets, as 82% reported being familiar with at least some of the programs.
The Study
This report is Phase 1 of a two-part study. Phase 1 examines the footprint of the Blue Jackets and
Nationwide Arena on the Central Ohio area. Phase 2 will expand that study to include the gross
impact of the Arena District.
In order to accomplish the assessment of the gross impact of the Blue Jackets and Nationwide
Arena, the Columbus Blue Jackets contracted with the John Glenn School of Public Affairs at The
Ohio State University. It is common for economists to engage in impact assessments of sports
franchises. Those impact assessments are largely targeted at determining a return on investment on
2public funds invested in arenas or the franchise itself. In the case of the Columbus Blue Jackets, that
type of analysis was not called for, in that
• Nationwide Arena was constructed using private funds
• The Blue Jackets’ franchise was purchased using private funds
• While property taxes on the arena were 99% abated for the first 15 years, an agreement was
reached to compensate the Columbus Public Schools an annual amount from a surcharge on
tickets, worker incomes, and Nationwide Insurance, if needed, as if the abatement were not in
place.
This document presents the study conducted by the John Glenn School of Public Affairs that
examines the gross economic impact of the Columbus Blue Jackets and the Nationwide Arena on
the Central Ohio area. It identifies, categorizes and measures the current economic “footprint” of the
Blue Jackets and the Nationwide Arena. It does not attempt to determine the ROI on public funds
associated with the franchise or the arena, which, as indicated, were limited. Further, by measuring
the “gross impacts” of the Blue Jackets and Nationwide Arena, the authors did not attempt to
estimate how much of the reported local spending would have occurred anyway in other parts of
central Ohio had the Arena not been built and the Blue Jackets not come to Columbus.1 As is
indicated below, the 2008 data were estimated, as were certain other data where necessary. The
authors attempted to be conservative when making those estimates, including using current dollar
figures instead of adjusting historical data for the effects of inflation.
This report also includes an assessment of the non-economic impact of the Blue Jackets on Central
Ohio by assessing the community and social impact of professional sports on a metropolitan area
and the role of the Blue Jackets in creating a sense of community in Central Ohio, an important
adjunct to the gross economic benefits of the Blue Jackets. That portion of the report employed a
survey of those attending a Blue Jackets game.
With the exception of the survey data, this study was conducted using data provided by the Blue
Jackets, Nationwide Arena, the City of Columbus, the Greater Columbus Sports Commission, the
Columbus Chamber, and a variety of contractors and vendors. In every case, data was provided
promptly and willingly by those sources. We thank them for their cooperation and participation.
The economic research conducted in this study was managed by Dr. Robert Greenbaum of the John
Glenn School of Public Affairs at The Ohio State University. He was assisted by Ms. Reena Uppal, a
doctoral student at the John Glenn School.
Research on the non-economic impacts of the Blue Jackets on Central Ohio was led by Dr. Timothy
Curry of The Ohio State University Department of Sociology. He was also assisted by Ms. Uppal.
Mr. David Wirick, a Visiting Scholar at the Glenn School, assisted with project management and
coordination.
3Gross Economic Impact of the Blue Jackets and Nationwide Arena
The analysis identified over $680 million in expenditures related to the Blue Jackets and the
Nationwide Arena through fiscal year 2008, as reported in Table 1 through Table 9. When the $20
million in start-up fees and the approximately $155 million in construction costs (described in the
following paragraph) are added, the total exceeds $850 million (see Figure 1). Additionally, we
estimate that another $160 million of spending in central Ohio can be attributed to out-of-town visitors
who travel to Columbus for games and other events. In this total, we have not included figures on
the contributions of Columbus and Franklin County in terms of tax abatements and a net cost of
approximately $36 million for infrastructure improvements. Throughout the report, the figures for
fiscal year 2008 were estimated by the Blue Jackets. It is also important to point out that the NHL
lock-out year of 2004-2005 substantially reduced the reported hockey related expenditures and
related visitor spending in the middle of the study period.
Figure 1. Blue Jackets Related Expenditures
Fiscal Years 1998-2008
Total: $858 million
Notes:
Source: Columbus Blue Jackets and Columbus Destroyers
Dollar figures in millions
4Facility Costs
Table 1 presents the facility costs for Nationwide Arena between fiscal years 2001 and 2008. Over
this period, more than $70 million was spent on expenses related to the arena. Not included in the
table are the $150-160 million spent on the construction of the Arena, which opened in the fall of
2000. Thus, projecting spending through June 2008, approximately $225 million has been spent in
the local economy directly related to the Nationwide Arena building.
The direct costs identified do not include the $80 million franchise fee paid to the National Hockey
League for the team. We do not include that expenditure in the total because that money did not
stay in the central Ohio economy. However, an additional $20 million in start-up fees was expended
primarily in central Ohio and is not included in Table 1. These expenditures include salaries, office
space, rent for the Fan Preview Center, marketing, and team scouts.
Table 1. Facility Costs
Fiscal Years 2001-2008
Category Total
Capital Expenditures $26.3a
Annual Rent 21.0
Ticket Surcharge 6.5
Capital Reserve 5.4
Personal Property Tax 4.9
Concourse Naming Rights 4.3
Tax Deposit Account 2.2
Total $70.5
Notes:
Source: Columbus Blue Jackets
Dollar figures in millions
Figures for FY 2008 projected by CBJ
a
Includes capital set up costs prior to FY 2001
Table 1 also presents the various components of the facility costs. Through 2008, capital costs have
amounted to over $26 million. The bulk of this spending occurred when the arena first opened, as
almost $23 million dollars in capital expenditures were incurred through 2001. $6.5 million of this
total includes a ticket surcharge paid by ticket buyers, collected by the Blue Jackets, and remitted for
the Columbus School District, to compensate the District for property taxes abated on the Arena
property.
Player Costs
Table 2 presents the approximately $269 million of expenditures on players since the team entered
the league in 2000.2 These figures only include expenditures on the major league team and do not
include the players signed to minor league contracts. The $235 million in team payroll comprises the
vast majority of these expenditures, having risen from just under $23 million in the inaugural season
to $38 million in fiscal year 2008. Also included among the player costs are over $18 million in
aircraft-related costs.3
5Table 2. Hockey Player Costs
Fiscal Years 2001-2008
Category Total
Payrolla $235.3
Aircraft (total costs)b $18.6
Pension Fund Payment $3.9
Equipment $3.0
Health Insurance $2.6
Worker's Compensationc $2.3
Lodgingd $1.8
Per Diemd $1.1
Ground Transportationd $0.4
Total $269.0
Notes:
Source: Columbus Blue Jackets
Dollar figures in millions
Figures for FY 2008 projected by CBJ
a
Major League only
b
Estimated FY2001 and FY2004-2008
c
Actual outlays of self-insured workers compensation
d
Estimates based upon Blue Jackets’ expenditures in other cities
Other Hockey Costs
Table 3 represents almost $27 million in other hockey-related expenditures between fiscal years
2001 and 2008. The salaries of the local hockey operations employees, almost $21 million,
represent the vast majority of this total. Benefits on these salaries (approximately $1.8 million), the
local training camp expenses ($2.7million), and $1.6 million of other local expenses represent the
balance of these Columbus-areas expenditures.
Table 3. Other Hockey Costs
Fiscal Years 2001-2008
Category Total
Hockey Operations Salariesa $20.8
Training Camp Expensesb $2.7
Benefitsc $1.8
Other Local Expenses $1.6
Total $26.9
Notes:
Source: Columbus Blue Jackets
Dollar figures in millions
Figures for FY 2008 projected by CBJ
a
Only includes personnel residing or working in Columbus
b
Only local expenses are included
c
The health benefits and 401k matches are estimated
6Blue Jackets and Nationwide Arena Operating Costs
Table 4 presents the almost $112 million in expenses related to the cost of operations between fiscal
years 2001 and 2008. The table distinguishes between the $74 million in Blue Jackets related
expenses, presented in the left half of the table, and the $38 million in building related expenditures.
The Blue Jackets related expenditures are dominated by approximately $33.5 million in business
staff salaries and benefits. The other large expenditures have been marketing and advertising ($16.5
million) and retail expenditures ($11.4 million).
Among the $38 million in building-related expenditures reported in the right half of Table 4, the
largest expenditures include salary and benefits, summing to $13.5 million; electric, gas, and water
utilities at $12.7 million; building maintenance at almost $6 million; and insurance at $3.8 million.
Table 4. Cost of Operations
Fiscal Years 2001-2008
Blue Jackets Related Building Related
Category Total Category Total
Business Staff Salaries $29.9 Building Staff Salaries $11.6
Marketing & Advertisinga $16.5 Electricity $8.3
Retailb $11.4 Building Maintenance $5.9
c
Benefits - Business Staff $3.6 Insuranced $3.8
Insuranced $2.7 Gas $3.7
General & Administrativee $2.7 Benefits - Building Staffc $1.9
Management Fees $1.8 Telecommunications $0.7
Game Presentation $1.8 Water $0.7
Telecommunications $1.2 Marketing & Sales $0.6
Professional Feesf $1.2 General & Administrativee $0.5
Broadcasting $1.2
Total Blue Jackets $74.0 Total Building $37.8
Notes:
Source: Columbus Blue Jackets
Dollar figures in millions
Figures for FY 2008 projected by CBJ
a
Columbus Blue Jackets corporate sales, marketing, ticketing, public relations, community relations, and
foundation
b
Estimated FMI 2001-2003, actual Columbus Blue Jackets figures thereafter
c
The health benefits, 401k matches, and workers compensation costs are approximated
d
Commercial, general, liability and property taxes, but not temporary total disability
e
Supplies, information technology, human resources, courier and postage T&E, and bank fees
f
Includes audit, tax, and legal fees
Costs Incurred by Vendors and Other Third Parties
Table 5 presents payments by vendors and other third parties, which totaled approximately $74
million over the 2001-2008 period. The top half of the table presents the estimated $19.8 million in
food and beverage expenditures4 as well as the $2.9 million in non-event related cleaning and
janitorial expenses and $2.5 million in non-event security costs. The bottom of the table lists event-
related costs. Destroyers “NWA Costs” of $4.3 million include marketing, advertising, ticket sales,
7and game presentation. Other Destroyers “Team Costs” have totaled just over half a million dollars
for fiscal years 2004-2008.5 Additional Nationwide Arena event costs are estimated to total almost
$44 million for fiscal years 2001-2008.
Table 5. Vendor/Third Party Payments
Fiscal Years 2001-2008
Category Total
Food and Beveragea $19.8
Cleaning and Janitorial (Non-event)b $2.9
Security (Non-event)b $2.5
Event Costs
Event Costs - NWA onlyc $43.8
Destroyers - NWA Costsd $4.3
Destroyers - Team Costse $0.6
Total $74.0
Notes:
Source: Columbus Blue Jackets
Dollar figures in millions
Figures for FY 2008 projected by CBJ
a
Estimated based on gross sales and 8% net margin
b
Costs not allocated to games and events
c
Estimated for FY2001-2004 and FY2008
d
Marketing, advertising, ticket sales, and game presentation
e
Game day operations, Bombshells and Spirit Team, radio commentators and broadcast fees,
photography, opening night expenditures, and visiting team lodging and transportation expenses.
Concert and Entertainment Events (Non-Hockey, Non-Football)
In addition to the event costs reported above and the spending by fans and patrons at Nationwide
Arena events in nearby establishments reported below, the roughly 40 non-Blue Jackets and non-
Destroyers Arena events per year are estimated to have led to approximately $21 million in local
expenditures since the Arena has been open. These estimated expenditures, reported in Table 6,
include almost $20 million on local advertising and other local goods and services and approximately
$1.2 million in spending by the traveling crews or artists.
8Table 6. Local Spending on other Nationwide Arena Events
Fiscal Years 2001-2008
Family Conventions & Sporting
Spending Category Concertsa Showsb Other Eventsc Eventsd Total
Advertising and local
goods & services $8.6 $4.8 $4.0 $2.4 $19.8
Traveling crew/artists $0.0 $0.2 $0.8 $0.1 $1.2
Total $8.6 $5.0 $4.8 $2.5 $21.0
Notes:
Source: Columbus Blue Jackets
Dollar figures in millions
a
Assuming an average of 18 concerts per year
b
Assuming an average of 6 family shows per year
c
Assuming an average of 10 conventions per year
d
Assuming an average of 6 non-Blue Jackets or Destroyers sporting events per year
Columbus Destroyers
Additional Columbus Destroyers expenditures are presented in Table 7. The Destroyers began
playing in Columbus during fiscal year 2004. Since then, they have added over $19 million in local
expenditures. Approximately a third ($6 million) of those expenditures is attributable to payroll, and
$8.4 million are attributable to cash expenses.
Table 7. Columbus Destroyers Expenditures
Fiscal Years 2004-2008
Category Total
All other cash expenses $8.4
Destroyers payroll $6.0
Trade expenses $3.1
Staff, Game Day, Radio, etc. $1.9
Total $19.3
Notes:
Source: Columbus Destroyers
Dollar figures in millions
Figures for FY 2008 projected by the Columbus Destroyers
Taxes Paid
Table 8 represents over $6 million in local income tax revenue generated by the Blue Jackets and
Destroyers since fiscal year 2002. This total includes a tax on visiting Arena Football and National
Hockey teams, but it does not include those taxes imposed on any other visiting performers. The
vast majority of the taxes have been generated from hockey players. It should be noted, however,
that the Columbus teams also pay local income taxes when they travel to certain other cities.6 Thus,
for a more complete accounting of the net tax revenue generated by the presence of the Blue
Jackets and Destroyers in Columbus, it would be appropriate to subtract the income taxes paid for
away games. Our estimate of the taxes withheld from the Blue Jackets in other jurisdictions in 2007
9is approximately $400,000. Using the same ratio of taxes withheld in other jurisdictions to taxes paid
locally in 2007, it is estimated that the Blue Jackets paid $2.3 in taxes to other jurisdictions over the
2002-2008 period, so an estimate of the net taxes generated is $3.8 million since FY 2002.
Table 8. Local Income Tax Revenue Generated by Sporting Eventsa
Fiscal Years 2002-2008
Category Total
National Hockey Leagueb $5.9
Arena Footballc $0.2
Taxes Paid in other jurisdictions $(2.3)
Net taxes generated $3.8
Notes:
Source: City of Columbus
Dollar figures in millions
a
Includes income taxes on visiting teams
b
FY 2008 figure estimated by using FY 2007 total
c
FY 2007 and 2008 figures estimated by using FY 2006 total
Job Creation
A considerable amount of employment and related local expenditures is created by the existence of
the Blue Jackets and Nationwide Arena. Table 9 reports on the employment created by the Blue
Jackets, Destroyers, and the contractors who work in Nationwide Arena.7 In addition to the payroll of
over $41 million for the contractors, they generated an additional $45 million in local expenditures
between fiscal year 2000 and 2008.
Table 9. Blue Jackets, Destroyers, and Contractor Employment and Expenditures
Fiscal Years 2000-2008
Annual
Personnel Average Contractor Expenditures Total
Full Time 159 Payrolla $41.4
Part Time 972 Local Purchases/expendituresb $27.6
Hockey Players 58 Utilities $12.7
Football Players 29 Commissionc $4.6
City income tax $0.3
Total 1,218 Total $86.6
Volunteers 1,185
Notes:
Source: Columbus Blue Jackets
Dollar figures in millions
th
Years refer to fiscal years ending June 30 except for Delaware North Sports Service, which reports calendar year
figures for everything but “Commission”
Figures for FY 2008 projected by CBJ for SMG and Pritchard. Figures for FY 2008 estimated by using FY 2007 figures
for Columbus Blue Jackets, Contemporary Services Corp., and Delaware North Sports Service.
a
These figures do not include Blue Jackets or Destroyers employees or players, as those figures are reported above.
b
Estimates
c
Amount earned by non-profit agencies due to their volunteer work with the vendors
10Since 2000, an average of 159 full time employees, 972 part time employees, 58 hockey players,
and 29 football players have worked in Nationwide Arena. In addition to this employment, an
average of 1,185 people per year volunteer with Delaware North Sports Service at the concession
stands serving food at games and events. For the non-Blue Jackets and Destroyers employees, this
employment has led to a payroll of over $41 million and related city income taxes of approximately
$300,000.8
The vendors injected into the local economy another $45 million of expenditures. The vendors have
spent almost $13 million in utilities, and it is estimated that they have made over $27 million in local
purchases. Further, the vendor sales have led to approximately $4.6 million earned by non-profit
agencies due to a percentage of sales they received for their volunteer work for the vendors.9
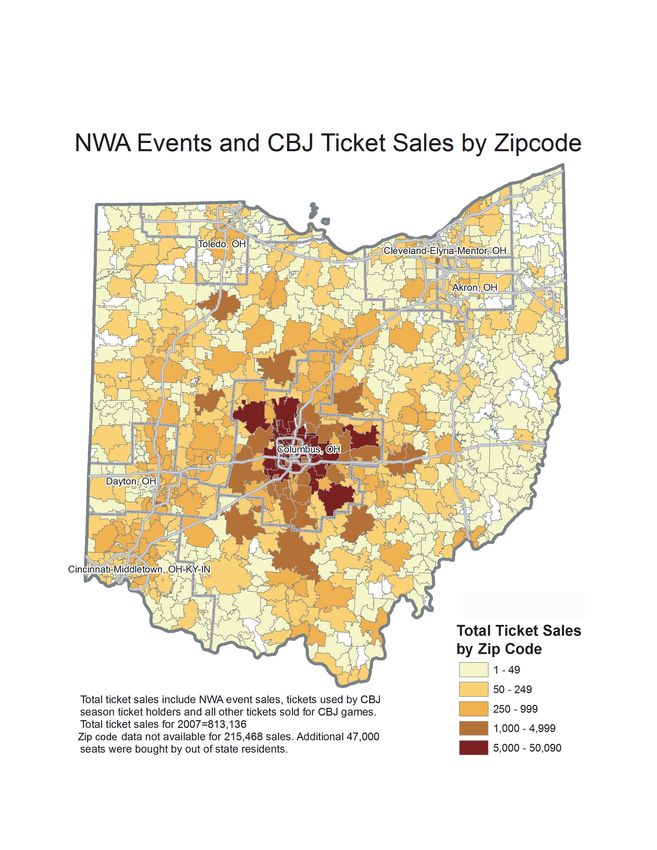
Geographic Draw of the Fan Base
Patrons and fans attending events and games at Nationwide Arena also add to the economic impact.
This impact on the local community can be seen by looking at a map of attendees. Figure 2 displays
the Zip code location in Ohio of 813,136 game and event attendees in 2007.10 As the map
indicates, many of the attendees are from central Ohio, but the draw to Columbus for events extends
well beyond the City of Columbus. Attendees from outside central Ohio are particularly beneficial for
the local economy, as their spending can be considered to be new spending in the local economy
rather than a substitution from other local expenditures. Table 10 lists the top ten Zip codes outside
of the Columbus Metropolitan Statistical Area (MSA) for ticket sales for all events in Nationwide
Arena in 2007, including Blue Jackets games, and season ticket holders. The first two columns of
the table list the top ten Zips outside the MSA in terms of ticket sales, led by 3,544 sales in Zip
43701, Zanesville, OH. Zanesville is approximately a one-hour drive from Columbus. The last two
columns of Table 10 show the top ten Zips for season ticket holders outside of the Columbus MSA.
The top Zip is 44147, Broadview Heights, OH, which is near Cleveland and is approximately a two
hour drive from Columbus.11
Since the arena opened in 2000, we estimate that $159.6 million has been spent by visitors to
Columbus on hotels and restaurants. These estimates are based on the event attendees for whom
we have Zip code location information in 2007 and actual ticket sales data from fiscal years 2001
through 2008 (displayed in Figure 3 below). We also assume that the geographic origin of visitors in
all years is the same as in 2007. The spending figures come from the Greater Columbus Sports
Commission, who estimate that overnight guests spend and average of $186.08 per day on hotels
($149.84) and restaurants ($36.24).12 We do not include spending by local ticket buyers in our
estimate.
11Figure 2. Nationwide Events and Blue Jackets Sales by Zip Code in 2007
12Table 10. Nationwide and CBJ Ticket Sales and Season Ticket Holders
Top Ten Zip Codes for Ticket Buyers from Outside the Columbus MSA
2007
Nationwide Events and Blue Jackets Blue Jackets Season Ticket Holders
ZIP Tickets ZIP Seats
43701 Zanesville 3,544 44147 Broadview Heights 763
45601 Chillicothe 3,532 43302 Marion 723
43302 Marion 3,309 43311 Bellefontaine 433
43050 Mount Vernon 2,405 43701 Zanesville 427
43311 Bellefontaine 1,568 45601 Chillicothe 395
43160 Washington Court House 1,471 45459 Dayton 390
43138 Logan 1,349 43011 Centerburg 367
45840 Findlay 1,263 43050 Mount Vernon 366
44147 Broadview Heights 1,205 45840 Findlay 332
45459 Dayton 1,034 44114 Cleveland 308
Figure 3. Tickets Sold at Nationwide Arena Events
Fiscal Years 2001-2008
The Role of the Blue Jackets and Nationwide Arena in Building a Sense of Community among
Central Ohioans
While economic indicators of sport are important, it is equally important to recognize that sport
produce significant non-economic benefits. Sport sociologists and others interested in studying the
13social and emotional benefits of sport have, for some time, recognized the importance of non-
economic indicators to a community. By focusing on the memories and emotions of fans of the
Columbus Blue Jackets, the study attempted to identify the socio-emotional impact of the franchise
on the central Ohio community. Figure 4 summarizes results from a survey of 222 adult fans at the
March 7, 2008, Blue Jackets home game against the Edmonton Oilers. While the survey was non-
random (respondents self-selected), the demographic composition of respondents is similar to that
reported by Blue Jackets market analysis of game attendees.
Figure 4. Blue Jackets Fan Involvement and Community Connection
Important findings of the study included the following:
• Over 90% of respondents were proud of Columbus for having a NHL team.
• 86% believed that the team is bringing “the hockey community of Columbus together.”
• 78% believed that the “Blue Jackets give the rest of the country the idea that Columbus is a
big time city.”
• Being a Blue Jackets fan is an important part of the identity of respondents. Nearly 70% of
the respondents indicated that “Being a hockey fan is an important part of who I am” and also
nearly 70% “…typically organize my day so I can attend or watch hockey.”
• Memories of Blue Jackets games also help build a sense of community identity, as 77% of the
respondents indicated that memories of the Blue Jackets involved family and friends.
• There is clear evidence of the emotional connection between hockey fans and the community.
• The Blue Jackets help create a sense of community. 45% of respondents indicated that they
have “taken an interest in community events through their participation as a Blue Jackets fan.”
• A majority of respondents experienced “joy,” “excitement,” “pride,” and “energy,” as CBJ fans.
Of the negative emotional items, only “frustration” received a majority of responses, and about
a third of the respondents indicated that they felt “tension.”
14• 96% of the fans experience with very or moderately intense emotions. These data indicate
that the CBJ are delivering an emotionally absorbing entertainment experience.
• Nearly 85% of the respondents find their hockey experience “Somewhat” or “Very Satisfying.”
• Respondents were familiar with the community involvement activities of the Columbus Blue
Jackets. A slight majority of the respondents were familiar with each of the programs, and
only 18% were unfamiliar with any of the programs.
• Descriptive terms used by respondents to the survey included such terms as heroic
efforts/action; bonds with family, friends, teammates or players; positive self-
discovery/esteem; and overcoming obstacles, pain, frustration.
Charitable Contributions from the Blue Jackets Foundation
The Blue Jackets have also had an important impact on the community through their charitable
giving through the Blue Jackets Foundation, which is focused on pediatric cancer. Two signature
projects are the Family Resource Center at Nationwide Children’s Hospital and Hats for Heroes.
Between fiscal years 2002 and 2006 (the last year for which data are publicly available), the
Foundation has made grants to 28 different non-profit organizations and participated in 17 different
hockey development initiatives in Central Ohio. Over the five years, over $1 million has been
donated to programs through grants and donations. The Foundation has incurred costs of almost
$300,000 over that same period, so total Foundation expenditures for the five years totaled
approximately $1.3 million.
Contributions of the City of Columbus to the Arena
Between 1998 and 2000, the City of Columbus expended resources to development of Nationwide
Arena. Based upon estimates from the City Auditor, the City’s contribution to the Arena District will
total $67.8 million in terms of environmental, demolition and interest costs applicable to City
ownership of the land prior to its sale to Nationwide ($7.9 million); infrastructure costs related to
streets, inspection fees and traffic study related to the Arena District ($18.2 million); infrastructure
costs related to Neil Avenue, Neil Avenue Bridge, and Convention Center Drive ($25.5 million); and
interest on infrastructure related bonds ($16.2 million). The City is projected to recover $31.8 million
from tax payments made as part of the Tax Increment Financing agreement, leaving a net cost to the
City of $36 million. Not reported are additional City taxes that have been abated.
Concluding Comments
As noted earlier, it is clear from this analysis that the Columbus Blue Jackets and Nationwide Arena
have important economic and social impacts on central Ohio. Beyond the millions of dollars that are
now being spent in a completely revitalized neighborhood just north of downtown, the Blue Jackets
are considered by their fans to be an important community asset that enhances their perceptions of
their hometown. Nationwide Arena and the surrounding area have also become a prime destination
for visitors to Columbus.
15Notes
1
This study does not attempt to conduct the type of economic impact analysis that addresses such challenging and
sometimes controversial economic issues as assessment of aggregate consumer demand, analysis of fractional regional
income, diversion of jobs from other sectors, opportunity costs, and contingent valuation of public goods.
2
The $3.3 million in travel-related expenditures of visiting teams in Columbus (lodging, ground transportation, and per
diem) is estimated based upon the Blue Jackets’ expenditures in other cities. There is little reason to believe that the
expenditures in Columbus would be much different than what the Blue Jackets spend in other cities.
3
In 2001, the team paid $1.8 million to charter flights. After that first season, the team purchased its own aircraft. The
expenses listed in Table 2 represent the actual aircraft expenses for 2002 and 2003, including the payroll for five
employees, and represent estimated expenditures after that.
4
These are the estimated (by the CBJ Chief Financial Officer) wholesale costs of the food, beverages, and other
supplies purchased by Nationwide Arena vendors. Estimates are based on gross sales figures and an 8% margin.
5
These costs include game day operations, the Bombshells and Spirit Team, radio commentators and broadcast fees,
photography, opening night expenditures, and visiting team lodging and transportation expenses.
6
State taxes in AR, CA, CO, IL, MA, MI, MN, MO, NY and city taxes in Detroit and St. Louis.
7
These contractors include Contemporary Services Corporation, which provides security, Delaware North Sports
Service, which serves as the food vendor, SMG, which manages Nationwide Arena, and ARAMARK and Pritchard Sports
and Entertainment Group, which have provided housekeeping services.
8
Income tax figures are only for Contemporary Services Corp. and Delaware North Sports Service.
9
Listed as “commission” in Table 9.
10
These locations are taken from the Zip codes of people who purchased their tickets using credit cards. Thus, the
locations of 215,468 sales are not available because purchases were not made using credit cards or because their
address information was missing. Another 47,000 attendees came from outside Ohio.
11
Zip code data were not available for 14 season ticket holders (who accounted for 361 seats in 2007). Additionally, 206
season ticket plans were held by out-of-state fans who accounted for 3,863 seats in 2007.
12
Note that we are counting the spending for all of the patrons and fans who are from out of town, regardless of whether
or not the event or game was the primary purpose for visiting Columbus. Based on suggestions from the vice president
of economic analysis at the Columbus Chamber, we estimate that travelers coming from at least 100 miles away from
Columbus or from outside Ohio stay overnight in a hotel and eat at a local restaurant. For travelers who reside in Zip
codes between 75 and 100 miles from Nationwide Arena, we estimate that two-thirds will stay overnight and one-third will
eat at a local restaurant but not stay overnight. We estimate that attendees who live outside the six county Columbus
Metropolitan Statistical Area but within 74 miles of the MSA spend money at restaurants in conjunction with their
attendance at an event but do not stay overnight.
16You can also read