NHS financial temperature check - Briefing
←
→
Page content transcription
If your browser does not render page correctly, please read the page content below
July 2015

NHS financial
temperature check
Finance directors’ views on financial
challenges facing the NHS

                                        Briefing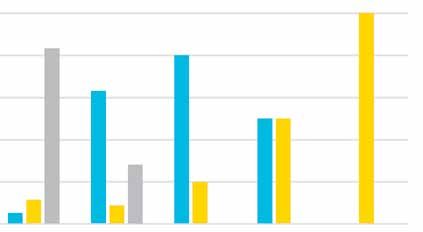
Contents

   Introduction                                            2
                                                                   Introduction
   Key findings                                            2
                                                                   This is the third in a series of HFMA briefings setting
   Financial performance                                   3       out finance directors’ views on financial issues facing
                                                                   the NHS. Directors completed the survey during the
   Quality                                                 8
                                                                   last two weeks of May 2015. It draws on the responses
   What is the outlook?                                    9       of finance directors and chief finance officers1 (CFOs)
                                                                   of 117 (47%) provider trusts and 79 (37%) clinical
   Conclusion                                            12        commissioning groups (CCGs) from across the English
                                                                   NHS. It also includes the views of five of the seven
                                                                   (71%) Northern Ireland finance directors, four of the
                                                                   nine (44%) Welsh finance directors and two of the 15
                                                                   (13%) Scottish finance directors.

                                               Key findings                              finance directors (59%), 42% of CCG
                                               The 2015/16 financial performance         CFOs, 60% of CFOs in Northern
                                               of the NHS in England continues to        Ireland and 50% of CFOs in Wales
                                               deteriorate across all sectors. Acute     told us they had made significant
                                               trusts represent the majority of the      changes to their 2015/16 financial
                                               deficit. There is a deficit overall in    plan from what was originally
                                               local NHS organisations and the           expected 12 months ago.
                                               small underspend of £151m across             In 2015/16 there is a clear
                                               the 211 CCGs does not cover the           distinction between the number of
                                               net deficit of £822m in the English       English trusts (63%), which are
                                               provider trust sector. Financial plans    forecasting a deficit, and the
                                               for 2015/16 show a similar position.      number of CCGs (83%), which are
                                               NHS foundation trusts (FTs) reported      forecasting a surplus. While the
                                               a £349m deficit for the year-ending       percentages look similar, as in
                                               31 March 2015, compared with              2014/15 the CCG forecast net surplus
                                               a planned net deficit of £10m2.           is unlikely to be sufficient to cover the
                                               The NHS trust sector reported an          net deficit in trusts.
                                               aggregate net deficit of £473m,              Fewer than 20% of CCG and 10%
                                               compared with a planned net deficit       of trust finance directors think there
                                               of £408m3.                                is a low risk to achieving their
                                                                                         financial plans for 2015/16.
                                               Analysis of our survey shows:             Finance directors are even less
                                                                                         confident about achieving their
                                                  Respondents in the majority of         financial plans in 2016/17.
                                               CCGs reported that 2014/15                   The key risks identified to
                                               year-end outturn was the same or          organisations’ and health economies’
1 CCGs use the terminology of chief finance
  officer (CFO), whereas NHS trusts and        better than budget. But in the majority   financial plans are slippage in cost
  FTs generally use finance director. In       of English provider trusts and Welsh      savings, increased demand and
  this briefing we sometimes use the term
  finance director to mean both finance        trusts and local health boards (LHBs)     particularly increased emergency
  directors and CFOs together, when            it was worse.                             activity.
  describing the views of all of our survey
  respondents collectively                        In trusts the main drivers for this       66% of UK finance directors think
2 Performance of the foundation trust sector   were an increase in agency staff          quality will be maintained in 2015/16,
  year ended 31 March 2015, May 2015,          costs (72%) and under-achievement         26% think quality will improve, while
  Monitor
3 NHS TDA Board meeting, 21 May 2015
                                               of planned savings (55%). CCG             7% think quality will reduce.
  Paper D: NHS Trust Service and Financial     CFOs considered the main drivers of          Respondents felt that within their
  Performance Report www.ntda.nhs.uk/wp-
  content/uploads/2015/03/Paper-D-Service-
                                               variances to be acute contract            organisation they probably have
  and-Financial-Performance-Report-for-        programme cost increases (66%) or         sufficient levers to improve quality
  March-2015.pdf for the period ending 31
  March 2015
                                               slippage on planned savings (53%).        and financial performance, with the
                                                  More than half of English trust        exception of Northern Ireland.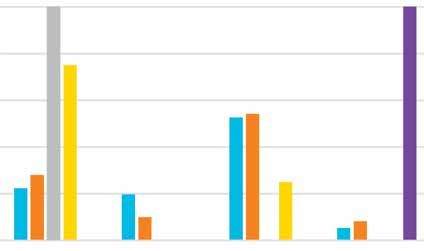
3

There is less confidence, however,         the combined net deficit of £822m in
when asked whether they have               the English provider sector, £599m
sufficient levers to effect change in      is attributable to 54 acute FTs and
their local areas.                         £536m to 36 acute NHS trusts. The
   Finance directors gave mixed            aggregate acute sector deficit of
responses about whether they expect        £1,135m is offset by surpluses in the
to see structural reconfiguration in the   non-acute sector.
next 12 months, suggesting
reconfiguration will take place based      However, there are 27 non-acute FTs
on local circumstances.                    and NHS trusts in deficit in 2014/15
   The majority of finance directors       compared with 6 in 2013/14, showing
responding to our survey do not            that 2014/15 has been a challenging
believe the organisations in their area    year across all sectors.
have sufficient resources to support
their long-term financial plans.           Regionally there is little difference,
                                           except in London, where there are
Financial performance                      proportionally fewer trusts in deficit.
The financial performance of the NHS       However, this masks the difference
in England continues to deteriorate        between the largely financially
across all sectors. There is a deficit     sustainable FTs in inner London and
overall in local NHS organisations         the outer London NHS trusts that are
and the small underspend in CCGs           struggling to balance their books.
does not cover the net deficit in the
English provider trust sector.             In the local commissioning sector,
                                           NHS England reports that CCGs have
The most recent reports from national      underspent allocation by £151m in
agencies and regulators show:              aggregate, but it was not split evenly
                                           across the country7. According to
   NHS FTs reported a £349m                NHS England, the underspend in
deficit for the year ending 31 March       CCGs includes £156m of planned
2015, compared with a planned net          spending on continuing healthcare
deficit of £10m4. 77 of the 152 (51%)      claims that was to be made in
FTs reported a deficit5. Acute trusts      2014/15 that has been moved to
represent the majority of the deficit      future years, and payments to
but FTs in every sector reported           CCGs under the Quality Premium
a deficit.                                 scheme that were £66m lower
   The NHS trust sector reported an        than planned.
aggregate net deficit of £473m,
compared with a planned net deficit of     Excluding these non-recurrent
£408m6. A total of 40 of the               benefits, there was a small net
99 (40%) NHS trusts reported a             overspend within the CCG sector.
deficit, with a combined gross             For 2015/16, NHS England plans
deficit of £614m.                          to draw down £400m of prior
   Across the 211 CCGs, there was a        year surpluses in addition to the
small underspend of £151m7                 announced 2015/16 allocations,
(0.2% of allocation). According to         plus £179m of expenditure deferred
NHS England, ‘this position benefited      from the final quarter of 2014/15.        4 Performance of the foundation trust sector
from significant one-off items that                                                     Year ended 31 March 2015, May 2015,
                                                                                        Monitor
have materially contributed to the         The financial position of the NHS in
                                                                                     5 Year-to-date, unaudited, financial
underspend. Excluding these items,         the devolved nations has not been            information
there was a small net overspend            reported publically yet.                  6 NHS TDA Board meeting, 21 May 2015
within the CCG sector’.                                                                Paper D: NHS Trust Service and Financial
                                                                                       Performance Report www.ntda.nhs.uk/wp-
                                           Performance against plan                    content/uploads/2015/03/Paper-D-Service-
The outturn figures reported by            Analysis of our survey responses            and-Financial-Performance-Report-for-
                                                                                       March-2015.pdf for the period ending 31
NHS England, Monitor and the Trust         found that in most CCGs the 2014/15         March 2015
Development Authority (TDA) make it        year-end outturn was the same or          7 NHS England Board Paper PB.150528/06,
clear that there is financial pressure     better than budget. In the majority          May 2015 www.england.nhs.uk/wp-
                                                                                        content/uploads/2015/05/item7-board-
across the NHS. The most severe            of English provider trusts and Welsh         280515-upd.pdf
deficits are in the acute sector. Of       trusts and LHBs it was worse.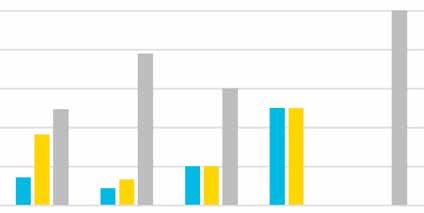
4 NHS Financial Temperature Check
Chart 1: 2014/15 year-end outturn compared with the 2014/15 budget More than 50% of finance directors
in these organisations reported a
n better n same n worse worse year-end position than was
60 planned, as shown in Chart 1.
50
We asked respondents to cite causes
% of finance directors
40 for the main variances between
outturn and plan in 2014/15. Among
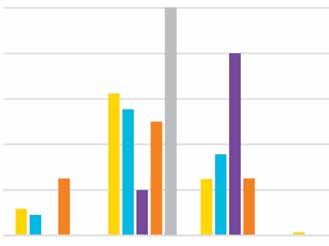
30 trusts, the main drivers were a
rise in agency staff costs (72%), in
20
many cases driven by Care Quality
10 Commission recommendations,
and underachievement of planned
0
CCG Trust Health and Local health Territorial savings (55%), leading to adverse
(England) (England) social care trust board board performance against plan.
(Northern Ireland) (Wales) (Scotland)
Some trusts improved their
performance against plan. The main
drivers for this include increased
Chart 2: Main variances between 2014/15 outturn and plan in trusts activity and other non-recurrent
items, such as TDA funding, which
80 make it important to understand the
70 underlying financial position as well
as the reported position. Chart 2
60 summarises the main responses.
% of finance directors
50
The reasons remain consistent with
40
our previous surveys. In December
30 2014 we found: ‘Over 40% of provider
trust finance directors reported the
20
main drivers of the worsening year-
10 end financial forecast are unforeseen
0
increases in pay costs, allied with
lower than expected savings from
Rise in Underachievem’t Increase Increase in Increase in Increase in
cost improvement plans’8. The
agency of savings in turnover non-pay clinician other pay
costs plans costs pay costs costs proportion of finance directors
reporting these cost pressures has
increased since December 2014.
While most CCGs achieved or
Chart 3: Main variances between 2014/15 outturn and plan in CCGs
improved on planned performance,
CFOs considered the main drivers of
70
variances to be programme cost rises
60
% of finance directors
(66%) or slippage on planned savings
50
(53%). CFOs also identified growth in
40
continuing care claims and contract
30 overperformance by provider trusts
20 in all sectors as additional costs.
10 Chart 3 summarises the responses.
0
Increase in Underachievement Increase in Increase in
These are consistent with our
programme costs of savings plans prescribing costs allocation
on acute contracts survey in December 2014 but the
proportion of CFOs reporting these
cost pressures has increased. In our
previous survey, the figure was 35%
8 NHS Financial Temperature Check for both drivers.
Results, December 2014, HFMA
www.hfma.org.uk/nhstemperaturecheck/
dec14/December 2014 The most common response from
CFOs in Wales and Northern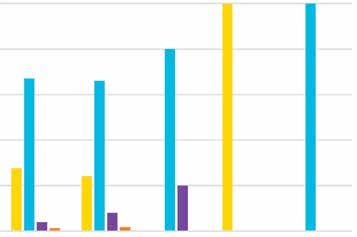
5

  Table 1: Proportion of organisations’ contracts signed by CFOs

                      Were all contracts signed by                            Were all contracts signed by
                       date of survey response?                                    31 March 2015?
                          No               Yes                                   No                Yes
  CCG                    68%              32%                                   93%                7%
  Trust                  58%              42%                                   90%               10%

Ireland was underachievement of            Chart 4: Forecast 2015/16 year-end financial position
savings plans. In Scotland, the two
                                                                                                                 n deficit   n break even       n surplus
respondents both highlighted an
increase in prescribing costs.
                                                                 100

Contracts and financial plans
The majority of contracts between                                    80
commissioners and providers in the
                                            % of finance directors

English NHS remained unsigned at
                                                                     60
the time of our survey, as shown in
Table 1. Some respondents told us
that contracts had been agreed but                                   40
simply not signed. Other reasons
for not signing contracts included
                                                                     20
disputes about activity levels, leading
to formal arbitration, or with agreeing
local tariff arrangements.                                           0
                                                                            CCG       Trust           Health and      Local health           Territorial
In the majority of cases organisations’                                   (England) (England)       social care trust    board                board
                                                                          			                      (Northern Ireland)   (Wales)             (Scotland)
financial plans have been submitted
to their regulator or national agency.
91% of CCG CFOs and 85% of trust          forecasting a surplus in their plans,
finance directors told us they had        as shown in Chart 4. Some 63%
submitted their plans, with similar       of English trusts are forecasting a
levels in the devolved nations. This      deficit at the 2015/16 year-end. The
does not mean the plans have been         responses for the 2016/17 financial
approved however. In our December         year show more trusts forecasting a
2014 survey we found that one in five     surplus but the distinction between
trust finance directors told us they      the financial position of CCGs and
had been asked to submit a revised        trusts remains clear cut.
forecast by their regulator (either
Monitor for FTs or the TDA for NHS      Among CCG survey respondents,
trusts), demonstrating the scrutiny     83% forecast a surplus, but it is
applied by regulators.                  important to understand the business
                                        rules they are required to comply
Almost all organisations revised their with. CCGs are required by NHS
2015/16 financial plan from what was England’s financial planning business
originally expected 12 months ago.      rules to make a minimum surplus
More than half of English trust finance equal to either 1% of allocation or
directors (59%), 42% of CCG CFOs,       the 2014/15 surplus, less any agreed
60% of CFOs in Northern Ireland and drawdown, whichever is the greater9.
50% of CFOs in Wales told us they       However, in the large majority of
had made significant changes.           cases the surplus is brought forward
                                        from the prior year, not generated
In 2015/16 there is a clear trend       in-year. If CCGs reported on the
showing that, of our survey             same basis as provider trusts, the                                    9 Supplementary information for
                                                                                                                commissioner planning, 2015/16,
respondents, English trusts are         large majority of CCGs would show a                                     NHS England
forecasting a deficit and CCGs are      break-even position.
6 NHS Financial Temperature Check
CCGs are not permitted to spend the surplus in CCGs is not cash-
brought forward resources without backed and so is unavailable for
a specific business case and spending. CCGs are only allowed to
approval from NHS England. submit a deficit plan in unavoidable
The business rules applying to circumstances, as determined by
CCGs mean that in many cases NHS England. However, after taking
these differences into account, the
Table 2: Analysis of forecast 2015/16 financial position by sector CCG sector would still appear to be
in better financial health than the
provider sector.
Sector Deficit Break-even Surplus
Acute 77% 9% 14% The forecast improvement in trusts’
Acute and 85% 0% 15% financial performance in 2016/17 may
community be attributable to finance directors’
expectations that financial recovery
Acute and 81% 8% 12%
plans will address financial difficulties
specialist
brought forward from 2014/15. But
Ambulance 33% 33% 33% trusts will often revise their medium-
Community 0% 0% 100% term financial plans closer to the
Community and 29% 21% 50% beginning of the actual financial year.
mental health
Most English trusts reporting a
Mental health 43% 0% 57% deficit are in the acute sector, while
Specialist 50% 25% 25% community trusts are relatively
financially sustainable, based on
our survey responses. Table 2
Table 3: Analysis of 2014/15 reported outturn by sector summarises the responses. For
(combined figures for NHS trusts and FTs) comparison, the reported outturn for
2014/15 is summarised in Table 3
Sector Deficit Break-even/ surplus showing an increase in the proportion
of forecast deficits across every
Acute (including specialist) 59% 41%
sector, apart from community.
Ambulance 20% 80%
Community 14% 86% In all sectors except the Welsh
Mental health 28% 72% NHS, most respondents told us their
organisation’s forecast 2015/16
Source: HFMA analysis of Monitor and TDA figures
year-end position is worse than the
2014/15 year-end position. Chart 5
Chart 5: Is the 2015/16 year-end forecast position better, the same or summarises the responses. Some
worse when compared with the 2014/15 year-end financial position? 78% of provider trust finance directors
and 50% of CCG CFOs forecast a
n better n same n worse worse financial position at the end of
2015/16 than their 2014/15 outturn.
100
Most respondents reported the
80 degree of risk associated with
% of finance directors
achieving their organisation’s 2015/16
60 financial plan as high or medium,
as in Chart 6. In England, only 16%
of CCG and 10% of trust finance
40
directors reported there being a low
risk to achieving their financial plans.
20 The key risks to achieving financial
plans were identified as:
0
CCG Trust Health and Local health Territorial Slippages in cost savings (74%)
(England) (England) social care trust board board Increased demand (64%)
(Northern Ireland) (Wales) (Scotland) Emergency activity (55%)
Spending on agency staff (50%).
7

The perceived risk to achieving               Chart 6: Finance directors’ estimated degree of risk to achieving their
financial plans increases for 2016/17,        organisations’ 2015/16 financial plans
with the majority of respondents                                                                                                     n low     n medium     n high
reporting having plans with a high
level of risk. We asked respondents                                        100
to identify the main risks to the overall
                                                                               80
financial stability of their health

                                                      % of finance directors
economy. They were:
                                                                               60

  Increasing demand (76%)
                                                                               40
  Increasing emergency care
  activity (65%)                                                               20
  Slippage on cost saving
  schemes (54%)                                                                    0
  The impact of social care financial                                                    CCG       Trust                Health and           Local health     Territorial
  constraints – for example, delayed                                                   (England) (England)            social care trust         board          board
  transfers of care (49%)                                                              			                           (Northern Ireland)        (Wales)       (Scotland)
  Integration (46%).

We also asked respondents about the              Chart 7: The main mechanisms CCGs are planning to meet the
achievability of their organisations’            financial challenges ahead
2015/16 financial savings plans.
Unsurprisingly, respondents were                                         80
more confident about achieving the
non-recurrent elements of their plans                                    60
rather that the recurrent savings.
                                            % of finance directors

Some 69% of CCG CFOs and 72%                                             40
of trust finance directors are very or
quite confident their organisation’s
                                                                         20
2015/16 non-recurrent savings plans
will be achieved. Respondents in
Scotland feel it is too early to say and                                       0
there is a mix of views in Wales and                                           Integration/     Increased    Investing in    Investment      Redesigning     Reducing
                                                                               redesigning     integration    community       in primary      pathways      unnecessary
Northern Ireland.                                                               pathways         bt health     services          care        within acute      clinical
                                                                                  across       and social    (eg to avoid                       sector        variation
There is less confidence about                                                 community/        care/BCF      hospital
achieving the recurrent elements of                                             MH/acute         schemes     admissions)
savings plans. CCGs CFOs have
greatest confidence, with 46% feeling
very or quite confident – slightly               Chart 8: The main mechanisms trusts are planning to meet the
higher than trusts, at 39%.                      financial challenges ahead
                                                                     100
We asked finance directors about
the main mechanisms they plan on
using to meet the financial challenges                                   80
ahead. CCGs are planning
                                            % of finance directors

integration of services with other NHS                                   60
organisations (80%), integration with
social care (76%) and investment in                                      40
primary care (68%). The responses
are summarised in Chart 7.
                                                                         20
To meet trusts’ financial challenges,
finance directors plan to make                                                 0
savings on agency staff (87%) and                                               Reducing      Procurement     Reducing         Estates       Integration/   Redesigning
                                                                                pay costs     cost savings   unnecessary     rationalis’n    redesigning     jobs to cut
procurement costs (81%) and by                                                  spent on                        clinical                      MH/acute/      the cost of
reducing unnecessary clinical variation                                        agency staff                    variation                     community/     non-clinical
(60%). Chart 8 shows the responses.                                                                                                           pathways       headcount
Respondents from Northern Ireland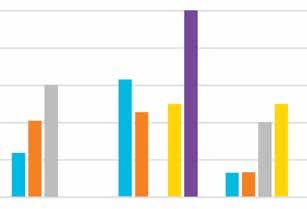
8 NHS Financial Temperature Check
are primarily planning redesigned joint working. Some CCG CFOs feel
acute pathways (80%), procurement they have limited influence on the
savings (60%) and agency cost cost of unplanned demand in provider
savings (60%) to meet financial organisations. Some also feel that
challenges. In Wales, respondents provider trusts can become financially
are planning clinical standardisation challenged as a result of conflicting
(100%), investing in community priorities. For instance, national policy
services (75%), integration (75%), changes issued after local plans have
acute sector pathway redesign (75%), been agreed have caused uncertainty
and agency staff cost reduction (75%). in health economies.
Most finance directors agreed Respondents also identified barriers
that their organisation’s stability to finding local solutions due to a
depends on working jointly with perceived lack of a coordinated
other organisations, as summarised approach to system management and
in Chart 9. Respondents provided sustainability by different regulators.
additional details about barriers to
Some provider trust finance directors
feel the scale of their funding can
Chart 9: Assessment by directors of whether their organisation’s determine the success, or otherwise,
stability depends upon working jointly with other organisations of their attempts to influence decision-
making in their health economy –
100 n CCG (England) they cannot effect change unless they
90 n Trust (England) are the largest organisation.
n Health and social
80 care trust (Northern Trust finance directors agreed with
% of finance directors
70 Ireland) their CCG counterparts that the lack
n Local health board of a single voice across the system
60 (Wales)
from regulators has a direct impact on
50 n Territorial board
local reconfiguration. Respondents
(Scotland)
40 recognised that improvement to
services requires joint working and
30
collaboration. However, the size of
20 deficits in some acute trusts can lead
finance directors to make decisions
10
that prioritise the interest of their
0 organisations above those of the
Yes No Don’t know
health economy, to avoid jeopardising
their own financial positions. One
Chart 10: Anticipated change in quality of patient services in 2015/16 respondent suggested the solution is
CCGs and trusts ‘breaking the rules
100 together’ to work more innovatively
n quality will
and address financial problems at
improve
health economy level.
n quality will
80 stay the same
n quality will
Quality
reduce Despite being pessimistic about the
% of finance directors
60 financial position of the NHS for the
n don’t know
current and future years, 92% of all
finance directors do not expect the
40
quality of services to deteriorate.
Some 66% think that quality will stay
20 the same and 26% think that it will
improve. Responses for each sector
are summarised in Chart 10.
0
CCG Trust Health and Local health Territorial
(England) (England) social care trust board board
This is consistent with the results
(Northern Ireland) (Wales) (Scotland) of our two previous surveys in June
2014 and December 2014.
9

But fewer finance directors now think      to improve quality and financial
quality will increase. At the same         performance – except Northern
point last year, 39% of respondents        Ireland, as shown in Chart 11.
thought that quality would increase,       Finance directors are much less
compared with 26% in our current           confident about whether they have
survey. No respondents in Northern         sufficient levers to effect change
Ireland expect quality to improve,         in their local areas though – Chart
while in Wales all respondents are         12. There is an overall view that
expecting improvements. Overall 7%         there is a weakness in strategic
of finance directors expect quality to     system management, which echoes
deteriorate in 2015/16.                    findings from our previous surveys.
                                           Some respondents felt there are
While the majority of finance directors    multiple strategic influences in the
did not expect quality to deteriorate      system, which increases the risk that
in their organisations, we asked           organisations feel the need to work
them to identify which aspects of          in silos. The regulatory regimes for
service quality generally are most         CCGs and providers can also conflict.
vulnerable as a result of the current
financial challenges. Respondents
felt waiting times (60%), access to         Chart 11: Do you feel you have sufficient levers to effect change that
services (57%), the range of services       could improve quality and financial sustainability in your organisation?
offered (43%) and the interface
between NHS care and local authority                                     100
                                                                                                                                 n CCG (England)
provided social care (40%) were
                                                                                                                                 n Trust (England)
most vulnerable. This was consistent
                                                                         80                                                      n Health and
across the sectors.                                                                                                              social care trust
                                                                                                                                 (Northern Ireland)
                                                % of finance directors

We asked finance directors what                                                                                                  n Local
                                                                         60
changes they anticipate in the quality                                                                                           health board
of patient services commissioned                                                                                                 (Wales)
or provided by their organisations                                       40                                                      n Territorial board
in 2016/17. In total, 84% felt quality                                                                                           (Scotland)
would stay the same or improve,
4% were not sure at this stage and                                       20
12% felt quality would reduce.

Finance directors reported that it                                        0
                                                                               Yes definitely   Yes probably   No   Don’t know
was increasingly challenging to
prioritise access to services and
service performance while maintaining
financial stability.                        Chart 12: Do you feel you have sufficient levers to effect change that
                                            could improve quality and financial sustainability in your local area?
One said: ‘Patient safety and access
                                                                     100
to services is not negotiable, so                                                                                                n CCG (England)
pressure on finances is getting worse                                                                                            n Trust (England)
rather than taking alternative courses                                   80                                                      n Health and
of action. Pressure on finances longer                                                                                           social care trust
                                            % of finance directors

                                                                                                                                 (Northern Ireland)
term will have a detrimental impact
                                                                                                                                 n Local
on the quality and safety of services                                    60
                                                                                                                                 health board
provided.’                                                                                                                       (Wales)
                                                                                                                                 n Territorial board
What is the outlook?                                                     40
                                                                                                                                 (Scotland)
Finally, we asked respondents about
their outlook for their organisations
                                                                         20
and local health economies.

Improving quality/financial stability                                     0
Respondents said they probably had                                             Yes definitely   Yes probably   No   Don’t know
sufficient levers in their organisations
10 NHS Financial Temperature Check
Some CCG respondents felt that, sustainability in their local area.
despite having enough levers, Northern Ireland respondents said
national and local guidance can fixed pay scales for medical staff,
conflict, which can remove their nursing staff and fixed staffing
ability to do things differently. For numbers generally are a key element
instance, the national payment of system-wide cost, making it hard to
system can provide disincentives influence financial performance.
for organisations to work together.
One trust finance director felt CCGs Respondents in Wales feel they have
do not have the levers necessary to sufficient levers but do not have
implement plans and that Monitor enough clarity about how service
protects the foundation trust sector reconfiguration will be funded.
from system change.
Long-term plans and policy
Our survey found that only 4% of Most finance director respondents
respondents from CCGs felt they do not believe the organisations in
definitely have mechanisms to their area have sufficient resources
improve the quality and financial to support their long-term financial
plans, particularly in England (92%)
and Northern Ireland (80%) – Chart
Chart 13: Do organisations in your area have enough baseline financial 13. The picture in Scotland was
resources to implement the Five-year forward view or other long-term different – both respondents believe
financial plans without the need for additional support? they have enough resources.
100 n CCG (England)
The key financial challenge is a lack
n Trust (England)
of pump-priming investment funds
80 n Health and social
and that all extra funds are already
care trust (Northern
Ireland) committed to the better care fund
% of finance directors
60 n Local health board (BCF) in England. Some respondents
(Wales) felt the senior management capacity
n Territorial board committed to the BCF would also
40 (Scotland) affect their ability to deliver long-
term financial plans. Respondents
20 also highlighted problems with their
organisations’ funding allocations.
0 Finance directors expressed concern
Yes No Don’t know
about the timing of the £8bn promised
by the government and whether it
Chart 14: Do you support the integration of health and social care in would be enough to meet demand
the format envisaged under the ‘devo Manc’ proposals in England? and new quality initiatives, such as
seven-day services.
n CCG (England)
100
n Trust (England) A major policy development in the
n Health and social care trust (NI) English NHS has been proposals for
80 n Local health board (Wales) integrating health and social care in
n Territorial board (Scotland) the Manchester area – ‘devo Manc’.
Welsh and Northern Irish respondents
% of finance directors
60 generally supported this, English
respondents less so – Chart 14.
40
Specific concerns about the
proposals include possible additional
20 bureaucracy and local politics,
especially where organisations are
not co-terminous. There are also
0 concerns about whether budgets are
Yes No Too early to say Don’t know held in the NHS or transferred to local
authorities and whether the priorities11
of NHS organisations and local Chart 15: Do you expect structural reconfiguration of organisations in
authorities are sufficiently aligned. your area in the next 12 months?
Many respondents are simply waiting
to see whether the changes in 100 n CCG (England)
Manchester are successful or not.
n Trust (England)
80 n Health and social
Alongside integration of health and care trust (Northern
social care we asked respondents for Ireland)
% of finance directors
their views about whether there would 60
n Local health board
be structural reconfiguration of the (Wales)
organisations in their area over the 40 n Territorial board
next 12 months. Chart 15 shows that (Scotland)
opinion is split, suggesting a degree 20
of uncertainty.
0
Action required Yes No Don’t know
We asked respondents to tell us
what actions would be of most help
to meeting the financial challenges in and collaboration, in particular
their areas. The responses covered to reduce demand, especially
national and local issues. emergency admissions.
Recognising that organisations are Finally, finance directors continue
struggling to achieve savings, many to call for honesty from politicians
finance directors felt more realistic with the public about services that
savings targets would be required can be provided within the financial
to help avoid further deterioration in settlement agreed for the NHS.
organisations’ finances. Respondents
felt savings could be achieved in part In a separate question we also asked
by actions to reduce agency staff finance directors to tell us the most
costs and staff costs in general. effective actions they were taking
to improve efficiency in 2015/16.
They also suggested more realistic Responses covered clinical, process,
expectations for reducing activity be local and national issues.
set out in BCF plans and other plans
for integrating services across health Many finance directors described
and social care organisations. local schemes to redesign clinical
pathways and models of care.
As with previous surveys, many Examples include work to improve
finance directors suggest changes case management of patients’
and improvements to the national care across organisational
payment system in England would boundaries, particularly through
help alleviate financial pressure. using neighbourhood-based multi-
Some suggest addressing the disciplinary teams. In addition to this,
purchaser-provider split in England some finance directors are planning
and the system of regulation that to invest in seven-day primary care
surrounds it. services to improve the management
of patient pathways.
Finance directors also called for
greater integration of services, Underpinning clinical developments
specifically more progress on the in their organisations, finance
BCF in England. This is a slight shift directors told us they are planning
in position from our previous survey, to develop their organisations’
when we found that some finance information management and
directors were questioning the technology strategies to improve
feasibility of the BCF as potentially staff mobile working, supporting
too high risk to achieve its objectives. multi-disciplinary teams. Some were
Allied to this, finance directors saw also planning to invest in electronic
the need for improved joint working patient record systems.12 NHS Financial Temperature Check
Finance directors are also planning but many do not feel they have
back-office efficiencies. Examples sufficient levers to make changes
include strengthening the programme they believe are necessary in their
management office in their health economies.
organisation, to help achieve savings
plans, including through reducing In addition, many finance directors
management costs. do not consider they have sufficient
resources for their organisation’s
Allied to this are finance directors’ long-term financial plans. The
plans to make savings through government has made it clear it is
improved procurement. Other extremely unlikely that there will be
measures suggested are to develop additional money beyond the £8bn
innovative contracts and better previously announced to support the
deployment of staff. Five-year forward view in England,
but finance directors feel increasingly
Finance directors also mentioned impeded by barriers to joint working
some plans to improve or safeguard and making changes at health
income streams. For instance, one economy level.
finance director intends to only tender
for contracts that are appropriately Faster progress is needed to achieve
funded, while another plans to the changes outlined in the Five-year
increase non-health income such as forward view in England, but some
from car-parking, retail opportunities areas will need financial support to
and commercial deals such as make this happen.
bedside TV screens.
Finance directors have ambitious
Conclusion plans to achieve savings through
The 2014/15 financial year was more improving their organisations’
challenging than finance directors efficiency, from procurement savings
expected at the beginning of the year. to supporting staff to work in different
Draft accounts show the provider ways. These savings will help to
trust sector overspent significantly protect and maintain services but
and the local NHS organisations in finance directors will not be able to
England in overall deficit. rely on these measures alone to
solve the longer term financial
Finance directors have told us problems due to increasing demand
2015/16 is looking even worse, for services and an ageing
with increasing numbers of population.
organisations forecasting deficits.
Many organisations with plans to
achieve financial balance report
significant risks to their plans and that
the financial risk is not being shared
equally with commissioners.
Across the UK, in spite of the
The authors of this briefing were Richard Edwards
financial challenges, the quality of
(consultant) and Paul Williams (HFMA research
services is largely being protected
manager), under the direction of Emma Knowles
and prioritised. But there are already (HFMA head of policy and research)
signs of pressure, particularly in
waiting times. Although the vast © Healthcare Financial Management
majority of finance directors believe Association 2015. All rights reserved
quality will not deteriorate, they have
concerns that patient safety and Any enquiries should be sent to the publishers at
patient outcomes are vulnerable. info@hfma.org.uk or posted to the HFMA at:
1 Temple Way, Bristol BS2 0BU
Finance directors understand well t: 0117 929 4789
f: 0117 929 4844
the challenges they face and can
e: info@hfma.org.uk
make changes in their organisations,
w: www.hfma.org.ukYou can also read