Economic Composition of Southwest Minnesota: Industries and Performance - EXTENSION CENTER FOR COMMUNITY VITALITY
←
→
Page content transcription
If your browser does not render page correctly, please read the page content below
EXTENSION CENTER FOR COMMUNITY VITALITY

Economic Composition of
Southwest Minnesota:
Industries and Performance

Authored by Brigid Tuck, Owusua Yamoah, and Neil Linscheid
Economic Composition of
 Southwest Minnesota: Industries
 and Performance
 SEPTEMBER 2014

 Authored by:
 Brigid Tuck, Senior Economic Impact Analyst
 Owusua Yamoah, Community Economics Intern
 Neil Linscheid, Extension Educator

 Editors:

 Matt Kane, Program Leader, University of Minnesota Extension Center for Community Vitality
 Joyce Hoelting, Assistant Director, University of Minnesota Extension Center for Community Vitality

 Reviewers:
 Dawn Hegland, Executive Director, Upper Minnesota Valley Regional Development Commission
 Cameron Macht, Regional Analysis and Outreach Manager, Minnesota Department of Employment and Economic Development
 Jay Trusty, Executive Director, Southwest Regional Development Commission

Presented in partnership with the EDA Center at the University of Minnesota, Crookston

 © 2014 Regents of the University of Minnesota. All rights reserved. University of Minnesota Extension is an equal opportunity educator and employer.
 In accordance with the Americans with Disabilities Act, this material is available in alternative formats upon request. Direct requests to 612‐625‐8233.
     Printed on recycled and recyclable paper with at least 10 percent postconsumer waste material.

                      ECONOMIC COMPOSITION: SOUTHWEST MINNESOTA                                                                                             i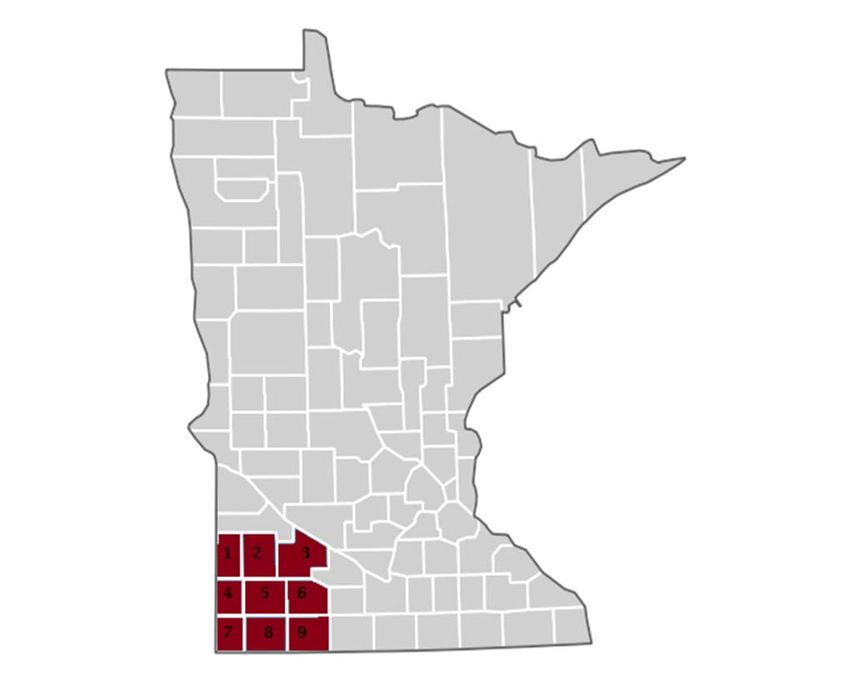
Table of Contents
1. KEY FINDINGS                                            1
   Regional Strengths                                      1
   Regional Concerns                                       1

2. STUDY BACKGROUND AND OVERVIEW OF SOUTHWEST REGION       2

3. INDUSTRY OUTPUT                                         3

4. EMPLOYMENT AND WAGES                                   5
   Employment and Wages by Industry                       8
   Agriculture                                            9
   Professional and Business Services                     9
   Manufacturing                                          9

5. LOCAL INTERDEPENDENCIES                                10
   Agriculture                                            10
   Manufacturing                                          11

6. METHODOLOGY, DATA, AND SOURCES                         12
   Shift‐Share Analysis                                   13
   Location Quotients                                     13

7. OTHER DATA SOURCES                                     14

              ECONOMIC COMPOSITION: SOUTHWEST MINNESOTA    ii
ECONOMIC COMPOSITION OF SOUTHWEST MINNESOTA: KEY FINDINGS
To analyze the economic composition of Southwest Minnesota, University of Minnesota Extension conducted an
analysis of industry outputs, employment and wages, and interdependencies. Following is a report of key
findings. This report is presented in partnership with the EDA Center at the University of Minnesota, Crookston.
Three main industries – manufacturing; agriculture and forestry; and professional and business services – drive
Southwest Minnesota’s economy. Two of the driving industries – agriculture and manufacturing- have been
growing in the past 10 years and have outperformed national and industry expectations. This provides a strong
platform for continued growth. Southwest Minnesota’s agricultural and manufacturing industries are integrated,
with the largest manufacturing sector (food) purchasing from local farm operations. A caution, as of the time of
this publication, there are predictions for relatively low grain prices for the 2014 harvest. This could significantly
impact the strength of the agricultural industry.
REGIONAL STRENGTHS:
Agriculture. Agriculture is the industry with the highest share of employment in the region (15 percent)
and contributes the second highest share of output (25 percent). In addition to being a strong base in the
region, agriculture has been a growth sector that has performed above national and industry averages,
making Southwest a competitive region in agriculture. The Southwest region has a higher concentration of
both crop farmers and livestock producers than other regions of the state. Hog farming and cattle
production are two primary livestock sectors in the region. Crop production is driven primarily by corn
and soybeans.
Manufacturing. Manufacturing is the industry with highest share of output in the region (30 percent) and
contributes the third highest share of employment (12 percent). Food manufacturing, machinery
manufacturing, and wood product manufacturing are leading the region. Southwest Minnesota is
competitive in these sectors, posting positive job gains while the industry at the national level suffered job
losses. Manufacturing wages are relatively high and stable in the region. The leading manufacturing
sectors in the Southwest area are animal slaughtering, rendering, and processing; farm machinery and
equipment manufacturing; and wet corn milling.
REGIONAL CONCERNS:
The analysis also revealed areas of potential concerns for the region, from an economic standpoint. Areas of
regional concern may warrant additional attention and understanding.
Management of companies and enterprises. Management of companies and enterprises (essentially
corporate headquarters) is one of the major sectors in the professional and business services industry in
the region. While the other sectors in the industry grew during the time period, the sector called
management of companies and enterprises declined, and at a rate higher than predicted given industry
and national trends. This is a high wage sector, so job losses can lead to greater effects on the economy.
Retail trade. Retail trade shed jobs between 2003 and 2013. Most of those jobs losses were in non-store
retailers and gasoline stations.
Health care. Health care and social assistance added the most jobs in the region in the period. However,
the industry grew at a slower pace than anticipated given gains in the health care industry at the national
level.
ECONOMIC COMPOSITION: SOUTHWEST MINNESOTA 1
STUDY BACKGROUND AND OVERVIEW OF SOUTHWEST REGION
Minnesota’s regions differ in size, social, and economic characteristics, history, and geography. These
differences influence the economy of the regions, as well as economic development decisions and discussions.
Therefore, conversations about Minnesota’s economy and its economic future must include discussions of the
diverse drivers of economic activity in the state’s regions. University of Minnesota Extension, in responding to
a broader conversation of the role of Greater Minnesota in the state’s economy, is producing economic profile
reports on Minnesota’s 12 non-metro regions. This report is provided in partnership with the EDA Center at
University of Minnesota, Crookston.

Located at the extreme southwestern corner of Minnesota, the region, represented by the Southwest Regional
Development Commission, is comprised of nine counties including Cottonwood, Jackson, Lincoln, Lyon,
Murray, Nobles, Pipestone, Redwood, and Rock counties. The region, located on a flat and windy prairie, is
known as one of the leading agricultural producing centers in Minnesota.1 The region is led by two regional
centers (Marshall and Worthington) and several other smaller sub-regional economic hubs.

    Map 1: Map of Southwest Region in Minnesota

                                                              SOUTHWEST REGION

                                                                1-   Lincoln County
                                                                2-   Lyon County
                                                                3-   Redwood County
                                                                4-   Pipestone County
                                                                5-   Murray County
                                                                6-   Cottonwood County
                                                                7-   Rock County
                                                                8-   Nobles County
                                                                9-   Jackson County

1
    Southwest Regional Comprehensive Economic Development Strategy (CEDS)2010-2013

                ECONOMIC COMPOSITION: SOUTHWEST MINNESOTA                                            2
This report explores industry outputs, employment, and wages by industry and sector, and industry
interdependencies in the region. The goals of the report are to 1) identify the region’s strengths – both
industries that are the current core of the economy and emerging industries – and 2) identify concerns for the
region. Regional concerns focus on industries which may be underperforming or declining.
To ascertain which industries are regional strengths and which are potential regional concerns, this report
draws from output, employment, and wage data. The first section looks at industry outputs. Output
measures the value of sales by industry. Studying output by industry provides perspective on which
industries are driving the highest sales in the region. The second section details employment. Studying
employment by industry provides perspective on the industries employing the highest number of people in
the region. The employment section of this report also discusses wages. The third section of this report looks
at economic interdependencies. Examining how sectors interact and connect with each other can provide
powerful insights into an economy.
INDUSTRY OUTPUT
Output is an important factor to consider when assessing the economic composition of a specific geography.
Output provides information about the economic activity of a region and also is directly tied to employment.
In 2012, businesses and industries in the Southwest region produced $14.6 billion in goods and services,
according to estimates from the IMPLAN economic model. Output in the Southwest region accounts for
approximately 2 percent of Minnesota’s $567.8 billion economy and 7 percent of Greater Minnesota’s $218.8
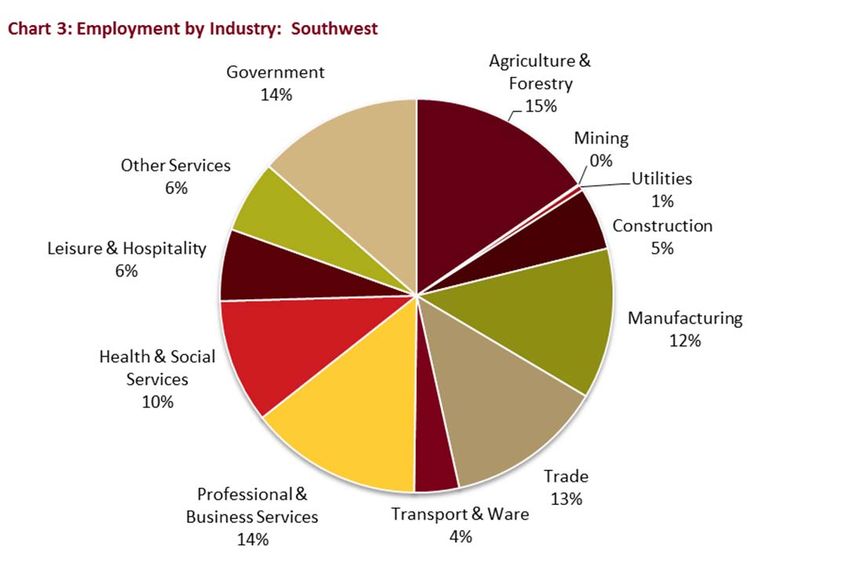
billion economy. The manufacturing industry produced 30 percent of the output; agriculture and forestry
produced 25 percent; and professional and business services produced 17 percent (chart 1). These three
industries produced 72 percent of all output in the region.
Source: IMPLAN
ECONOMIC COMPOSITION: SOUTHWEST MINNESOTA 3Chart 1 shows output by major industry category, helping to frame discussions about output in the region.
However, examining output by sector can be valuable too. Sectors are a more refined level of analysis.
Individual sectors form industries. For example, crop production and animal production are sectors within
the industry of agriculture.
Beyond the major industry categories, the top ten sectors in the Southwest region produce an estimated $10.6
billion of output (table 1). Food product manufacturing, crop farming, and livestock production are the top
generators of output in the region. Within the food product manufacturing sector, animal slaughtering,
rendering, and processing produces $1.1 billion of output. Wet corn milling produces $580 million in output.
Within crop farming, grain farming (primarily corn) produces $1.5 billion in output and oilseed farming
(primarily soybeans) produces nearly $700 million of output. In the livestock production sector, hog
production accounts for $800 million of output, and cattle ranching accounts for $360 million.
As a note here, the value of agricultural production, especially in the crop sector, is dependent on the price of
the commodity. Grain and oilseed commodity prices have been strong in recent years. At the time of
publication of this report, predictions hold that corn prices could fall below production costs for the 2014
harvest. Low commodity prices and potential farm losses could impact the strength of the agricultural
industry in Southwest Minnesota.
For the majority of the sectors in table 1, high output is driven by high productivity (output per worker). Each
food product manufacturing employee produces an estimated $505,800 in output annually. The clear
exception in the table is government and government-owned enterprises. Government output is linked
primarily to the number of employees. Output is also not a very adequate measure for the government sector,
as government does not make sales in the traditional sense of other industries. Output per worker is often
lower for service or labor intensive industries, as it takes more workers to produce output.
The industries with the lowest output per worker in the region include private households (households
providing services to other households, such as cleaning) and agriculture and forestry support activities
(including custom planting, harvesting, and fertilizer application). Since the model measures one job as one
job, these two industries, which have relatively high seasonal and part-time employment, likely have lower
output per worker because a significant share of the workers are working less than full-time.
ECONOMIC COMPOSITION: SOUTHWEST MINNESOTA 4Table 1: Top Ten Sectors in Southwest Region Sorted by Output
Sector Total Output (millions) Output per Worker
Food product manufacturing $2,526.7 $505,800
Crop farming $2,276.2 $335,400
Livestock production $1,340.4 $273,700
Machinery manufacturing $839.3 $482,800
Real estate establishments $778.6 $496,500
Government & government-owned enterprises $686.7 $61,000
Construction $639.2 $149,300
Monetary authorities $621.0 $411,200
Wholesale trade $595.7 $183,200
Scientific and technical services $282.9 $108,800
Top ten total $10,586.7 (73%)
Total output in region $14,563.9 Source: IMPLAN
EMPLOYMENT AND WAGES
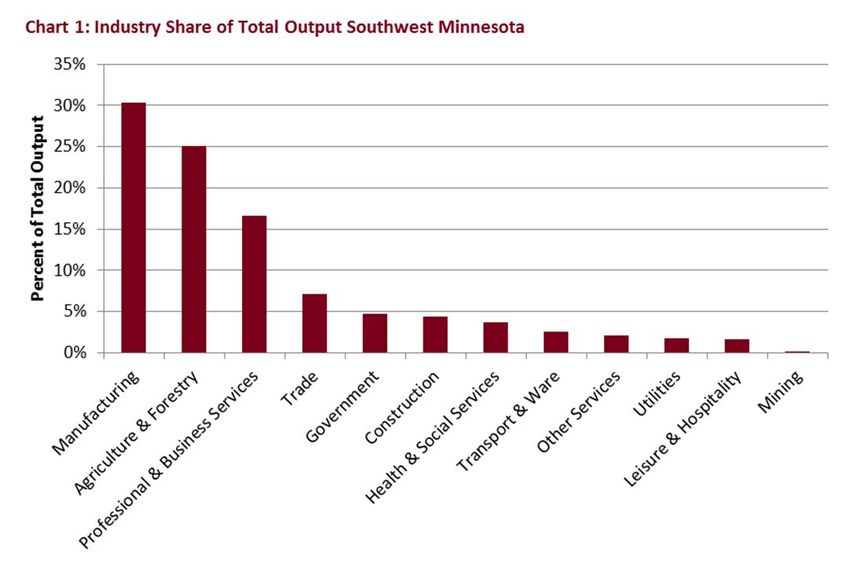
Employment in the region drifted up and down between 2000 and 2013 (see chart 2). In 2001, there were
53,200 jobs in the region.2 This shot up to close to 54,500 in 2008. The region was however affected by the
recession, which decreased employment between 2008 and 2012. By 2013, total employment increased to
54,300, or within 200 jobs of the 2008 peak. Overall, the Southwest region fared relatively well during the
Great Recession of 2008 -2009, especially when compared to other regions in Minnesota.
2
Quarterly Census of Employment and Wages
ECONOMIC COMPOSITION: SOUTHWEST MINNESOTA 5Source: QCEW
The highest employment growth industries between 2003 and 2012 were health care and social assistance
(845 new jobs); agriculture, forestry, fishing and hunting (720 new jobs); and manufacturing (403 new jobs).
The industries suffering the most jobs losses during the period include government (904 lost jobs), retail
trade (696 lost jobs), and other services (396 lost jobs). 3
Shift-share analysis provides an examination of the drivers of growth and decline for a specific industry in a
specific region by comparing to industry and national trends. The analysis provides an interesting
interpretation of the changes in each industry (table 2). In this analysis, the primary focus is on the
competitive effect. A strongly positive competitive effect indicates particular characteristics of the local
economy are driving growth in the region. A strongly negative competitive effect can be interpreted as a
warning that the local economy may not be faring as well as it should. For more on shift-share analysis and
how to fully interpret the results, please see page 13.
With 845 new jobs, the health care and social assistance industry posted the largest employment gains in the
region. However, shift-share analysis reveals it gained fewer jobs than expected given national and industry
trends. Had the industry grown at the same rate as the health care and social assistance industry in the
United States as a whole, the Southwest region would have added 1,241 new jobs. If the health care and social
assistance industry had grown at the rate of overall employment in the nation for all industries, it should have
added 204 jobs.
In total, industry and national averages would predict an addition of 1,445 jobs. However, the industry only
added 845 jobs, or 600 fewer jobs than should have been created. The competitive effect then is a negative
600 jobs. The region is not adding health care jobs at the rate one would expect.
In contrast, the manufacturing and agriculture industries are extremely competitive. Nationally,
manufacturing has suffered significant jobs losses. However, Southwest Minnesota posted moderate gains. If
3
EMSI
ECONOMIC COMPOSITION: SOUTHWEST MINNESOTA 6manufacturing in the region had declined at the same rate as manufacturing in the nation, it would have shed
1,981 jobs. However, the region added 403 new jobs.
As shown in the chart below, agriculture in the Southwest region also outperformed agriculture in the nation.
Table 2: Shift‐Share Analysis for Growth and Decline Industries4
Change 2003‐ Industry Mix National Growth
Industry Competitive Effect
2013 Effect Effect
Top 3 Job Adding Industries
Health Care and Social Assistance 845 1,241 204 (600)
Agriculture, Forestry, Fishing & Hunting 720 (152) 84 788
Manufacturing 403 (1,981) 276 2,107
Top 3 Job Loss Industries
Other Services, except Public Admin. (396) 100 93 (589)
Retail Trade (696) (295) 203 (604)
Government (904) (98) 346 (1,153)
Source: EMSI
Southwest Minnesota suffered a lack of competitiveness in industries in which it lost jobs. Given national and
industry trends, the industry called “other services” should have gained nearly 200 jobs; however, the region
lost nearly 400 jobs in the industry. Other services is a catch-all category for a range of services that do not
fit into the other designated categories for services. The other services category broadly includes two types of
services: 1) maintenance and repair services (automobiles, computers, electronics), and 2) personal services
(such as barber shops and beauty salons).
Retail trade and government are also industries which suffered nationally during the recession. However,
Southwest Minnesota lost jobs at a higher rate than expected given national and industry trends. In retail
trade, 225 of these lost jobs were in the non-store retailer category. Non-store retailers include electronic
sales, mail order sales, vending machine sales, and fuel dealers. Another 151 of the lost jobs were in the
gasoline stations category. General merchandise retailers added 72 jobs in the time period.
4
For an explanation of shift-share analysis, please see the methodology section.
ECONOMIC COMPOSITION: SOUTHWEST MINNESOTA 7Key things for economic developers to consider from this employment data:
Find ways to support competitive industries. This will likely mean engaging industry leaders to discuss
the key drivers of economic advantage in this region.
For some non-competitive industries, it’s important to learn more about the key drivers. Retail trade had
especially difficult years between 2003 and 2012. Understanding the nature of this change will be key to
mitigating the negative effects in the future.
Further, the region should be adding more health care jobs. Sioux Falls, with its geographic location and
its status as a regional hub, may be driving some of these downward trends for Southwest Minnesota.
Employment and Wages by Industry
Employment in the Southwest region is fairly balanced across industries (chart 3). The highest percentages of
employment are in the industry categories of agriculture and forestry; professional and business services;
government; and manufacturing. For this nine-county region of Southwest Minnesota, two of its biggest
employment industries are also the competitive, growth industries identified above – agriculture and
manufacturing.
Source: IMPLAN
ECONOMIC COMPOSITION: SOUTHWEST MINNESOTA 8Agriculture
A more detailed look at sectors within industries shows additional regional strengths. Within the agriculture
and forestry industry, grain farming is the largest farming activity in the region, employing approximately 41
percent of farmers in the region. Hog production is the second largest contributor to the agricultural industry
in the region accounting for 35 percent of the sector’s total employment. Both crop production and animal
production are strengths for the region. Shift-share analysis shows positive gains for competitive share in
both industries from 2003-2013.
One way to measure the strength of an industry in a region is to consider the location quotient, which
compares an industry or sector in the region to a larger area of study. Location quotients are 1.5 for crop
production and 5.0 for animal production in the Southwest region. A location quotient over 1 indicates the
industry has a higher level of employment, or a concentration, as compared to the state. The higher the
location quotient is the higher the concentration of employment. Please see page 13 for an explanation of
location quotients.
Professional and Business Services
The second largest employment industry is professional and business services. It employs 14 percent of the
region’s employees. The professional and business services industry is comprised of a broad range of sectors.
The highest numbers of employees in the Southwest region are in the sectors of finance and insurance,
scientific and technical services, and administrative and waste services.
Wages rose significantly in the professional and business services industry between 2000 and 2013. In 2000,
the average weekly wage in the region was an inflation-adjusted $570 (adjusted to 2013 dollar levels). By 2013,
this had increased to $945, a 66 percent increase. Lyon County has the highest average weekly wages in the
industry at $1,119. Redwood ($908) and Pipestone ($879) have the second and third highest, respectively.
Lincoln County has the lowest average weekly wages in the industry at $545.
Increases in the weekly wage in this industry are being driven primarily by the sectors of management of
companies and enterprises ($1,473 per week). Lyon County is the home county for several corporate
headquarters and likely is driving these wage changes.
Unfortunately, the sector called management of companies and enterprises lost jobs between 2003 and 2013
in the region. The competitive share was also negative, indicating that this important wage driver is declining
faster in the region than it should be based on industry and national trends. The other two large sectors,
finance and insurance services and scientific and technical services, added jobs and posted positive
competitive shares during the time period.
Manufacturing
The third largest employment industry is manufacturing. It employs 12 percent of the region’s employees.
Employment in the industry declined in the early 2000s. In 2005, the industry began growing again. The
Great Recession caused the industry to shed jobs between 2008 and 2010. Growth began again in 2011.
Within the manufacturing industry, the largest employers are food production, machinery manufacturing and
wood products. The food production sector has performed well in the Southwest region. It gained nearly 600
jobs between 2003 and 2012 when the industry itself lost jobs, making Southwest a competitive region. The
location quotient is 5.3 indicating a regional specialization. Machinery manufacturing also performed well,
adding jobs, primarily because of the region’s competiveness. Wood product manufacturing lost jobs, but at a
much lower rate than would have been predicted given national and industry trends.
ECONOMIC COMPOSITION: SOUTHWEST MINNESOTA 9Manufacturing wages have risen modestly in the region since 2000. In 2000, the industry’s average weekly
wage was $750 (in 2013 inflation adjusted numbers). By 2013, wages had risen to $820 per week. Wages
dropped slightly during the recession of the early 2000s but rose during the Great Recession. Average weekly
wage is highest in the chemical manufacturing sector at $1,130. Machinery manufacturing pays an average of
$939 a week, nonmetallic mineral mining $856 a week, and food production $823 a week. Manufacturing
wages are highest in Jackson ($956), Lyon ($894), and Nobles ($841) counties. Average weekly wages are
lowest in Murray County ($556).
LOCAL INTERDEPENDENCIES
Beyond studying basic structure, examining how sectors interact with each other can provide powerful
insights into an economy. Input-output models have been developed to estimate how sectors connect within a
region. This section of the report will examine the two main drivers of the Southwest economy - agriculture
and manufacturing - and their connections with other sectors. Specifically, the analysis will focus on 1) grain
farming and 2) animal slaughtering, rendering, and processing. These are the two largest sectors within their
respective industries, as measured by output.
Multipliers include both indirect and induced effects. Indirect effects are generated when a firm purchases
inputs (goods and services) from other business establishments which in turn purchase the goods and
services needed for their output. These are often referred to as supply chain effects. Induced effects are
generated when employees of a local industry spend their wages in the region. The discussion here focuses
on indirect effects.
Multipliers are driven by the amount of purchases a sector makes from other sectors. Understanding what
inputs are necessary for the production of a good or service and the extent to which those inputs are
produced locally can provide insights into the potential for economic development from the sector.
Agriculture
Output multipliers for the agricultural sectors in the Southwest region are estimated to range from 1.3 to 1.4.
In other words, for every dollar of output generated by the sector (corn farming, for example), $0.30 to $0.40
cents are generated in other regional sectors that supply that sector.
Table 3 highlights expenditures by grain farm operations. For every dollar spent on inputs, grain farm
operations are estimated to spend 11 percent on real estate (land), 10 percent on fertilizer, and 10 percent on
agricultural support services. Land is a fixed commodity, so all demand is satisfied locally. However, the
region does not produce fertilizer or agricultural support services in high enough quantities to satisfy the
local demand. Therefore, grain farm operations are importing those items from elsewhere.
ECONOMIC COMPOSITION: SOUTHWEST MINNESOTA 10Table 3: Top Purchases by Grain Farming Operations in the Southwest Minnesota Region, Percent of Total Expenditures,
and Local Availability
Input Percent of Input Expenditures More than 50% of Demand Available
from Suppliers within the Southwest
Region
Real estate 11% Yes
Fertilizer 10% No
Agricultural support services 10% No
Petroleum products 8% No
Banks 8% Yes
Grains 8% Yes
Pesticides and other chemicals 7% No
Wholesale trade 3% Yes
Maintenance and repair of buildings 1% Yes
Truck transportation 1% Yes
Source: IMPLAN
Table 3 helps illustrate two points. First, grain farm operations are important sources of local demand for
real estate (land), banking institutions, other grain operators (seed suppliers), and wholesale trade operations.5
These industries and sectors with strong connections to grain farming are the top industries capturing the 30
to 40 cents of additional economic activity that flows from every dollar of agricultural output mentioned
above. Second, there may be opportunities for increased local production of fertilizer, agricultural support
services, and pesticides, because grain farmers are purchasing significant levels of these outputs from outside
the region. Pursuing economic development based on possible opportunities for supply chain development is
one economic development approach. However, before moving forward, decision-makers should: 1) take a
scan of the industry, as it could be that the suppliers are located just outside the region as defined for this
study and therefore could be considered local: and, 2) explore the reasons for the current industry location, as
location decisions are based on a broad variety of factors including proximity to supplies and transportation
routes.
Manufacturing
Multipliers for food product manufacturing sectors are estimated to range from 1.3 to 1.7. Manufacturing
multipliers are often higher than agriculture, particularly if they use an agricultural product in their
manufacturing process. Table 4 shows the top inputs purchased locally by animal slaughtering facilities, the
percent of total input expenditures spent on the item, and the local availability of the item.
5
Local here is the Southwest region.
ECONOMIC COMPOSITION: SOUTHWEST MINNESOTA 11For every dollar spent on inputs in the animal slaughtering process, 60 percent is spent on the purchase of the
animal itself. In Southwest Minnesota, animal slaughtering facilities spend nearly $400 million on animals. To
the extent that these animals are produced locally, this drives high sales for local producers.
Table 4: Top Purchases by Animal Slaughtering, Rendering, and Processing Facilities in the Southwest Minnesota Region,
Percent of Total Expenditures, and Local Availability
Input Percent of Input Expenditures More than 50% of Demand Available
from Suppliers within the Southwest
Region
Animal production 60% Yes
Processed animal meats 14% Yes
Wholesale trade 2% Yes
Management of companies 2% No
Truck transportation 2% Yes
Electricity 1% Yes
Banks 1% Yes
Paperboard containers 1% No
Seasonings and dressings 1% No
Natural gas 1% No
Source: IMPLAN
These two examples (grain farming and animal slaughtering, rendering and processing) demonstrate the
importance of economic interdependencies and interactions in the region. In general, industries that purchase
from local suppliers tend to have higher economic impacts in the region.
METHODOLOGY, DATA, AND SOURCES
This report presents the economic characteristics of the region and an analysis of industries, income and
employment. Three data sources were accessed in the preparation of the report. One data source is the
IMPLAN database. IMPLAN is an input-output model developed by MIG, Inc. The database compiles a variety
of sources to provide data on output, employment, and labor income by county for 440 economic sectors. A
second data source is the Quarterly Census of Employment and Wages (QCEW) data provided by the Minnesota
Department of Employment and Economic Development. This data is used, when necessary, to compliment or
clarify the IMPLAN data. Finally, data from Economic Modeling Specialists International (EMSI) is presented in
this report. The EMSI data in this report is derived from QCEW data; however, EMSI provides simple tools for
performing calculations, such as shift-share analysis, on the data.
The Regional Development Commission boundaries were used for this study’s definition of Southwest
Minnesota. The North American Industry Classification System (NAICS) code was used in the study. The NAICS
is the standard used by Federal statistical agencies in classifying business establishments for the purpose of
collecting, analyzing, and publishing statistical data related to the U.S. business economy. This was used to
enable uniformity and also for easy data accessibility.
ECONOMIC COMPOSITION: SOUTHWEST MINNESOTA 12Finally, data was analyzed with input from Extension Educators in the region and findings were compiled into
the report.
Shift‐Share Analysis
The results of shift-share analysis are presented in this report. Shift-share analysis is a powerful tool for
understanding the drivers of economic change in an industry. Shift-share analysis parses economic change
(here employment changes) into three components: national growth, industrial mix, and competitive share.
National Growth: National growth indicates how many jobs a local economy would have gained (or
lost) as a result of the growth (or decline) of employment at the national level. For example, consider a
local economy with 100,000 jobs at the beginning of the time period. If during the period under
consideration, the number of jobs in the United States grew by a rate of 2 percent, then at the end of
the time period under consideration, the local economy would be expected to have 102,000 jobs.
Industrial Mix: Industrial mix indicates how many jobs a particular industry within the local economy
would have gained (or lost) if the local industry grew (or declined) at a rate similar to the industry as a
whole in the United States. For example, if 1,000 people were employed in the finance industry in the
local economy at the beginning of the period, and the finance industry as a whole in the U.S. grew at a
rate of 10 percent, then at the end of the time period under consideration, the local finance industry
would be expected to have 1,100 jobs.
Competitive Share: Competitive share is the remainder of change in employment for the region
examined. From our example, region’s employment should have grown by 2,100 jobs, looking at
overall national growth and then growth in the finance industry itself. If the local economy actually
grew by 3,100 jobs in the finance industry, then 1,000 jobs were added because the local economy
grew faster than expected, given national and industry trends. Conversely, if the local economy grew
by only 1,000 jobs, then the economy was not as competitive as it should have been, given national
and industry trends.
Percent Competitive Share: This is the percent of total jobs that are sourced from competitive share.
A competitive share of 80 percent would indicate that 80 percent of the jobs during the time period
were derived from the competitive share, rather than from national and industry trends.
Location Quotients
This analysis reports the location quotient for certain industries. Location quotients are used in determining
the concentration of a particular industry or sector in a region compared to a larger study area. In this
analysis, the location quotient for the region versus the state is reported. If, say, 30 percent of employment in
a region is in health care, but at the state level, only 15% of employment is in health care, then the location
quotient would be 2, indicating that the region has twice as much employment in health care than the state as
a whole.
ECONOMIC COMPOSITION: SOUTHWEST MINNESOTA 13OTHER DATA RESOURCES
Source Link Description
Comprehensive data source for Minnesota
counties and cities. In collaboration with the
Wilder Foundation www.mncompass.org
Initiative Foundations and others, Minnesota
Compass has added available data about smaller
cities.
MN Demographers http://mn.gov/admin/demography Go here for population estimates by EDR,
Office /data-by-topic/population- County, and City/Townships. 2013 Estimates
data/our-estimates/index.jsp are available.
MN Land http://www.landeconomics.umn. Go here for information about land sales, land
Economics edu/ values, property taxes, soil type, etc. The
database can be used to get information at the
local, county, and state levels.
Headwaters Generate your own socioeconomic profiles
Economics from federal data sources, by using the EPS-
http://headwaterseconomics.org/
HDT Tool. The attached guidebook presents
tools/eps-hdt
the data and provides a step by step walk-
through on how to think about it.
DEED Data Tools http://mn.gov/deed/data/data- DEED provides access to several data tools
tools/index.jsp such as labor market data, unemployment data,
and many others. Most labor market data can
be accessed through the labor market portal:
https://apps.deed.state.mn.us/lmi/rws/
University of http://fyi.uwex.edu/downtown- Learn More about Demographic and Lifestyle
Wisconsin market-analysis/understanding- analysis
Extension the-market/demographics-and-
lifestyle-analysis/
University of http://cced.ces.uwex.edu/files/20 Useful Computer Links to Sources of
Wisconsin 13/02/Resource-Document-Total- Information for Economic Developers
Extension 12.pdf
OnTheMap http://onthemap.ces.census.gov/ Mapping tool from the census. Use this
understand where people live vs work
University of http://www.netmigration.wisc.ed Use this to learn about – and visualize – migration
Wisconsin- u/ patterns for U.S. counties.
Madison, Michigan
Tech University,
University of New
Hampshire
ECONOMIC COMPOSITION: SOUTHWEST MINNESOTA 14You can also read