FORECASTING THE NUMBER OF JOBS CREATED THROUGH CONSTRUCTION
←
→
Page content transcription
If your browser does not render page correctly, please read the page content below
FORECASTING THE NUMBER OF JOBS CREATED
THROUGH CONSTRUCTION
Doug Forbes1, Mohamed El-Haram2, Malcolm Horner2, Sandra Lilley3

1 Whole Life Consultants Ltd, Dundee University Incubator, James Lindsay Place, Dundee, DD15JJ
2 Division of Civil Engineering, University of Dundee, Dundee, DD1 4HN
3 CITB-ConstructionSkills, Bircham Newton, Norfolk, PE31 6RH

          The construction sector is one of the largest single contributors to employment. A
          wide and varied set of metrics is used by official channels to predict the number of
          jobs that will be created for a given value of construction expenditure. These values
          tend to be shrouded in context specificity (ie, a peak workforce, or number of jobs
          created for one year) which meet the agenda of the organisation making the
          announcement. The research reported in this paper reviews the outcomes of five years
          of research into labour forecasting culminating in the development of the Labour
          Forecasting Tool (LFT). The research explores three approaches to deriving labour
          coefficients (the amount of labour per £m of construction value): i) a review of
          historic data produced by contractors; ii) a theoretical build-up of labour from bills of
          quantities and iii) an analysis of published UK national statistics. The shortfalls and
          advantages of each approach are discussed along with the results of a triangulation of
          the three methods to test the accuracy of the results. Encouragingly, the results point
          towards a strong agreement between the three approaches. However, whilst the labour
          coefficient can provide an estimate of the total labour demand in person-years this
          must be translated to a meaningful measure of the construction jobs created. To do so
          requires an understanding of the labour flow during a project. The LFT is capable of
          producing a month-by-month, trade-by trade forecast for a project by the use of a
          bespoke algorithm. Using the LFT, results are presented for eight typical projects
          within seven construction sectors. The significant impact of project duration on peak
          ODERXUGHPDQGLVVKRZQ7KHFRQFOXVLRQFDQEHGUDZQWKDWDQ\GLVFXVVLRQRIµMREV
          FUHDWHG¶PXVWEHFOHDUO\SUHVHQWHGLQWKHFRQWH[WLQZKLFKLWLVUHSRUWHG

          Keywords: employment, labour forecasting, productivity

INTRODUCTION
In the current global economic climate, governments and developers are keen to
predict the number of jobs created by their investments. Construction is one of the
largest single sectors in the economy. Economically, the industry employs nearly 3
million people, outputs £100 billion worth of work per year and accounts for 8% of
gross domestic product (HM Government, 2008). In these austere times the lack of

1
    Doug.forbes@wlcuk.com

Forbes D; El-Haram M; Horner M and Lilley S (2012) Forecasting the number of jobs
created through construction In: Smith, S.D (Ed) Procs 28th Annual ARCOM
Conference, 3-5 September 2012, Edinburgh, UK, Association of Researchers in
Construction Management, 317-326.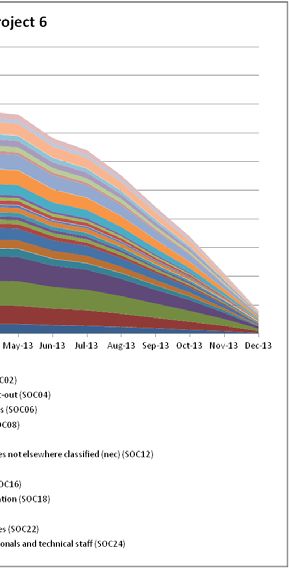
Forbes, El-Haram, Horner and Lilley

growth in the construction industry is regularly cited as the cause of overall
contraction in the economy (Office for National Statistics, 2012). However, at a more
detailed level the question remains of how many jobs are created by construction
expenditure for a given project.
There are a number of reasons why the number of jobs created by a given project
might be required. One of the primary reasons is that those who are investing want to
publicise the impact of their contribution. Therefore, public relation staff will issue
press releases stating "X number of construction jobs created" by a particular new-
build project. However, what is not immediately clear from such assertions is the
rationale for calculating the number of jobs created and exactly what is meant by "a
job". For instance, does it refer to the peak workforce and over what period of time
will the jobs be created? A further reason for estimating the number of people
employed is the increasing requirement from government at all levels to upskill the
workforce. Planning requirements such as Section 106 Agreements under the Town
and Country Planning Act 1990 allow local authorities to specify community benefits.
Increasingly these are being used to ensure broader benefits such as increase in
targeted recruitment and training. However, to be able to negotiate the training levels
with developers, local authorities must first know the demand created by the project.
The aim of this research is to create a labour forecasting tool capable of forecasting on
a project-by-project basis. This tool predicts at early planning stages when very little
information is known about the project. The tool was originally commissioned by
CITB-ConstructionSkills to inform the demands for training in its National Skills
Academies for Construction (Forbes et al. 2009). The Academies focused on project-
based training centres and therefore a need existed to forecast the demand for labour
of all kinds, including professionals. Creating a fully evidence-based breakdown by
month and by occupation is a vital starting point in developing realistic employment
and skills plans for a project as well as determining requirements for targeted
recruitment and training.
A secondary aim of the research presented in this paper is to compare the outputs of
the Labour Forecasting Tool (LFT) with a selection of media reports of the number of
jobs created by construction projects. Using articles publicising the number of jobs
created in various projects and inputting these project parameters to the LFT estimates
of the labour demand have been obtained. Using these it is possible to gain insight into
the assumptions that are made in predicting the labour demand and the impact of these
on the claims for the number of jobs created.
ESTIMATING THE LABOUR DEMAND IN CONSTRUCTION
Labour forecasting at an early stage of a project inception is a topic that has not
received significant research attention in the literature. From a labour forecasting
perspective Chan et al. (2006) developed a manpower planning model for Hong Kong.
This model was designed with the aim of allowing government to compare where they
might generate the most jobs from public investment. The tool split projects into 10
equal phases to determine the labour flow through the project and demand at each
stage. Their approach calculates the average number of jobs created:
Number of jobs created =   Total labour requirements (in man-months)
                           Project duration (in months)
Ball and Wood (1995) explored the issue of job creation from construction and
reviewed the existing publications on the number of jobs per £1m of construction.
318
Forecasting and Decision Making
They found that these varied by up to 100% and that there was a need to develop new
estimates using site-based information. Proverbs et el (1999) developed an approach
designed for estimating labour at the inception stage. This created a measure of labour
hours based on the floor area of a building and was restricted to a concrete framed
high rise structures using productivity rates for each task. More recently, Anumba et
al. (2006) considered the problem of supply and demand in construction labour
market planning. They concluded that the GIS approach which they developed should
be used in conjunction with other labour forecasting approaches and that there was a
particular need to look at the sub-regional level. Such sub-regional data did not exist
in 2005 and it is at this level that our Labour Forecasting Tool contributes.
In an approach that is designed to provide quick estimates of the number of jobs per
year created from construction the former Regional Development Agency, One North
East (2010) published guidance. For new build projects they recommended
coefficients from between 10.6 and 21.0 jobs per £m output per year at 2009 prices.
Personal correspondence in 2012 with Scottish Enterprise suggested a similar
approach. They currently use one job per £75,000 of expenditure. This value is
derived by assessing the turnover per employee in the construction industry from
national statistics. This equates to 13.3 jobs per £m construction and is therefore
comparable with the outputs from One North East.
Overall there is a need to explore how labour can be forecast at an early stage of a
project when very little is known about the project except an outline budget. The
research presented attempts to create a forecast with a rigorous, evidence-based
approach and develop a tool which can forecast labour demand initially for the UK.
THE LABOUR FORECASTING TOOL
The Labour Forecasting Tool was initially developed in 2008 for CITB-
ConstructionSkills. CITB-ConstructionSkills are the industry training board and the
Sector Skills Council for Construction in the UK. The tool was developed to create
project-based forecasts. It can be used to forecast the labour demand on a month-by-
month basis broken down by each of 26 occupations shown in Table 1. To create this
forecast the tool needs to know a) the project type; b) the project value and price
ruling date (exclusive of any land or site preparation costs); c) the location (by UK
region); and d) start date & end date/duration.
Land costs and site preparation costs are excluded from the forecast as preliminary
investigation led to the conclusion that these tended to be site specific. Examples of
site preparation costs include extensive earthworks or contaminated land restoration.
For the project types, the level of granularity is maintained at a high level. The types
are defined by the seven sectors used by the Office for National Statistics (Office for
National Statistics (2010). This produces high-level forecasts at a sector level and
ongoing work is seeking to improve the granularity of these to improve the forecasts
of specific building types. Forecasting at this level maintains consistency with the data
which is available. The seven sectors are:
x Housing
x Infrastructure
x Public non-residential
x Private industrial
x Private commercial
x Housing repair and maintenance
319Forbes, El-Haram, Horner and Lilley
x Non-housing repair and maintenance.
For each of the forecasts produced, it is possible to select which of the 26 occupations
are required. These occupations are defined by the 26 Standard Occupational
Classifications (SOCs) produced by CITB-ConstructionSkills. In producing a forecast
using these occupations a picture is obtained of the total labour involved in a project
including both site and non-site based staff.
Table 1: List of Standard Occupational Classifications
Senior, executive and business process managers Plant operatives (SOC14)
(SOC01)
Plant mechanics/fitters (SOC15)
Construction managers (SOC02)
Steel erectors/structural (SOC16)
Non construction professional, technical, IT, and
Labourers nec (SOC17)
other office based staff (excl. managers) (SOC03)
Electrical trades and installation (SOC18)
Wood trades and interior fit-out (SOC04)
Plumbing and heating, ventilation, and air
Bricklayers (SOC05)
conditioning trades (SOC19)
Building envelope specialists (SOC06)
Logistics (SOC20)
Painters and decorators (SOC07)
Civil engineering operatives not elsewhere
Plasterers and dry liners (SOC08) classified (SOC21)
Roofers (SOC09) Non±construction operatives (SOC22)
Floorers (SOC10) Civil engineers (SOC23)
Glaziers (SOC11) Other construction professionals and technical
staff (SOC24)
Specialist building operatives not elsewhere
classified (SOC12) Architects (SOC25)
Scaffolders (SOC13) Surveyors (SOC26)
Sources of data
The aim of the LFT is to predict the labour demand at an early stage when there is
little known about the specific characteristics of the project. For instance, it may not
be known whether the housing project is timber framed or non-timber framed.
Therefore, the data which underlies the tool is taken as an average across all of the
sub-sectors within each of the seven sectors as data is not available at a sufficiently
detailed level to allow a more detailed analysis to be undertaken. It is not the aim of
this paper to outline the analysis undertaken in detail; the processes is summarised
here for completeness along with the shortfalls and benefits of each approach. Please
refer to Forbes et al. (2009) for more details.
At the seven sector level three sources of data are used to populate the LFT. The first
of these and the most comprehensive is the analysis of Office for National Statistics
(ONS) data. Data is published for the number of each occupation employed in each
year and the total output (£m) from each sector. This data is used to create 26
occupational labour coefficients (person-years/£m) for each of the sectors. One of the
difficulties in using national data is that the aggregation process provides an average
across the sectors. However, at the stage the LFT is designed to be used this is not a
problem and is far outweighed by the breadth of the data available for the analysis.
The labour coefficient in each SOC is each industrial sector was established by
320Forecasting and Decision Making
solving a large set of simultaneous equations. As data in from the ONS is published
annually a continuous updating process can be undertaken.
Although the data from the ONS is the most complete and comprehensive two
additional sources of data were analysed to verify the initial analysis. The first of these
was a review of actual data from contractors on historic projects. This is the richest
and most reliable source of data and would be the data of choice for use in forecasting.
However this presented challenges in obtaining the data in the required format for the
range of projects and trades. Where this data is available it is a very rich source which
provides the exact labour data for a project. However, there were particular issues in
relation to contractors who sub-contracted all or part of the works as labour records
were rarely kept. The final source of data to determine labour coefficients was to
create a theoretical build-up of labour by assigning the labour requirements to bills of
quantities. This is similar to the approach used by Proverbs et al. (1999). Whilst this
proved effective it was time consuming and therefore not feasible on a large number
of bills. Attempts were made to automate the process but a lack of consistency in the
production of bills of quantities rendered this ineffective.
However, following the two additional analyses there emerged sufficient data that the
values arising from the ONS analysis could be triangulated. The results showed that
there was a degree of uniformity between the outputs from the various analyses and
thereby providing considerable confidence in the results.
Factors affecting the labour forecast
There is a multitude of factors which might affect the labour requirements for a
construction project. The assumptions which are made regarding labour productivity
(Horner and Duff, 2001) and the construction method are amongst a few. At the stage
the LFT is designed to be used it is not necessary to take account of all of the differing
factors and indeed likely to be impossible. However, the LFT does take account of
two factors in determining the labour demand:
a) the different points at which each trade arrives on and leaves site (for instance
finishing trades will start and finish on site later than ground works) and
b) the labour flow throughout the project (the shape of the "s-curve").
By taking account of these it is possible to translate the overall labour demand from a
labour coefficient (person-years/£m) to a number of people in each month. However,
both factors can have a significant impact on the peak labour demand and their
interaction affects the peak. For instance, if the assumption is made that a particular
trade is on site for the entire duration the peak will be lower than for the same labour
profile that is only on site for say 75% of the project.
The Labour Forecasting Tool takes account of these factors by best-fitting s-curves
and lead and lag times for each occupation in each sector. These have been fitted to
historic data from contractors. Fitting data in this manner overcomes some of the
limitations of models which split a project into a number of equal periods such as
Chan et al.'s (2006) model for Hong Kong.
FORECASTS OF EMPLOYMENT ARISING FROM
CONSTRUCTION
The media regularly run reports from developers, government agencies and other
organisations providing headline-grabbing figures of the number of jobs that will be
created by a particular new development. This section outlines outputs from the
321Forbes, El-Haram, Horner and Lilley
Labour Forecasting Tool for projects which have hit the headlines. Table 2 outlines
the characteristics of eight projects representing a range of sectors, regions and values.
All have been featured in recent news articles from different sources. The sources of
these are provided.
Table 2: The projects
Proj- Type Description Location Value Duration Source
ect
1 Housing Conversion of East Midlands £30m 2 years http://bit.l
existing building to y/Ia1aBm
student
accommodation
2 Commercial Construction of Scotland £34m 20 months http://bit.l
new office y/IlmfEw
accommodation
3 Public non- Construction of Wales £40m 2 years http://bit.l
residential University Arts y/I31Qod
Building
4 Commercial New retail West £150m 33 months http://bit.l
development Midlands y/Jvysw7
5 Infrastructure New road Scotland £320m 2 years http://bit.l
construction y/I6EuAn
6 Industrial Pharmaceutical North £350m 6 years http://bit.l
factory West/Scotland y/JvfYN6
7 Infrastructure New road Scotland £445m 3 years http://bit.l
construction y/JvfWF8
8 Infrastructure Large infrastructure South East £647m 3 years http://bit.l
project to form new y/I31P3A
logistic park
Each of the eight projects was input to the LFT and a labour profile created for the
project. Sufficient information was available from each of the articles to assess the
input parameters for the LFT. The assumptions which were made related to the project
values. In none of the cases was it explicitly stated whether the value included land
costs. Given the nature of the articles, it was assumed that land costs were excluded
from the figures. It was not clear whether site preparation costs were included.
However, it was assumed that the total jobs presented would relate to value which was
presented and so site preparation costs would therefore be reflected in the overall
labour demand. The impact of site preparation costs would be to produce a separate
peak, or at the very least a rise in labour at an early stage in the project. This would
reduce the overall peak labour demand but the effect of this is not likely to be
significant as has been tested in preliminary forecasting work.
A further assumption was made in relation to the price ruling date. None of the articles
stated the date for the value given. In the absence of this data it was assumed that the
price ruling date was the date of publication. However, there has been very little
fluctuation in tender price indices in the last four years, so this is likely to have little
impact.
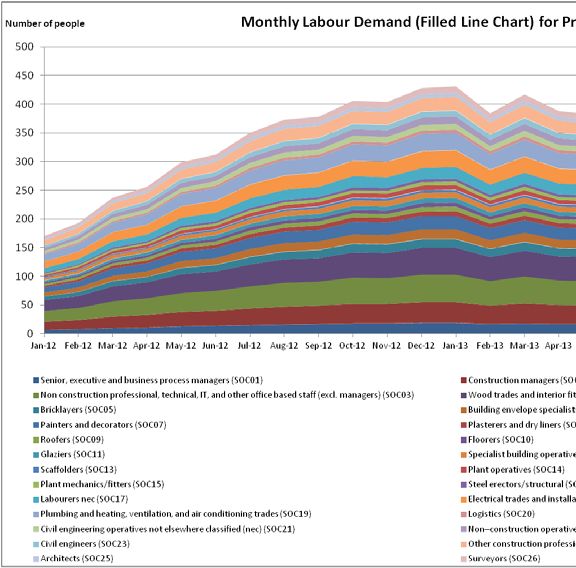
The Labour Forecasting Tool was run twice for each project. Figure 1 shows an
example output for project 6 for all 26 occupations.
322Forecasting and Decision Making
Figure 1: Labour forecast for Project 6 (total labour on the project)
An initial forecast was produced for the 19 of the 26 SOCs which are site-based. The
outputs from the tool for this are shown in Table 3 for both the peak workforce (which
may only last for one month) and the average workforce over the whole project. This
average workforce uses Chan et al.'s (2006) conversion to number of jobs. The
number of jobs created by the project as published is also shown. For project 2, which
is split between Scotland and the North West, an average of the outputs for the two
regions was used. This implies the assumption that the project is equally split between
the two regions. It should be noted that there is a 5% difference in tender price indices
between these regions.
Table 3: A comparison of the site-based jobs created
Project Number of Total Jobs Created Site-based Jobs Created
jobs created
as advertised LFT Forecast - LFT Forecast - LFT Forecast - LFT Forecast -
Peak average Peak average
(% difference) (% difference) (% difference) (% difference)
1 200 431 (116%) 303 (52%) 276 (38%) 174 (-13%)
2 250 1290 (416%) 593 (137%) 834 (234%) 359 (44%)
3 350 361 (3%) 158 (-55%) 232 (-34%) 100 (-71%)
4 450 2127 (373%) 1463 (225%) 1359 (202%) 934 (108%)
5 500 1947 (289%) 1378 (176%) 1243 (149%) 879 (76%)
6 300 587 (96%) 438 (46%) 376 (25%) 280 (-7%)
7 350 1873 (435%) 1302 (272%) 1173(235%) 831 (137%)
8 700 2554 (265%) 1806 (158%) 1631 (133%) 1153 (65%)
Table 3 also shows the results for the second run of the tool for all 26 occupations.
This produces an estimate of the total number of people involved in the project
including both the site and non-site based staff. Table 4 explores the impact of
323Forbes, El-Haram, Horner and Lilley
spreading the construction spends equally over each year of construction. From this
and the number of jobs advertised by the developer the jobs per average spend per
year can be seen. The table shows that there is a marked difference in the number of
jobs which have been forecast. For comparison the number of jobs created using
industry wide averages proposed by Scottish Enterprise have been included. These
multiply the average spend by the coefficient of 13.3 jobs/£m. The total number of
jobs per average spend of output is shown alongside. These show no correlation
between the number of jobs advertised and the outputs from the LFT.
Table 4: An approximation of coefficients used in published articles
Number Jobs/average
of jobs spend/year (LFT
created outputs)
Project Number Jobs/average using
Project Average of jobs spend/year industry-
value Duration spend created as (as wide Total Site
(£m) (years) (£m)/year advertised advertised) average
1 30 2 15 200 13.33 200 20.20 9.80
2 34 1.67 20 250 12.25 272 29.65 17.95
3 40 2 20 350 17.50 266 7.90 5.00
4 150 2.75 55 450 8.25 727 26.60 16.98
5 320 2 160 500 3.13 2133 8.61 5.49
6 350 6 58 300 5.14 777 7.55 4.83
7 445 3 148 350 2.36 1977 8.80 5.61
8 647 3 216 700 3.25 2875 8.36 5.34
DISCUSSION
The Labour Forecasting Tool is a unique tool which offers the opportunity to forecast
the labour demand on a project at a very early stage in the UK. There are limitations
associated with the use of the tool as it uses average outputs from historic projects and
applies them to a new project. However, at an early planning stage it is not practical to
produce a detailed build-up of labour that will be subject to much change. The LFT
offers a quick estimate of the labour demand
The results presented in Table 3 shows that on the whole the Labour Forecasting Tool
produces higher estimates of the number of jobs created from new-build construction
work than those published.
There are a number of reasons why this might be the case. Whilst a developer wishes
to promote their credentials by generating a large number of jobs from a new-build
construction they may also wish this to be downplayed. Increasingly planning
requirements are being placed on contractors to train a proportion of their workforce.
Developers therefore may have a vested interest in keeping published figures as low
as possible.
One of the key items that ought to be noted in the outputs is the differences between
the peak and the average workforces. The peak workforce is dependent upon the lead
and lag times for each occupation and the shape of the s-curve that has been derived
for each occupation. The data presented in Table 3 shows some marked differences
between the peak and the average workforces produced by the LFT. In some cases
324Forecasting and Decision Making
these result in a reduction of 50% from peak to average. However, it should be noted
that at some point in the peak month or months the number of people employed on the
site will be equal or close to the peak workforce. However, it is unlikely that this will
be sustained for more than handful of weeks. The project duration taken from Table 2
will also have an impact on the peak. A longer project than anticipated will have a
lower peak; a shorter project will have a higher peak. It is clear from Table 2 that most
of the projects have had their duration rounded to a yearly period. Therefore the exact
peak labour demand may vary.
One particular sector forecast which should be used with caution is the infrastructure
sector. This is a particularly broad sector ranging from tunnelling, highways, water
treatment etc. Therefore it is difficult without greater degrees of granularity to produce
detailed forecasts. This applies to projects 1, 3 and 7. However, the LFT outputs for
these projects are not at the extremes of the divergence from the advertised number of
jobs.
Table 4 shows that the variations in the number of jobs advertised do not vary in
proportion to the project values. This is not unexpected as the sources of the articles
vary, as do the reasons for publication. However, in effect they are all making the
same claims and ought therefore to provide relatively consistent results. There is no
consistency with the average spend per year. All of the projects, except 8 produce jobs
per average spend that are below that proposed by Scottish Enterprise and 8 is within
the range suggested by One North East. Using the industry wide figures proposed by
Scottish Enterprise creates a forecast number of jobs that is greater than advertised in
all the projects except 8. These figures are more closely aligned with the values
forecast by the LFT.
CONCLUSIONS
The culmination of five years of research is a Labour Forecasting Tool which can
generate an indication of the likely labour demand on a project at a stage when only
minimal information is known about the project. It can act as a useful tool in
workforce planning and in influencing employment and skills plans. There are
obvious limitations to the tool given the stage at which it is designed to be used. It
cannot be used to accurately plan and programme a specific project but instead
provide guidance to the skills needs when no other information is available. The tool
is fully functioning and usable at the seven sector level and current work is exploring
how it can be populated with additional data at a greater degree of granularity. This
work is focussing primarily on the infrastructure sector and the application to
tunnelling, and energy generation projects.
The data underlying the tool is derived from a range of sources and its reliability has
been tested by triangulating the outputs from national statistical data, actual out turn
data from sites and theoretical approach from bills of quantities. All of the data sets
were independent of each other and converge towards the same values. This would
lead to the conclusion that a degree of accuracy can confidently be placed in the
results of the tool. The research presented in this paper has compared the LFT outputs
with the forecasts from the developers in the press and also the approaches proposed
by Scottish Enterprise. The LFT outputs are aligned with the values from Scottish
Enterprise even though they are divergent from the developers' articles. This would
suggest that the LFT is an appropriate tool for government agencies and departments
to use to predict the labour demand from construction projects.
325Forbes, El-Haram, Horner and Lilley
The comparisons that have been undertaken between the numbers of jobs created as
published by developers and as forecast by the LFT have highlighted some marked
differences that exist. In most cases the total number of jobs predicted in the news
articles is an underestimate compared to the LFT for both the peak and the average
workforce values. Whilst it is difficult to draw any particular conclusions about the
causes of this without obtaining further background information and data pertaining to
the project it is vital that any figures relating to "jobs created" are treated very
carefully. The context for which the numbers are presented ought to be clearly stated.
It should be clear whether the total of people employed relates to a peak or average
workforce. It has been shown that the impact of this can be substantial and can have
an impact on training levels and the development of employment and skills plans.
REFERENCES
Anumba, C E H, Dainty, A, Ison, S and Sergeant, A (2006) Understanding structural and
cultural impediments to ICT system integration: A GIS-based case
study. Engineering, Construction and Architectural Management, 13(6), 616-33.
Ball, M and Wood, A (1995) How many jobs does construction expenditure generate?
Construction Management and Economics, 13(4), 307-18.
Chan, A P C, Chiang, Y H, Mak, S W K, Choy, L H T and M.W.Wong, J (2006) Forecasting
the demand for construction skills in Hong Kong. Construction Innovation:
Information, Process, Management, 6(1), 3-19.
Forbes, D, El-Haram, M, Horner, M, Hatton, D and Evans, A (2009) Estimating the labour
demand for housing construction. In: Dainty, a R J (Ed.), Procs 25th Annual ARCOM
Conference, 7-9 September 2009, Albert Hall, Nottingham. Association of
Researchers in Construction Management, 1, 655-63.
+RUQHU0DQG'XII5 ³0RUHIRU/HVV
$FRQWUDFWRU VJXLGHWRLPSURYLQJSURGXFWLYLW\
LQFRQVWUXFWLRQ´/RQGRQ
&,5,$
HM Government (2008) Strategy for Sustainable Construction. [Available online from:
http://www.berr.gov.uk/files/file46535.pdf], accessed 10 June 2008
Office for National Statistics (2008) Construction Statistics Annual (No. 9). Basingstoke:
Palgrave Macmillan.
Office for National Statistics (2010) Construction Statistics - Chapter 17 - Appendices, No. 11
[available online from: http://www.ons.gov.uk/ons/rel/construction/construction-
statistics/no--11--2010-edition/chapter-17---appendices.pdf]. Accessed 24 August
2011
Office for National Statistics (2012) Gross Domestic Product: Preliminary Estimate, Q1 2012
[Available online from: http://www.ons.gov.uk/ons/dcp171778_263578.pdf],
accessed 30 April 2012.
One North East (2010) Combined Indicators Technical Note: Single Programme ± Jobs
[available online from:
www.onenortheast.gov.uk/object/download.cfm?lib=liDownload&id= 16401],
accessed 19 December 2011
Proverbs, D G Holt, G D, Olomolaiye, P O (1999) A method for estimating labour
requirements and costs for international construction projects at inception. Building
and Environment, 34 (1) pp 43-48
326You can also read