Internet Scale Experimental Design and Deployment for Educational Games using BrainPOP
←
→
Page content transcription
If your browser does not render page correctly, please read the page content below
Internet Scale Experimental Design and Deployment for
                  Educational Games using BrainPOP®
            John C. Stamper, Derek Lomas, Carnegie Mellon University, Pittsburgh, PA
                        Dixie Ching, New York University, New York, NY
                             Karina Linch, BrainPOP, New York, NY
                       Steve Ritter, Carnegie Learning, Inc. Pittsburgh, PA
 Email: john@stamper.org, dereklomas@gmail.com, dixieching@gmail.com, karinal@brainpop.com,
                                  sritter@carnegielearning.com

        Abstract: Large-scale online design experiments (A/B testing, multivariate testing,
        etc.) are increasingly important for online gaming sites that seek to optimize game
        mechanics, but for most developers the ability to collect data and run experiments
        requires custom experimentation and data logging systems. We present an approach
        that combines a novel digital number line game and a free game portal popular
        among teachers and students to allow multiple experiments to be executed
        simultaneously. A pilot study conducted over six months resulted in the collection of
        millions of data points representing hundreds of thousands of participants in dozens
        of experimental conditions. These results indicate that this approach can be
        successfully implemented at a large-scale. Furthermore, analysis of player logfile
        data revealed insights into learning and game play that can inform the next round of
        experiments creating a continuous feedback loop. Finally, limitations of the study as
        well as future work are discussed.

Introduction
Games for learning are a hot area for research and funding, but it is often unclear what learning is
taking place. To what extent can learning be measured during gameplay? One approach is to collect
log file data and analyze it using pre-determined engagement and learning metrics. Once that has
been established, it then becomes possible to conduct multivariate tuning to optimize learning and
engagement. However, performing online A/B experiments in the lab or classroom do not involve
numbers of subjects that could sufficiently power comparison studies that may involve upwards of 20
conditions. In this paper, we describe our method of wide-scale online experimentation, using a
popular online educational game portal among schools called BrainPOP's GameUp™ as an integral
part of our experimental framework to optimize specific design features in a novel digital math
fractions game. We also report on our implementation of an online “design experiment,” comprising
dozens of conditions, hundreds of thousands of participants and over a million unique trials. Finally,
we briefly discuss the limitations of such experiments and how insights made at this level can then be
used to inform smaller scale lab or school level experiments to validate the results.

Background and Related Work
While the preschool and kindergarten years are a crucial time to help children develop a conceptual
foundation for whole number sense (Baroody, Bajwa, & Eiland, 2009; Griffin, 2004), the ability to
approximate magnitudes of complex numbers, such as fractions and decimals, becomes important
starting in the 3rd grade (Common Core State Standards Initiative, 2011). Results from both national
assessments and smaller-scale studies indicate that demonstrating good “fraction sense” is an
important foundational skill that is lacking in many students. The 2004 National Assessment of
Educational Progress assessment indicated that only half of 8th-graders were able to correctly order
three fractions from least to greatest (NCTM, 2007). Furthermore, when presented with the problem
“What is the best estimate of 12/13 + 7/8?” the majority of a nationally representative sample of U.S.
eighth graders chose 19 and 21 rather than 2 (Carpenter, Corbitt, Kepner, Lindquist, & Reys, 1981).
Difficulties in dealing with fractions have led the National Mathematics Advisory Panel (2008) to
conclude “The most important foundational skill not presently developed appears to be proficiency
with fractions (including decimals, percent, and negative fractions). The teaching of fractions must be
acknowledged as critically important and improved before an increase in student achievement in
algebra can be expected” (p. 18).

In 2010, responding to numerous studies describing the challenges faced by American students in
fractions learning, the Institute for Education Sciences released a practice guide that strongly
advocated for the use of number lines for improving students’ understanding of fractions (Siegler et

                                                                                                   275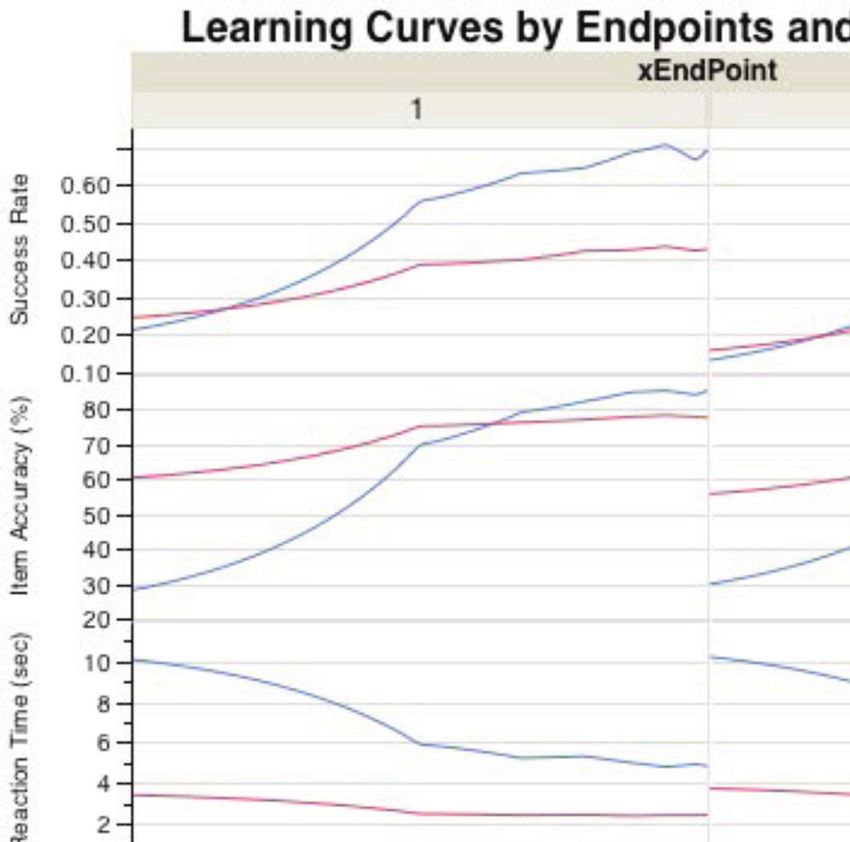
al., 2010). Number lines are a common instructional tool in Asian countries (Ma, 1999; Moseley,
Okamoto, & Ishida, 2007; Watanabe, 2006). They may also be used as assessment tools for
measuring number sense. Notably, recent work by Siegler, Thompson, and Schneider (2011) shows
that the accuracy of number line estimation with fractions correlates with standardized test scores in
6-8th grade. This finding extends prior research on number line estimation with decimals (Schneider,
Grabner, & Paetsch, 2009) and whole numbers (Booth & Siegler, 2008), which found that accuracy
predicted standardized test scores in grades K-5.

Given the strong relationship between number line estimation accuracy and math achievement, it is
interesting to consider whether or not a computer-based number line game may help improve math
understanding. Such games have been used to investigate motivational features of learning
environments (Malone, 1981) and to improve conceptual knowledge of fractions (Dugdale & Kibbey,
1975; Math Snacks, 2010). In one study by Rittle-Johnson, Siegler and Alibali (2001), a simple digital
game called Catch the Monster provided practice in estimating the location of decimals on a number
line. The authors found that improving number line estimation accuracy transferred to other
conceptual skills, such as the ability to compare the magnitudes of different decimal values. Also,
providing an engaging way for students to identify the location of fractional magnitudes on a number
line should help clarify the relationship between fractions and whole numbers. In the next section, we
describe a computer game that was developed to support number line estimation accuracy.

Battleship Numberline
Battleship Numberline (BSNL) is a Flash-based number line game designed to help students develop
an accurate and integrated understanding of “number sense,” which is defined as “the ability to
approximate numerical magnitudes” (Booth & Siegler, 2006). A screen shot of BSNL can be seen in
Figure 1.

Figure 1: Battleship Numberline in Ship mode where players type in a fraction to estimate the
                             ship’s position on the numberline.

In BSNL, players make estimates about the location of “enemy” ships or submarines by deducing
their locations on a number line. There are two main modes: Ship mode and Submarine mode. In
Ship mode, players type a number to estimate the position of the ship on a number line. In Submarine
mode, players are presented with a number that indicates the location of a hidden submarine, and the
player needs to click on the location of the number line that they believe corresponds to the number.
While BSNL offers number line practice in several domains—whole numbers, domains, fractions, and
units of measurement—in this paper, we focus on experiments conducted with players accessing the
fractions level of BSNL.

Experiments
By teaming up with BrainPOP and their new GameUp web portal (www.brainpop.com/games), we
have been able to collect data from over 1,000 players per day. BrainPOP, founded in 1999, creates
animated, curriculum-based content that engages students, supports educators, and bolsters
achievement. The GameUp portal, a free resource that showcases top online educational game titles

276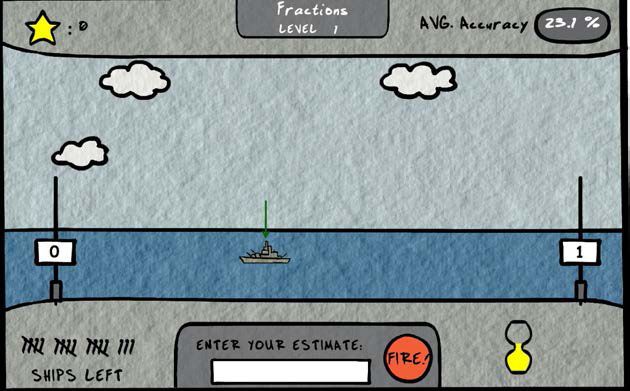
and offers materials to facilitate the effective use of games in the classroom, currently features over
four dozen games and has attracted an average of 1.3 million unique pageviews/month during the
school year. BSNL was originally linked into the GameUp portal in July 2011 and we have been
collecting data since that time. Figure 2 shows the distribution of 377,772 page views for BSNL that
were collected via the portal from July 2011 until the end of January 2012. While large-scale online
experiments have been done on game portals such as Kongregate (Andersen, Liu, Snider, Szeto, &
Popović, 2011), using a game portal that is popular in schools produces a different type of
experimental population: students using mini-games in a classroom setting. This graph clearly shows
the cyclical nature of students accessing the game during the school week with lulls every weekend
represented by the dips in the graph. Also, we note the big jump that occurred on August 13th when
BSNL was the featured game on the GameUp site and the huge drop off over the holiday break in
December 2011.
Figure 2: Page View data of BSNL from BrainPOP for July 2011 through January 2012
In Figure 3, the 51,140 page views for January 2012 are show in more detail. Although we have
limited data on who is actually playing the game, the graph clearly shows the drop off each weekend
which again bolsters the claim that most of the game use is taking place during the school day.
Looking a bit deeper into the log data we see that these page views translate into almost 100,000
rounds of the game played and 986,089 individual problem attempts. Collecting this amount of data
from the classroom in a single month using a traditional experimental design would have been
impossible.
Figure 3: BSNL page views over January 2012.
Game Design “Super Experiments”
Our activities are informed by the Super Experiment Framework, which involves conducting
experiments at various scales—Internet, lab, and school—with each component providing findings
that may be used to answer specific questions that might have been difficult or impossible to answer
using one of the other scales (Stamper, Lomas, Ching, Ritter, Koedinger, & Steinhart, 2012). Various
components can be used to expand or validate findings of the other components. For example,
Internet-scale experiments can identify areas of focus for lab-scale experiments, which can then be
validated in school-scale experiments.
While a traditional classroom or laboratory experiment may involve dozens or even hundreds of
subjects, online game research can involve thousands or even hundreds of thousands of subjects.
This increased scale creates the opportunity to design a large number of experimental conditions.
Large factorial design experiments offer a simple and straightforward mechanism for producing useful
experiments. Rather than randomly assigning players to a specific experimental condition, as is the
norm for quantitative research studies, we simply randomize the presentation of various design
factors. Given that a design factor has been randomly assigned to players, we are able to statistically
infer the effect of this factor on player engagement and learning. In order to systematically measure
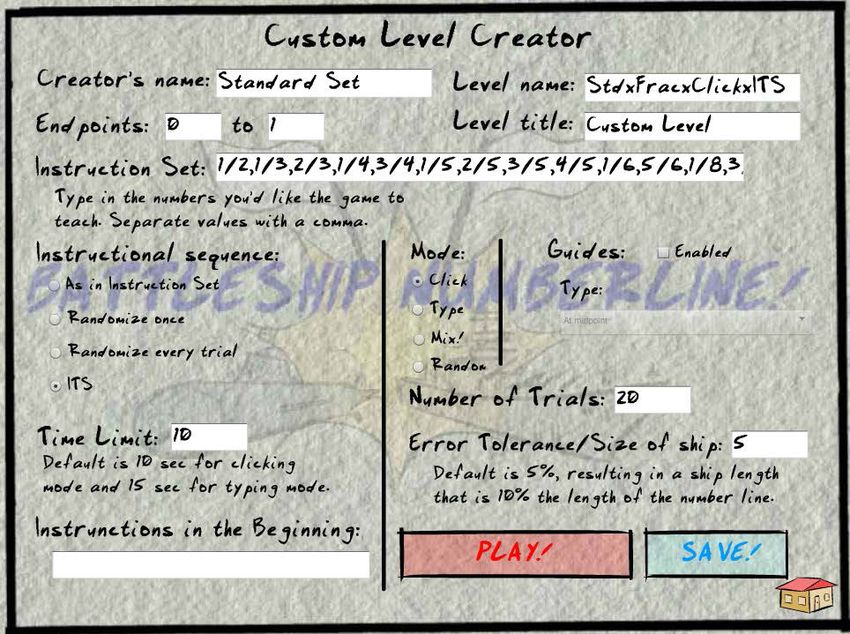
learning and engagement, we implement various design factors as flexible XML-based parameters
277that can be determined at game runtime. An intuitive editor allows us to create specific instructional
units by modifying XML game parameters, which include end points, time limit, percent accuracy
required for success, items to be tested, and the order (randomized or non-randomized) in which
these items will be presented (Figure 4). Overall, the level builder allows for the creation of specifically
tailored intervention units.
Figure 4: XML Level Editor for BSNL
Analysis of Experiments
From March 26, 2012 to April 26, 2012, we conducted an online experiment on GameUp involving 6
different design factors, each with 2-10 different factor levels. This resulted in 121,500 unique
experimental conditions. However, because we were primarily interested in the 2- and 3-way
interactions between the different design factors, ~50,000 game players (as subjects) were more than
sufficient for analysis.
Design Number of Example Factor Level Description
Factor Factor Levels
Game Mode: 2 Ship Ship mode (typing a number to
correspond to the visible position of the
ship) or Submarine mode (clicking on the
line to estimate the location of a hidden
submarine, in response to a number
presented)
Endpoints: 3 0-1 The numbers displayed on the endpoint
flags in figure 1
Item set: 10 3/8, 3/7, 4/5, 2/5, 3/10, The numbers (or locations, in ship mode)
7/8, 1/6, 9/10, 7/10, 1/5, presented in each level. Can be in
1/3, 1/8, 1/2, 5/8, 5/6, fraction, decimal or whole number form.
1/10, 3/4, 3/5, 2/3, 1/4
Time limit: 9 10 The number of seconds permitted before
time runs out.
Error 9 5% This determines the size of the ship,
Tolerance: where a 5% error tolerance makes the
ship 10% of the line. A bigger ship is
easier to hit with an inaccurate estimate.
Tickmarks: 5 none Tick marks can be shown at the midpoint
278or at 3rds, 4ths, 5ths, 10ths of the line.
Item 5 Random without This includes random order, ordered as
Sequencing: replacement listed, or a series of different adaptive
sequencing algorithms, such as Bayesian
Knowledge Tracing (Lomas et al 2012)
Table 3: Design factors deployed in the March 26, 2012 super experiment
A primary goal of our research has been to elucidate the underlying factors behind creating effective
educational games that are intrinsically motivating to play. We are currently using three metrics to
measure in-game learning: changes in embedded pre-test to post-test scores, changes in early-game
to late-game performance, and the learning curve documented by performance over opportunities to
demonstrate mastery of a certain schema or knowledge component (Baker, Habgood, Ainsworth, &
Corbett, 2007). We operationally define player engagement primarily in terms of the amount of time
spent playing a game, final level achieved, and the number of items attempted (Lomas & Harpstead,
2012).
During gameplay, BSNL log file data system records player performance (reaction time, success rate
and percent absolute error, defined as the absolute value of the actual location of the ship minus the
player’s estimated location, divided by the length of the number line) at each opportunity against the
game’s pre-specified task characteristics. With either of these performance measures, we can then
plot learning curves over the course of play. Learning curves are typically logarithmic, where early
practice opportunities produce much more improvement than subsequence practice opportunities.
Figure 5: Learning curves for ship mode (where players are given a location and type a
corresponding fraction) versus sub mode (where players are given a fraction and click a
corresponding location). Endpoint 1 is from 0-1 while endpoint 2 is from 0-2. Data was
collected as part of the March 26, 2012 super experiment; the above data included only players
in the fraction domain who played over 30 items in total.
Many small experiments take place within a single super experiment. For instance, we can
investigate the main effects of error tolerance on player engagement. Error tolerance within BSNL
refers to the size of the ship on the number line. In Figure 5, the ship has an error tolerance of 5%,
where any estimate that is within 5% will register as a “perfect hit” (as opposed to a “partial hit” or
“miss). A bigger ship has a bigger error tolerance, and is therefore easier to hit with an inaccurate
279estimate. In the March 26 super experiment, we randomized the size of the ship at 9 different levels
(2%, 3%, 4%, 5%, 8%, 10%, 12%, 15%, and 20%). At 20% error tolerance, the ship was very large:
almost 40% of the number line! While making the game easier has a significant effect on engagement
(length of play), the effect diminishes and even eventually appears to reverse. This results in an
inverted U-shaped curve reflects dominant theories of game enjoyment (Koster, 2005), which hold
that players prefer a balanced challenge.
Implications for Design
A simple heuristic can guide game designers who wish to measure learning within a game: repeat
and randomize. Repetition of items or levels allows for a within subject comparison over multiple
opportunities. Randomization allows for a between subject comparison, where analysts can consider
whether the randomized design factor had a significant effect on learning (in comparison between
subjects that received a given design factor level and those that did not). Regardless of one’s
understanding of statistics, game designers can typically produce games that allow for learning
measurement if they remember: “Repeat and Randomize.”
Games can generate enormous amounts of data. Rather than collecting data at every change in
state of the game, learning game designers may find it useful to limit data collection to each
opportunity to succeed or fail at a challenge presented.
Conclusions and Future Work
Our findings to date demonstrate that significant differences in player performance, learning, and
engagement occur due to differing game configurations. This strongly suggests that we can
systematically improve the quality of our games based on user-generated data. Technology has
presented us with new options for deploying and collecting massive amounts of data using the
Internet and popular game portals such as BrainPOP’s GameUp. The main contribution of this paper
is to show how, with proper design, educational games can be deployed at Internet scale to collect
abundant amounts of data addressing multiple experiments in a very short amount of time.
The primary limitation of this internet-scale research is the ambiguity of the user base since the
experiments are conducted anonymously. To address this problem we are currently conducting lab
and controlled classroom experiments in conjunction with the web based experiments in order to test
how well the online experiments correlate with lab experiments and controlled classroom
experiments. We plan to report our activities at the various scales, as they pertain to the goal of
identifying and accumulating empirical evidence for fractions estimation learning in BSNL.
References
Andersen, E., Liu, Y. E., Snider, R., Szeto, R., & Popović, Z. (2011). Placing a value on aesthetics in
online casual games. Proceedings of the 2011 Annual Conference on Human Factors in
Computing Systems (pp. 1275–1278).
Baker, R., Habgood, M., Ainsworth, S., & Corbett, A. (2007). Modeling the acquisition of fluent skill in
educational action games. User Modeling, 4511, 17-26.
Baroody, A. J., Bajwa, N. P., & Eiland, M. (2009). Why can’t Johnny remember the basic facts?
Developmental Disabilities Research Reviews, 15(1), 69–79.
Booth, J. L., & Siegler, R. S. (2008). Numerical magnitude representations influence arithmetic
learning. Child Development, 79, 1016-1031.
Carpenter, T. P., Corbitt, M. K., Kepner, H. S., Lindquist, M. M., & Reys, R. E. (1981). Results from
the Second Mathematics Assessment of the National Assessment of Educational Progress.
Washington, DC: National Council of Teachers of Mathematics.
Common Core State Standards Initiative. (2011). Mathematics | Grade 3 | Number and Operations—
Fractions. Retrieved from: http://www.corestandards.org/the-standards/mathematics/grade-
3/number-and-operations-fractions/
Dugdale, S., & Kibbey, D. (1975). Fractions curriculum of the PLATO Elementary School Mathematics
Project. Computer-based Education Research Laboratory. University of Illinois, Urbana, IL.
Griffin, S. (2004). Teaching number sense. Educational Leadership, 61(5), 39–43.
Kostner, R. (2005). A theory of fun for game design. Paraglyph Press. Scottsdale, Arizona
Lomas D., Ching D., Stampfer, E., Sandoval, M., Koedinger, K. (2012). Battleship Numberline: A
digital game for improving estimation accuracy on fraction number lines. Conference of the
American Education Research Association (AERA).
280Lomas, D., Stamper, J., Muller, R., Patel, K., Koedinger, K. (2012) "The Effects of Adaptive
Sequencing Algorithms on Player Engagement within an Online Game" In the Proceedings of
the 11th International Conference on Intelligent Tutoring Systems (ITS2012), Chania, Greece.
Lomas, D., & Harpstead, E. (2012). Design space sampling for the optimization of online educational
games. Submitted to CHI’12, May 5–10, 2012, Austin, Texas, USA.
Ma, L. (1999). Knowing and teaching elementary mathematics: Teachers’ understanding of
fundamental mathematics in China and the United States. Mahwah, NJ: Lawrence Erlbaum
Associates.
Malone, T.W. Toward a theory of intrinsically motivating instruction, Cognitive Science, 1981, 4, 333-
370 (Reprinted in D. F. Walker and R. D. Hess (eds.) Instructional Software, Wadsworth
Publishing Co., 1984).
Math Snacks (2010). Math Snacks Annual Report (September, 2009 – May 2010): Addressing Gaps
in Conceptual Mathematics Understanding with Innovative Media. Available at:
http://mathsnacks.com/print/2010_report_Findings.pdf
Moseley, B. J., Okamoto, Y., & Ishida, J. (2007). Comparing US and Japanese elementary school
teachers’ facility for linking rational number representations. International Journal of Science
and Mathematics Education, 5, 165-185.
National Council of Teachers of Mathematics. (2007). The learning of mathematics: 69th NCTM
yearbook. Reston, VA: National Council of Teachers of Mathematics.
National Mathematics Advisory Panel. (2008). Foundations for success: The final report of the
National Mathematics Advisory Panel. Washington, DC: National Academies Press.
Rittle-Johnson, B., Siegler, R. S., & Alibali, M. W. (2001). Developing conceptual understanding and
procedural skill in mathematics: An iterative process. Journal of Educational Psychology, 93,
346-362.
Schneider, M., Grabner, R. H., & Paetsch, J. (2009). Mental number line, number line estimation, and
mathematical achievement: Their interrelations in Grades 5 and 6. Journal of Educational
Psychology, 101, 359-372
Siegler, R., Carpenter, T., Fennell, F., Geary, D., Lewis, J., Okamoto, Y., ! Wray, J. (2010).
Developing effective fractions instruction for kindergarten through 8th grade: A practice guide
(NCEE #2010-4039). Washington, DC: National Center for Education Evaluation and
Regional Assistance, Institute of Education Sciences, U.S. Department of Education.
Retrieved from http://ies.ed.gov/ncee/wwc/publications/practiceguides
Siegler, R. S., Thompson, C. A., & Schneider, M. (2011). An integrated theory of whole number and
fractions development. Cognitive Psychology, 62(4), 273-296.
Stamper, J.C., Lomas, D., Ching, D., Ritter, S., Koedinger, K., & Steinhart, J. (2012).
th
The Rise of the Super Experiment. 5 International Conference on Educational Data Mining
(EDM 2012), June 19-21, Chania, Greece.
Watanabe, T. (2006). The teaching and learning of fractions: A Japanese perspective. Teaching
Children Mathematics, 12, 368-374
281You can also read