Characterizing the Evolution of Communities on Reddit.
←
→
Page content transcription
If your browser does not render page correctly, please read the page content below
Characterizing the Evolution of Communities on Reddit.

AUTHOR(S) REMOVED FOR BLIND REVIEW,
One of the most important structures in social networks is communities. Communities in social networks evolve over time. Under-
standing the evolution of communities is useful in many applications, such as building successful communities, maintaining the
success of communities, etc. There have been some works on studying online communities such as understanding the life cycle of users
and understanding the loyalty of members in a community. An aspect of online community studies that have not been sufficiently
studied is the evolution of communities over time. In this work, we investigate factors that significantly differentiate the different
parts of the evolution of communities. Firstly, we identify the different patterns that can exist in the evolution of communities. Next,
we examine how different features differentiate parts of the patterns identified. Experimental results showed that the linguistic style
of users who make posts and the interaction dynamics of members in a community are related to different parts of communities’
evolution with respect to the number of active users.

CCS Concepts: • Human-centered computing → Empirical studies in HCI.

Additional Key Words and Phrases: communities, evolution

ACM Reference Format:
Author(s) removed for blind review. 2020. Characterizing the Evolution of Communities on Reddit.. In SMSociety ’20: International
Conference on Social Media and Society, July 22–24, 2020, Chicago, IL. ACM, New York, NY, USA, 10 pages.

1   INTRODUCTION
In the study of social networks, a great deal of attention has been paid to characterizing, detecting, and analyzing
community structure [8]. Communities exist in many aspects of social interactions. For example, in a friendship network,
a community might represent a group of individuals with some shared interest. Understanding the structure of such
groups can assist in various applications, such as suggesting future friends to other users [2]; additionally, by studying
these groups, researchers gain insight into the nature of human interactions. Similarly, in the network of purchases
made by customers from online retail stores, a community could represent a group of customers with similar purchase
trends. Identifying such groups of customers helps set up efficient recommendation systems [12], and characterizing
the structure of these groups gives deeper understanding of purchasing habits.
    The majority of work on network communities has focused on characterizing static community structure and
extracting such communities from networks [8]. However, in many applications, understanding the various evolution
patterns of a community aid in building and maintaining successful communities [11, 21]. For instance, if there exist a
community with an understanding of the factors related to their growth, the moderators of this community can modify
the design or operation of this community to ensure successful growth. Similarly, in the above example of a purchasing
network, understanding how customers’ preference change over time can aid in providing real time recommendations.
There has been some work on identifying communities in dynamic settings [14, 19] and examining the evolution of

Permission to make digital or hard copies of all or part of this work for personal or classroom use is granted without fee provided that copies are not
made or distributed for profit or commercial advantage and that copies bear this notice and the full citation on the first page. Copyrights for components
of this work owned by others than ACM must be honored. Abstracting with credit is permitted. To copy otherwise, or republish, to post on servers or to
redistribute to lists, requires prior specific permission and/or a fee. Request permissions from permissions@acm.org.
© 2020 Association for Computing Machinery.
Manuscript submitted to ACM

                                                                            1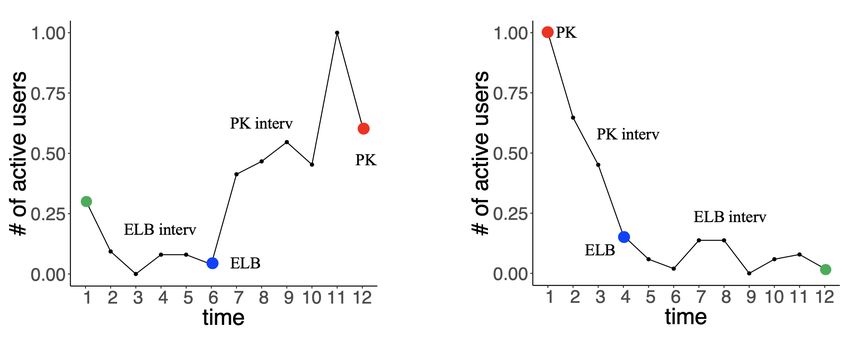
SMSociety ’20, July 22–24, 2020, Chicago, IL                                                  Author(s) removed for blind review

online communities [6, 7]. However, these studies have generally not explored the patterns, or categories, of evolving
communities.
    In this work, we perform an investigation on the Reddit social media platform, with the goal of identifying and
characterizing the various patterns of community evolution. Reddit is an ideal platform for our study, as users self-
organize into topic-specific subreddits, such as Science, Gaming, or Funny. In our study, we treat these subreddits as
communities, and investigate the factors that characterize the evolution of a subreddit with respect to the number of
active users (i.e., the number of users who either makes a submission or comment on another user’s submission or
comment during a specific time period).
    We first identify the various patterns that exist in the evolution of communities. Next, to identify factors that
characterize these patterns, we rely on a previous study of the ChangeMyView subreddit [15], which demonstrated that
the linguistic and interaction style of members was significantly related to whether those members were willing to
change their opinions. The ChangeMyView subreddit provides a platform for users to seek opinion change from members
of the community. If a user’s opinion is changed, that user issues a so-called ‘∆ point’, along with an explanation of
why her opinion changed. The ChangeMyView subreddit has attracted a great deal of attention in online community
studies because of its ability to provide a clear user intent and a clear signal when a message is perceived as persuasive
[16]. We explore how the user behaviors observed from the earlier study relate to patterns of community evolution. We
learn that the linguistic and interactions style of members in a community can significantly differentiate the different
parts of the evolution of a community with respect to the number of active users.
    Our investigation reveals three community evolution patterns (beginning at some point in time): (1) Communities
that start to increase in number of active users, (2) Communities that start to decrease in number of active users, and (3)
Communities that switch between increasing and decreasing the number of active users. Experiments showed that
a community’s ability to attract more users at the middle part of conversations in that community is related to the
number of active users over time. Additionally, we observed that conversations about leisure and those with higher
demonstration of positive emotions do not attract people.

2    RELATED WORK
Communities in social networks have been of great interest. For example, Blondel et al. [3] demonstrated how a
community detection algorithm could identify different groups of users in a phone network. The users studied in this
work were customers of a Belgian phone company and the calls between members of this company. Every customer
spoke at least one of the following languages: French, Dutch, English or German. From this network, it was interesting
to find that the groups corresponded to customers who spoke a particular single language. Communities in a network
can also help identify the patterns of communication in an organization. In [22], authors used an email network to
identify the communities of practice based on communication between email addresses. Communities of practice are
the informal networks of collaboration that organically grow within organizations. Communities in social networks
have also been demonstrated to be useful in uncovering different hierarchical structures [4, 5, 13, 18]
    Another interesting aspect of communities that has gained popularity in the literature is the evolution of communities
over time. There have been numerous studies related to the evolution of communities. Tan proposed a framework
for building genealogy graphs [21]. The authors investigate the relationship between the origin of a community and
its future growth. It was found that strong parent connections are associated with future community growth. Also,
the authors study the individual behavior of early members of communities. It was found that the early members of
communities tend to have a diverse portfolio.
                                                             2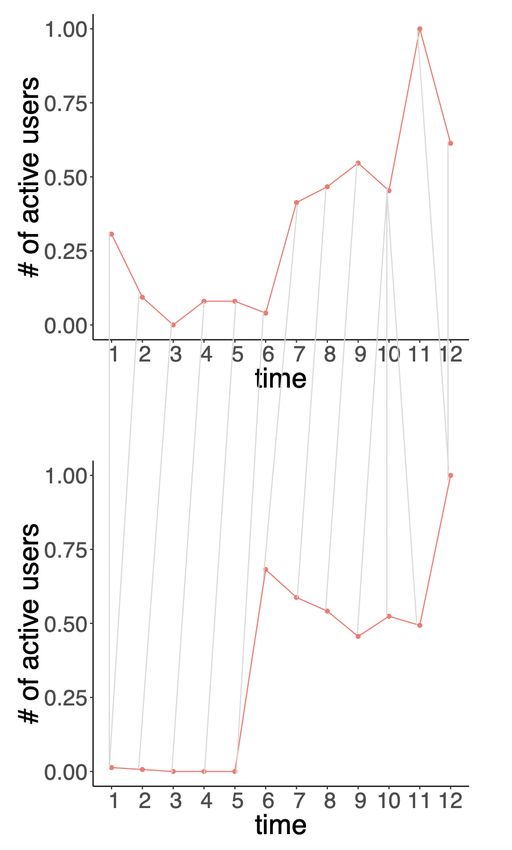
Characterizing the Evolution of Communities on Reddit.                               SMSociety ’20, July 22–24, 2020, Chicago, IL

    The authors in [7] proposed a framework for tracking linguistic changes and how users react to evolving norms of a
community. It was observed that users follow a two-stage lifecycle regarding their susceptibility to linguistic change:
the learning phase and the conservative phase. In the learning phase, users become receptive to the norms of the
community up to about one third of their eventual lifespan. In the conservative phase, users cease to respond to the
norms of the community.
    In [6], the authors propose different community success measures such as growth in number of members, retention
of members, long term survival of the community and volume of activities within the community. The authors in
[10] investigated how two types of growth affect the formation of online groups. The types of growth examined were
diffusion growth, where groups attract new members through ties to existing members and non-diffusion growth where
individuals with no ties to groups become members themselves. The authors found that even though group clustering
increases the diffusion growth of a group, groups that grow primarily through diffusion growth reach smaller sizes.
    Despite the numerous works on communities and their evolution, none of these works (and do not claim to) identify
patterns of community evolution.

3     METHODOLOGY
Our goal in this study is to understand the factors that
characterize the different parts of a community’s evolu-
tion.

3.1     Data and preprocessing
The data used for this study are communities on Reddit
(subreddits). We obtain Reddit communities that were
created in 2014 and 2015.
    Different communities on Reddit have different modus
                                                                             (a) Distribution of submissions
operandi: while some communities allow members to
post textual contents and upload images, others allow
only the upload of images, or only text. We focus only
on communities that allow their members to post text.
This is because if we considered communities that allow
only the upload of images (and no text), it would not be
possible to examine language usage across communities.
    In order to examine the evolution of communities, we
consider the record of a community within 1 year of its
                                                                              (b) Distribution of comments
creation. We use a monthly timestep for all communities
studied. To track the evolution of communities, we con- Fig. 1. Distribution of the number of submissions made in each
sider the number of active users at each timestep. The community (Figure 1(a)) and the number of comments received in
number of active users at a given timestep is the number   each community(Figure 1(b)). The x-axis represents a community’s
                                                           ID (sorted) while the y-axis indicates the number of submissions
of users who either make a post or comment on another      and comments on a logarithmic scale, respectively, made in each
user’s post or comment. For us to better understand com-   community.
munities’ evolution before and/or after the communities
become inactive, we consider only communities that were
                                                           3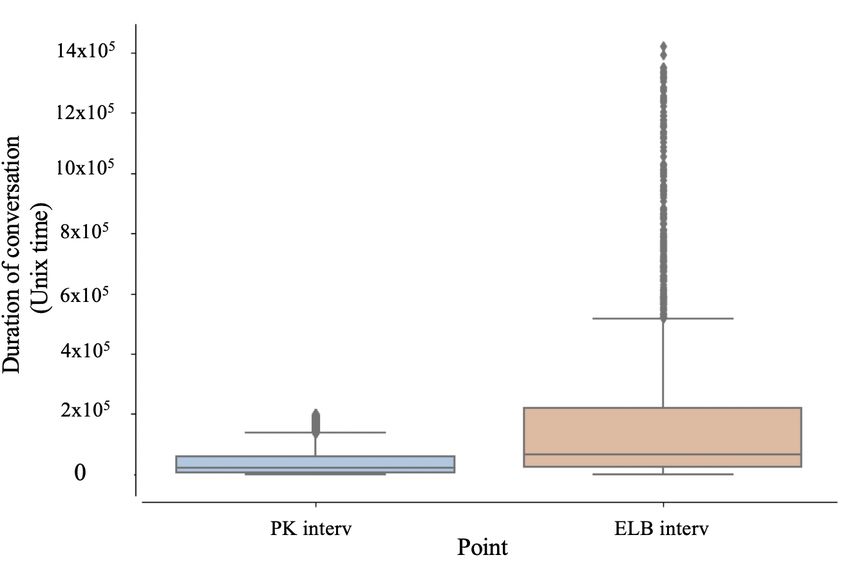
SMSociety ’20, July 22–24, 2020, Chicago, IL                                                                      Author(s) removed for blind review

inactive at some point in their evolution. Additonally, there are some communities that have very few members within
a year of its creation. We consider such communities as uninteresting. To exclude such unexciting communities, we
only consider communities that attracted at least 100 members within three months.
   After this preprocessing, we are left with 2430 communities. These communities had, in total, 1,172,662 submissions
with 8,686,646 comments from 969,120 unique users. Figure 1(a) shows the distribution of submissions for each
community and Figure 1(b) shows the distribution of comments for each community.
   In this work, we study the evolution of each of the 2,430 communities over 12 month-long timesteps. In order to
ensure fairness in the comparison of evolutions of different communities, we normalize the number of active users at
each timestep to a value between 0 and 1. For a given community C i , the normalized value Vtnorm (C i ) of the number of
unique users active at timestep t is given by

                                                                     Vt (C i ) − min(H (C i ))
                                                 Vtnorm (C i ) =                                 ,
                                                                   max(H (C i )) − min(H (C i ))
   where Vt (C i ) is the number of unique users active at timestep t and H (C i ) is a list of active users for the 12 timesteps
for community C i .

3.2      Identifying evolution patterns
To characterize the different evolution patterns of commu-
nities, we need to first identify these patterns. We identify
the patterns by computing the similarity between the evo-
lution of different communities. This similarity matrix is
then clustered to determine the evolution patterns that
exist.
   The similarity of the evolution of two communities is
computed using a popular time series similarity technique
referred to as Dynamic Time-Warping (DTW) [20]. DTW
was selected because of its ability to capture similarities
between two evolution patterns regardless of the speed
of evolution. The DTW between community Ci at time
k and community C j at time l is defined as
                                                                              Fig. 2. DTW similarity between two growing communities.

                  DTW (Cik , C lj )   = min(DTW [Cik −1 ][C lj ], DTW [Cik −1 ][C lj −1 ], DTW [Cik ][C lj −1 ]) + d(Cik , C lj ),
   where Cik is the number of active users of community Ci at time k and d(m, n) is the absolute difference between m
and n. The sum of all similarities between the timesteps represent the similarity between community Ci and C j . Figure
2 shows the mapping of two community based on the similarity between their timesteps computed using DTW.
   After identifying the similarities between communities’ evolutions, we then group these communities based on their
similarities. We use hierarchical agglomerative clustering to group the evolutions [23]. Hierarchical agglomerative
clustering is a technique used to group data points into clusters. The process begins with each point considered as a
cluster. At each step, a cluster is formed by combining the two closest points. The process is repeated until one single
cluster is formed. Dendrograms provide a means to visualize the groupings to make decision on the optimal cluster size.
                                                                          4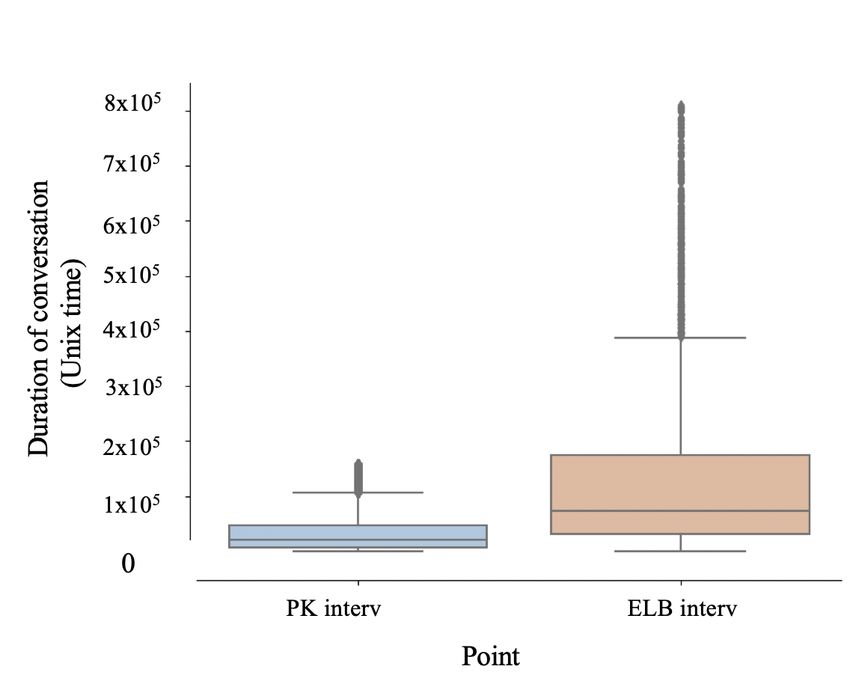
Characterizing the Evolution of Communities on Reddit. SMSociety ’20, July 22–24, 2020, Chicago, IL
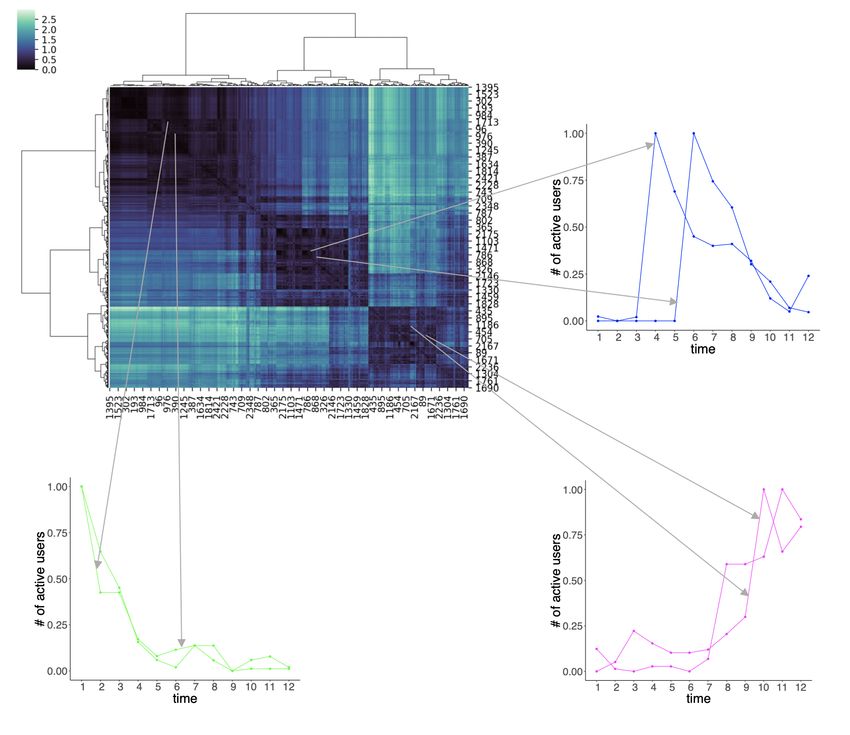
Fig. 3. Clusters obtained by grouping the evolution patterns of communities on Reddit. Three clusters were selected as the optimal
number of clusters. We interpret the three clusters as communities that increase in the number of active users (purple); communities
that decrease in the number of active users (green); and communities that switch between increasing and decreasing in number of
active users (blue).
Figure 3 shows the similarities between the evolution of communities studied in this work, and the resulting
dendrogram obtained by clustering their similarities and sample community evolutions for each of the identified groups.
Three clusters were selected as the optimal number of clusters. This is because this value has the largest vertical
distance that does not intersect any of the other clusters. We interpret the three clusters as communities that start to
increase in the number of active users from some point forward during the evolution (growing communities), those
that start to decrease in the number active users from some point forward during the evolution (failing communities)
and communities that switch between increasing and decreasing the number of active users (unstable communities).
3.3 Characterizing the evolution of communities
After identifying the patterns that exist in the evolution of communities, we investigate the factors that can significantly
distinguish the different parts of the evolution. In order to examine these parts, we first divide the patterns into different
parts and investigate how the interaction style of members and the language usage can distinguish these different parts.
For the three evolution patterns identified (growing, failing and unstable communities), we focus on growing
communities (G0) and failing communities (G1). We focus on these two groups because the third group is a combination
of the failing and growing pattern. Each evolution pattern is divided into 4 parts:
5SMSociety ’20, July 22–24, 2020, Chicago, IL Author(s) removed for blind review
Fig. 4. Parts of an evolution pattern for growing community (Left) and failing community (Right). Each evolution is divided into 4
parts: peak point (PK), elbow point (ELB), elbow interval (ELB interv) and peak interval (PK interv).
(1) Peak point (PK): The peak point is the timestep where a community reaches the largest number of active users.
For the growing communities, we treat the last point of the evolution as the peak point. For the failing community,
we treat the starting point of the evolution as the peak point.
(2) Elbow point (ELB): For a growing community, this is the period after which the community begins to increase
in the number of active users. For a failing community, this is the period after which a community begins to
decrease in the number of active users over time.
(3) Peak interval (PK interv): This is the period between the peak point and elbow point.
(4) Elbow interval (ELB interv): For the growing communities, the elbow interval is the period between the elbow
point and the period when the evolution started. With the failing communities, this is the period between the
elbow point and the end of the evolution.
Figure 4 shows the various parts of the evolution of a growing community and a failing community.
We consider two sources of features: the interaction style of members within a community and the language usage
of members who initiate conversations.
Interaction style of members: Previous work observed that the different interaction styles of a person on Reddit’s
ChangeMyView can characterize how susceptible the person is to an opinion change [15]. Similarly, in [1], the authors
identified how the early interaction style of members in a conversation on Facebook can characterize how likely it is
for the post to attract more comments. We therefore postulate that the interaction dynamics of users can distinguish
the different parts of a community’s evolution.
We consider two features as a means of capturing the interaction dynamics at some point of a community’s evolution:
the duration of a conversation, and the point when members of a community are active during a conversation. The
duration of a conversation is the period between when a submission was made, and the last comment made by a user on
the submission. In order to minimize the effect of outlier comments influencing the characterization of a conversation,
we consider only interactions between the 10th to 90th percentile of the time points within a conversation. To capture
how active members are during a conversation, we partition the duration of a conversation into three parts- early,
middle, and late- by dividing the interval between the start and end time of the periods considered into three equal-time
intervals.1 For each part we consider the fraction of interactions within each part of the conversation. For each of
these interaction dynamics feature, we investigate if there is any significant difference between (1) the peak and elbow
points of conversations. (2) peak and elbow intervals of conversations. We test for significance using a non-parametric
1 This
describes how we partition the dynamics of a conversation, in contrast to the earlier peak point/elbow point intervals, which were about the
dynamics of a community.
6Characterizing the Evolution of Communities on Reddit. SMSociety ’20, July 22–24, 2020, Chicago, IL
(Mann-Whitney Test) test of significance. We selected a non-parametric approach because the assumptions for normality
fails from our kurtosis test.
(a) Interactions for growing communities (b) Interactions for failing communities
Fig. 5. The fraction of interactions at the early (start), middle and latter (end) parts of conversations for growing (Left) and failing
(Right) communities when comparing peak and elbow intervals. Most interactions occur at the early part of conversations. The
middle part of conversations has the lowest number of interactions. The peak intervals (PK interv) have a significantly larger number
of interactions at the middle part of conversation than the elbow intervals (ELB interv).
From our experiments, we observed similar interactions style regarding the activities at different parts of a con-
versation for both the growing communities and the failing communities. Specifically, we find that most interactions
of a conversation occur at the early part of conversations. The middle part of a conversation has the least number of
interactions regardless of whether the community is growing or failing. Even though the middle part of a conversation
has the least fraction of interactions for both groups of communities, the fraction of interactions during the middle part
of a conversation for the peak interval is significantly larger than that of the elbow interval. For significance testing, we
use a Bonferroni corrected α of 0.005. Figures 5(a) and 5(b) show the fraction of interactions at the different parts for
the growing communities and failing communities respectively when comparing peak and elbow intervals.
A similar observation was made when we consider the peak point and elbow point. This suggests that for most
conversations, users join the conversation either when it starts, which is the reason for higher fraction of interactions
at the early part, and when the conversation is about to end. Since the middle part of the peak portions of communities’
evolutions are significantly higher than the elbow parts, it also suggests that communities’ ability to attract more people
at the middle part of conversations within the community is related to the number of active members of the community.
Regarding the duration of conversations, it was observed that the peak parts of communities’ evolution had signifi-
cantly shorter conversations than the elbow parts for both growing communities and failing communities. Figures 6(a)
and 6(b) show a plot of the durations for the growing and failing communities when comparing the peak intervals. A
similar observation was made when comparing the peak points of the growing and failing communities. A possible
reason why the peak parts have shorter conversation could be as a result of the communities’ increase in the number of
active users. This corroborate previous findings in [1] that the amount of time it takes for a post on Facebook to attract
comments is indicative of whether or not the thread will attract more comments.
Language usage of conversation initiators: The language usage of authors in social media has been demonstrated
to be a good source of information in varied applications. A previous study on the ChangeMyView community [15]
7SMSociety ’20, July 22–24, 2020, Chicago, IL Author(s) removed for blind review
(a) Durations for growing communities (b) Durations for failing communities
Fig. 6. Duration of conversations when comparing peak (PK interv) and elbow (ELB interv) intervals of growing communities (Figure
6(a)) and failing communities (Figure 6(b)). The conversations that started at the peak intervals were significantly shorter that those
that started at the elbow intervals.
Table 1. LIWC categories that showed significant differences between the peak and elbow intervals of growing and failing communities.
Growing communities Failing communities
CATEGORY PK Interv ELB Interv PK Interv ELB Interv
clout - ++ ++ -
six letter words (sixltr) - ++ ++ -
positive emotions (posemo) - ++ - ++
leisure - ++ - ++
time ++ - - ++
cognitive process (cogproc) ++ - - ++
showed that the linguistic style of users can characterize the susceptibility of users in that community. In [7], the authors
demonstrated how linguistic changes in communities are useful in understanding how users react to the evolving
norms of a community. Additionally, the linguistic style of users have been shown to be useful in characterizing users
that are loyal to communities [9]. We therefore believe the language used by authors may be useful in characterizing
the different parts of a communities’ evolution.
In this study, we investigate how the language style of conversation initiators can characterize the different pats
of a community’s evolution. We perform a LIWC analysis [17] on the submissions made at the different parts of a
community’s evolution. In LIWC analysis, psychologically meaningful categories are provided along with the associated
words. The representation of such a category in the input text is calculated by the percentage of the words of the
category in the text. A list of such categories can be found at [17]. Table 1 presents the LIWC category comparison for
growing and failing communities when considering peak and elbow intervals.
The Posemo category of LIWC demonstrates an author’s display of positive emotion in writing [17]. Some posemo
words are ‘happy’, ‘pretty’, ‘good’, ‘love’, ‘nice’, ‘sweet’, etc. A higher score of posemo indicates the usage of words
related to positive emotions. From the experiments, it was observed that conversations that were initiated at the peak
8Characterizing the Evolution of Communities on Reddit. SMSociety ’20, July 22–24, 2020, Chicago, IL
intervals had significantly fewer words related to positive emotions in comparison to the elbow intervals of both the
growing and failing communities. Results on the leisure category, which considers words like ‘music’, ‘movie’, ‘cook’,
etc. indicates that members are not attracted to conversations about leisure. A possible reason for this could be that at
the elbow parts, most of the submissions made by users are about their leisure activities which does not excite users
to participate in such conversation. Also, when people demonstrate more positivity in their writings, people are not
attracted to such conversations hence the reason why the elbow parts have higher posemo and leisure scores than the
peak parts.
Clout quantifies the demonstration of higher expertise and confidence in writing. A high Clout means that the
author of a post demonstrates high expertise and is confident in her submission [17]. For the growing communities, we
observe that the elbow intervals have significantly higher Clout than the peak intervals. For the failing community, we
observe that the peak intervals have significantly higher Clout than the elbow intervals. For the failing communities, a
possible reason for this observation could be that people generally don’t like to participate in conversations by people
who are overly confident and that could be a reason for the decrease in the number of active users at the elbow interval.
For the growing communities, even though it starts off with a higher Clout, the overall behavior at the elbow interval
is lower than LIWC’s mean Clout value of 57.95.
Regarding the language usage of members who initiate conversations in different communities, for growing commu-
nities, the early part of evolution where there is less activity has conversations that are more related to leisure and a
higher demonstration of positive emotions in comparison to periods where communities demonstrate more activity,
as shown in Table 1. Conversely, for failing communities, the early part of communities’ evolution where there is
more activity has conversations less related to leisure and a lesser demonstration of positive emotions in comparison
to periods where the communities have less activity as shown in Table 1. It is therefore reasonable to suggest that
conversations about leisure and those with higher demonstration of positive emotions do not attract people.
4 CONCLUSION
In this work, we investigated factors that can characterize the evolution of communities. First, we identified patterns
that exist in the evolution of communities. For the patterns identified, we considered two main parts of each pattern:
the parts with more active users and parts with less active users. Next, we explored two main sources of information in
characterizing the two main parts of patterns identified: (1) language usage of authors in a post and (2) interaction
style of users in a conversation. For the language usage, we performed LIWC analysis as a means of understanding
the language used by an author. To study interaction style, we considered two features as a means of capturing the
interaction dynamics: duration of a conversation and when members of a community are active during a conversation.
Experimental results showed that for both communities increasing in number of active users and those decreasing
in number of active users, most members participated in the early part of conversations and the fewest members
participated at the middle part. Also, the middle part of conversations is related to the community’s active users
over time regardless of whether the community is increasing or decreasing in number active users. On the duration
of conversations, parts with more active users tend to have shorter conversations. Regarding the language usage,
conversations about leisure and those with higher demonstration of positive emotions do not attract people regardless
of whether the community is increasing or decreasing in active users.
9SMSociety ’20, July 22–24, 2020, Chicago, IL Author(s) removed for blind review
REFERENCES
[1] L. Backstrom, J. Kleinberg, L. Lee, and C. Danescu-Niculescu-Mizil. 2013. Characterizing And Curating Conversation Threads: Expansion, Focus,
Volume, Re-Entry. In Proceedings of WSDM. 13–22.
[2] A. Biswas and B. Biswas. 2017. Community-based link prediction. Multimedia Tools and Applications 76, 18 (2017), 18619–18639.
[3] V. D. Blondel, J. Guillaume, R. Lambiotte, and L. Etienne. 2008. Fast Unfolding of Communities in Large Networks. Journal of Statistical Mechanics:
Theory and Experiment 2008, 10 (2008), P10008.
[4] A. Chakraborty, Y. Kichikawa, T. Iino, H. Iyetomi, H. Inoue, Y. Fujiwara, and H. Aoyama. 2018. Hierarchical Communities in Walnut Structure of
Japanese Production Network. (02 2018).
[5] F. Chen and K. Li. 2015. Detecting Hierarchical Structure of Community Members in Social Networks. Know.-Based Syst. 87, C (2015), 3–15.
[6] T. Cunha, D. Jurgens, C. Tan, and D. Romero. 2019. Are All Successful Communities Alike? Characterizing and Predicting the Success of Online
Communities. In The World Wide Web Conference (WWW ’19). New York, NY, USA, 318–328.
[7] C. Danescu-Niculescu-Mizil, R. West, D. Jurafsky, J. Leskovec, and C. Potts. 2013. No Country for Old Members: User Lifecycle and Linguistic
Change in Online Communities. In Proceedings of the 22Nd International Conference on World Wide Web (WWW ’13). 307–318.
[8] S. Fortunato. 2010. Community detection in graphs. Physics Reports 486, 3 (2010), 75 – 174.
[9] W. Hamilton, J. Zhang, L. Lee, C. Danescu-Niculescu-Mizil, D. Jurafsky, and J. Leskovec. 2017. Loyalty in Online Communities. In Proceedings of
ICWSM.
[10] S. R. Kairam, D. J. Wang, and J. Leskovec. 2012. The Life and Death of Online Groups: Predicting Group Growth and Longevity. In WSDM ’12.
[11] R. E. Kraut, P. Resnick, S. Kiesler, Y. Ren, Y. Chen, M. Burke, N. Kittur, J. Riedl, and J. Konstan. 2012. Building Successful Online Communities:
Evidence-Based Social Design. The MIT Press.
[12] G. Li, Z. Cai, G. Yin, Z. He, and M. Siddula. [n.d.]. Differentially Private Recommendation System Based on Community Detection in Social Network
Applications. Security and Communication Networks 2018 ([n. d.]).
[13] E. Massaro and F. Bagnoli. 2014. Hierarchical Community Structure in Complex (Social) Networks. Acta Physica Polonica B Proceedings Supplement
7 (02 2014).
[14] H. Mensah and S. Soundarajan. 2018. Sampling Community Structure in Dynamic Social Networks. In Recent Trends and Future Technology in
Applied Intelligence, Malek Mouhoub, Samira Sadaoui, Otmane Ait Mohamed, and Moonis Ali (Eds.). Springer International Publishing, 114–126.
[15] H. Mensah, L. Xiao, and S. Soundarajan. 2019. Characterizing Susceptible Users on Reddit’s ChangeMyView. In Proceedings of the 10th International
Conference on Social Media and Society (SMSociety ’19). ACM, New York, NY, USA, 102–107.
[16] E. Musi, D. Ghosh, and S. Muresan. 2018. ChangeMyView Through Concessions: Do Concessions Increase Persuasion? CoRR abs/1806.03223 (2018).
http://arxiv.org/abs/1806.03223
[17] J. W. Pennebaker, R. J. Booth, R. L. Boyd, and M. E. Francis. 2015. Linguistic Inquiry and Word Count: LIWC2015.
[18] M. A. Porter, P. J. Mucha, M.E.J. Newman, and A. J. Friend. 2007. Community Structure in the United States House of Representatives. Physica A:
Statistical Mechanics and its Applications 386, 1 (2007), 414 – 438.
[19] G. Rossetti and R. Cazabet. 2018. Community Discovery in Dynamic Networks: A Survey. ACM Comput. Surv. 2, Article 35 (2018), 35:1–35:37 pages.
[20] H. Sakoe and S. Chiba. 1978. Dynamic Programming Algorithm Optimization for Spoken Word Recognition. IEEE Transactions on Acoustics, Speech,
and Signal Processing 26, 1 (1978), 43–49.
[21] C. Tan. 2018. Tracing Community Genealogy: How New Communities Emerge from the Old. ICWSM. AAAI (2018), 395–404.
[22] J. R. Tyler, D. M. Wilkinson, and B. A. Huberman. 2005. E-Mail as Spectroscopy: Automated Discovery of Community Structure within Organizations.
The Information Society 21, 2 (2005), 143–153.
[23] J. H. Ward. 1963. Hierarchical Grouping to Optimize an Objective Function. J. Amer. Statist. Assoc. 58, 301 (1963), 236–244.
10You can also read