Economic, Social and Urban Integration Rio de Janeiro Case Study - Instituto Pereira Passos
←
→
Page content transcription
If your browser does not render page correctly, please read the page content below
Instituto Pereira Passos
               WE KNOW RIO WELL

Economic, Social and Urban Integration
     Rio de Janeiro Case Study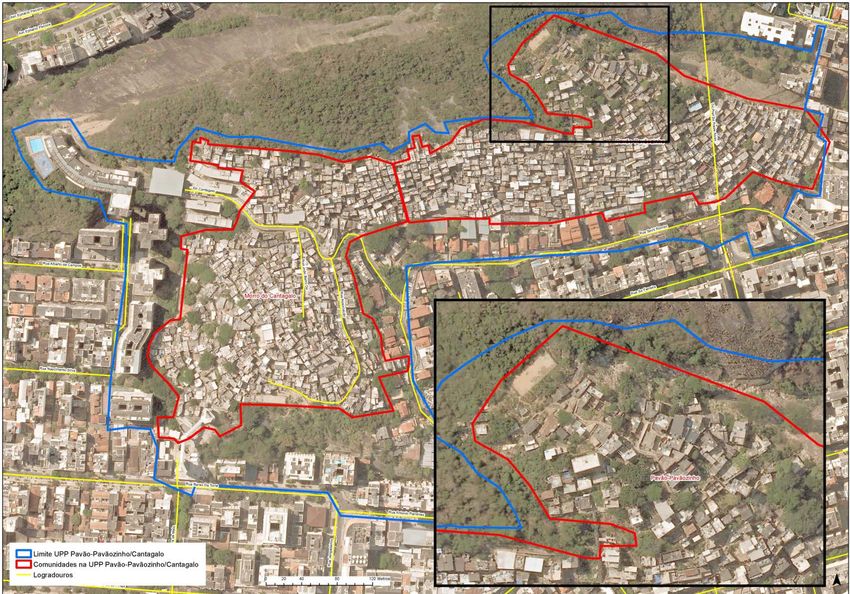
Brazil and Rio de Janeiro

                            RIO DE JANEIRO

             BRAZIL

        Brazil                     State of Rio de Janeiro                                            City of Rio de Janeiro

  • Population: 201 Mn         • Population: 16.4 Mn (2013)                                           • Population: 6.4 Mn
      (5th largest)                                                                           (40% between 15 and 39 years) (2010)
                                 • GDP: US$ 252 Bn (2011)
 • GDP: US$ 2,2 Tn (2012)                                                                  • 2nd largest city in Brazil and 3rd in Latam
                            • GDP per capita (2011): US$ 15.681
(6th economy in the world                                                                            • GDP: US$ 114 Bn (2011)
                              Equivalent to 11% of Brazils’ GDP
  – expected to be 5th by
          2016)             • Investment Grade as of March 2010                                   Equivalent to 5% of Brazils’ GDP
                                      1st state in Brazil                                            • 45% of State’s economy
 • GDP per capita: US$
     12,100 (2012)                  • HDI (2010): 0,761                                                 85% service related

• Growing Middle Class –                                                            • Investment Grade as of December 2010, upgraded in
 now represents 53% of                                                                                December 2011
      population                                                                                          • HDI (2010): 0,799
   • HDI (2010): 0,727

                                        Instituto Pereira Passos Economic, Social and Urban Integration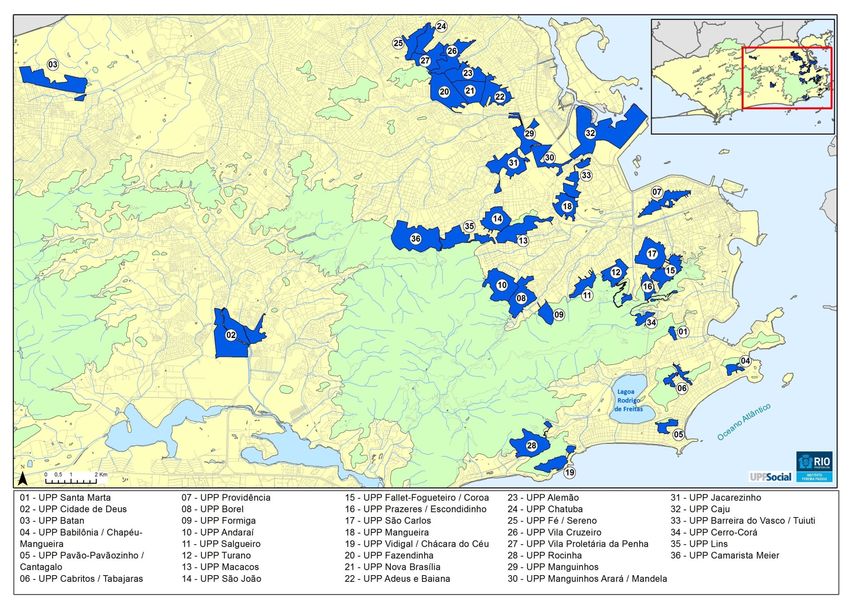
Pereira Passos Institute
About Us

Mission & Vision

•   Mission: to produce and manage information and knowledge about the City of Rio de Janeiro in
    order to subsidize public policy planning and urban interventions and to coordinate strategic
    projects that contribute to the improvement of living conditions, the exercise of citizenship and
    effectiveness of public management.

•   Vision: To be an international reference in knowledge management for strategic planning and
    integration and innovation of public policies, able to provide high quality technical services to
    agencies of the Municipality as well as articulating with other spheres of government, the
    private sector and the third sector.

                               Instituto Pereira Passos Economic, Social and Urban Integration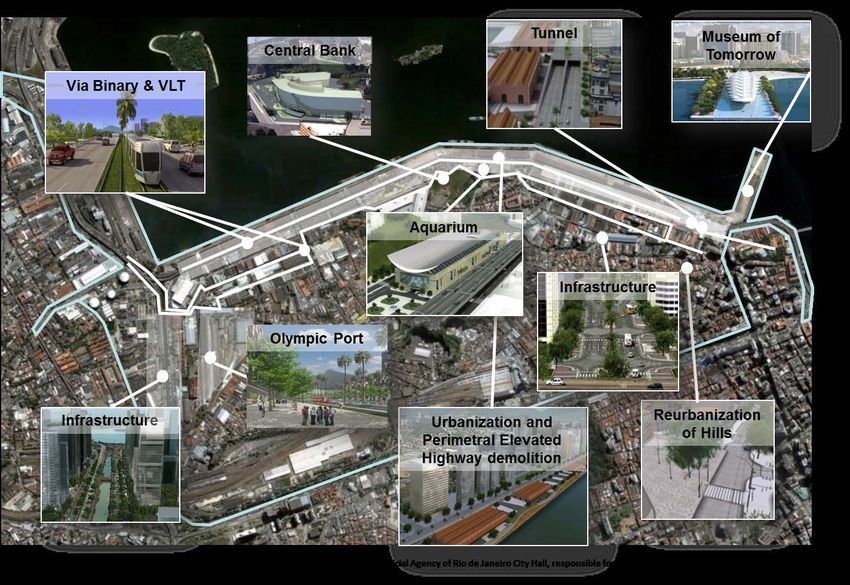
About Us

RIOPLAN          IPLANRIO                                    INSTITUTO PEREIRA PASSOS

                      KNOWLEDGE MANAGEMENT                                                                        IPP
                 Planning and       Urban projects,
                 Information         Cartography                               Desenvolvimento
                  Tecnology          and Statistics
                                                                  Economic                Social     Sustainability

1979   1981   1990           1998                     2009                         2010            2012

                1993 1994                       2007

                                              Planning of the
                                               Olympic bid.

                        Instituto Pereira Passos Economic, Social and Urban Integration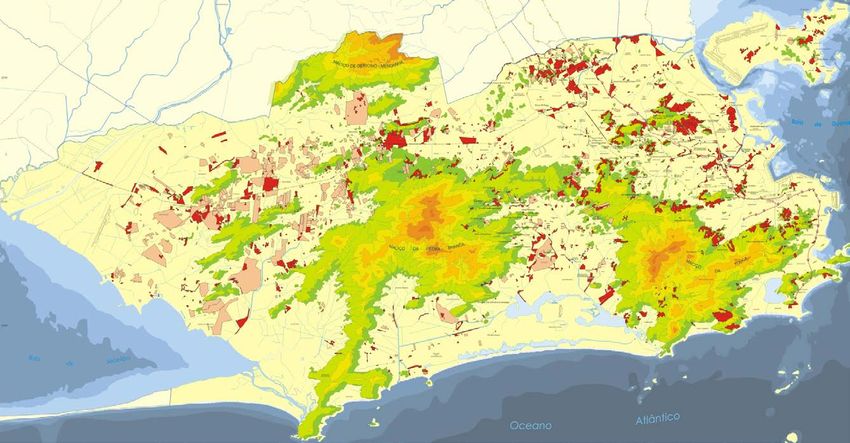
About Us

IPP: How we work

                                   Instituto Pereira Passos

                                          Strategic Economic
     Information on the                                                                     Special Projects
                                             Development
      City Department                                                                        Department
                                             Department

             Cartography,                               Fostering
            Georeferencing,                             inclusive
             Demographic,                              production                                   UPP Social
           Geographic, Social,                      through Culture,                                 Program
            Economic Data                              Sports and
               Analysis,                            Entrepreneurship

                          Instituto Pereira Passos Economic, Social and Urban Integration
Rio de Janeiro – Cadernos do Rio

                      http://www.armazemdedados.rio.rj.gov.br

    •   Understand the changes in the city between 2000 and 2010, the year of the latest census;
    •   Compare the city dynamics with other capitals, as well as in comparison to Brazil overall;
    •   Identify the differences within regions of the municipality, as well as the slums of the city of
        Rio, showing the different realities experienced by cariocas;
    •   Supply a detailed profile of each dimension of the social reality: demographics, youth,
        income and expenses, education, living conditions, religion, disabilities, migration and work
        force.

                              Instituto Pereira Passos Economic, Social and Urban Integration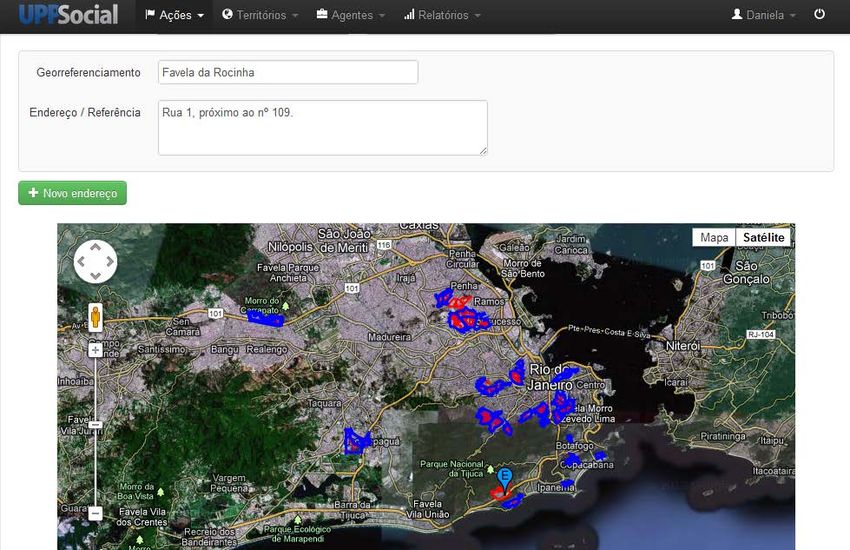
Rio’s Turnaround: Governance,
    Economy and Security
Rio de Janeiro – Momentum and Global Visibility

         © Rio Business: Official Agency of Rio de Janeiro City Hall, responsible for attracting and facilitating inward
                                                                                                            investments

                             Instituto Pereira Passos Economic, Social and Urban Integration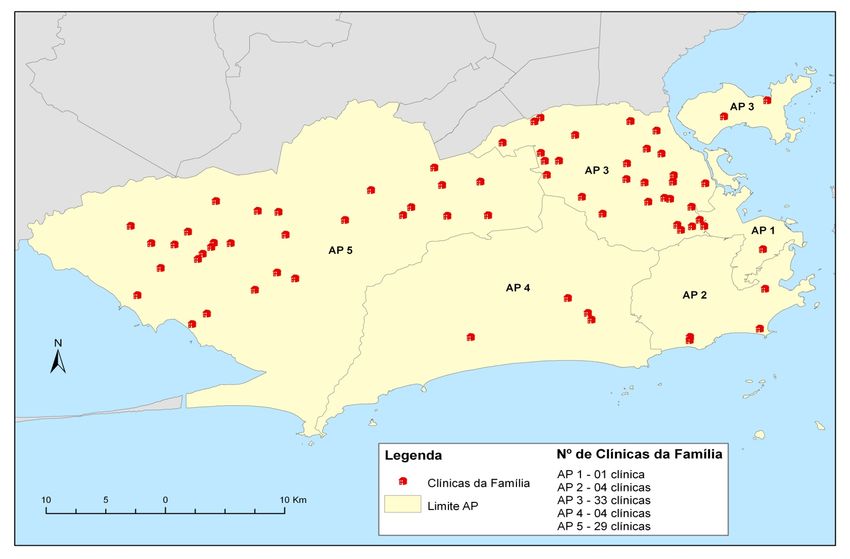
Rio de Janeiro – Global Events

  2010       2011                2012                   2013                   2014           2015         2016

         © Rio Business: Official Agency of Rio de Janeiro City Hall, responsible for attracting and facilitating inward
                                                                                                            investments

                            Instituto Pereira Passos Economic, Social and Urban Integration
Rio de Janeiro – The Turnaround
Reasons for Rio’s Turnaround: Governance, Economy and Security
• Increasing public awareness, reflection and mobilization
• Macroeconomic stability: the oil boom brought a
remarkable boost to the local economy
• Sustainability of Public Policies: focused on guaranteeing
benefits for future generations
• Turning point in public management: both at state and
municipal level, there has been a shift in the seriousness
of the administration and the policies implemented.
Instituto Pereira Passos Economic, Social and Urban IntegrationRio de Janeiro – Reasons for the Turnaround: Governance
Political Alignment at Three Levels of Government
Instituto Pereira Passos Economic, Social and Urban IntegrationCITY OF RIO - ACHIEVEMENTS TO DATE
Strategic Planning >Thinking Rio in 2020
• Project Management Office
• Implementation of a performance-base model >
MERITOCRACY
www.rio.rj.gov.br
• Improving Business Environment
•Comprehensive program to reduce bureaucracy
• Formalization of business and attraction of investors
• New Investment Agency: www.rio-negocios.com
Instituto Pereira Passos Economic, Social and Urban IntegrationRio de Janeiro – Reasons for the Turnaround: Governance
Fiscal Adjustment
• Investment Grade: Rio was the only municipality with the same rating as Brazil
NOW EVEN HIGHER
• Fiscal responsability and transparency:
• Increase in total revenues
• US$ 1 Bn World Bank Loan
• Estimated gains of US$ 1.25 Bn in a total debt of US$ 5Bn
• Expanding Rio de Janeiro’s investment capacity
• New Focus: Sustainability
• Fiscal, Economic, Social and Environmental
Instituto Pereira Passos Economic, Social and Urban IntegrationRio de Janeiro – Reasons for the Turnaround: Economy
In US$ Millions
INVESTMENTS TOTAL
%
YEAR EXPENDITURES
[A] [A]/[B]
[B]
2005 259.2 3,637.67 7.1%
2006 317.49 3,875.35 8.2%
2007 405.95 4,486.98 9.0%
2008 392.23 5,186.51 7.6%
2009 186.37 5,009.30 3.7%
2010 725.63 6,640.93 10.9%
2011 1,556.84 8,708.37 17.9%
2012 1,545.12 9,697.67 15.9%
Source: City Hall
Instituto Pereira Passos Economic, Social and Urban IntegrationRio de Janeiro – Reasons for the Turnaround: Economy
Fiscal Adjustment
2009 2012
Debt
Debt Repayment Investments Repayment
4% 15.9%
Investments 1%
3.7%
Staff
46%
Other Current
Expenses
28% Other Current
Staff Expenses
58% 35%
Debt Interest
6% Debt Interest
2%
Instituto Pereira Passos Economic, Social and Urban IntegrationRio de Janeiro – Momentum and Global Visibility
Instituto Pereira Passos Economic, Social and Urban IntegrationRio de Janeiro – Olympic Games
• A great opportunity to consolidate Rio’s turnaround
• Focus on investments that generate a permanent legacy for the citizens
• “The Olympic Games should serve the city. More than organizing the
event itself, we want to make Rio a better place for our citizens and guests
through profound transformations in transportation, urban infrastructure,
environment and social development”
• Olympic venues are being financed mainly
through partnerships with private investments
Instituto Pereira Passos Economic, Social and Urban Integration50% OF BRAZILIAN STOCK MARKET CAP IS www.cidadeolimpica.com
HEADQUARTERED IN RIO
INFRASTRUCTURE & URBANIZATION TRANSPORTATION
• Revitalization of the Sea Port Area • Implemented new intermodal system linking in
• 4 Olympic areas re-qualified, with full accessibility the express ways (BRTS), trains, ferry and subway
(150Km)
• Construction of Parque Olímpico in Barra
• Increase of high capacity transportation from
• Construction of an Olympic Training Centre (400 18% to 63%
athletes/day)
• Duplication of the City bike tracks to 300km
• At least 40% growth in hotels availability
Sustainability and Legacy
SOCIAL AND ECONOMIC DEVELOPMENT ENVIRONMENT
• Morar Carioca: all the favelas re-urbanized until • Recovery of the lagoon systems of Barra and
2020 (1,4 million people) Jacarepaguá
• Reforestation of more than 1.300 ha
• English teaching in the 1064 municipal schools
(530k students) • More than 700 thousand people with access to
sewage (West Zone)
• Practice of sports spread in the whole public
• Reduction of 16% on gas emissions by 2016
schools system
• Full Operation of a new Waste Facility in
Seropédica
Instituto Pereira Passos Economic, Social and Urban IntegrationThe main urbanization project
“PORTO MARAVILHA” PROJECT underway in Rio de Janeiro
Instituto Pereira Passos Economic, Social and Urban IntegrationEXISTING TRANSPORTATION INFRASTRUCTURE
SANTA CRUZ LINE
DESCRIPTION
SUBWAY
RAILWAY
CONNECTIONS
RAILWAY-BRT
SUBWAY-RAILWAY
SUBWAY-BRT
HTPR MAP
Instituto Pereira Passos Economic, Social and Urban IntegrationTRANSPORTATION PROJECTS
US$ 7,8 bi investments in new transportation projects and enhancement of the existing infrastructure
BRT Future
Station UFRJ
SANTA CRUZ LINE
PROJECTS
EXISTING
DESCRIPTION
BRT
FREE WAY
SUBWAY
RAILWAY
BRT TRANSOESTE
CONNECTIONS
RAILWAY-BRT
SUBWAY-RAILWAY
SUBWAY-BRT
HTPR MAP
Instituto Pereira Passos Economic, Social and Urban IntegrationRio de Janeiro and the Profile of the
Urban FavelasRio de Janeiro – Profile of the Urban Favela
Rio de Janeiro: Profile of the Urban Favela
• Geographically unique: low-income settlements exist within as well as around the affluent city
• Most are controlled by belligerent groups, financed by drug trafficking (apart from 36 UPPs)
• Lack adequate provision of basic public services and benefits provided for the rest of the
formal city (such as water, sanitation, waste collection, electricity, etc.)
• Informal living context: non-existent property rights, informal business, non-compliance with
local laws (taxes, construction, social order, etc.)
• Resident population tended to be disintegrated and excluded from the formal city.
Instituto Pereira Passos Economic, Social and Urban IntegrationDistribution of Favelas in Rio de Janeiro
Favelas (slums)
Irregular allotments
Instituto Pereira Passos Economic, Social and Urban IntegrationRio de Janeiro – Reasons for the Turnaround: Security
Police Pacification Units (UPPs)
• Reclaiming the territories controlled by belligerent drug trafficking groups
• As of march 2014, 28 territories have been pacified, with 36 UPPs installed
Goal:
40 UPPs by 2014.
Instituto Pereira Passos Economic, Social and Urban IntegrationRio de Janeiro – Reasons for the Turnaround: Security
Instituto Pereira Passos Economic, Social and Urban IntegrationRio de Janeiro – Profile of the Urban Favela
Rio de Janeiro: Profile of the Urban Favela
• Population of the city of Rio: 6.32 millions where 1.39 million live in favelas, or 22% of the
population.
• From 1991 to 2010 the population of the formal city grew by na average annual rate of 0.4%
while the favela grew by 2.4%.
Habitantes Densidade
UPPs / Territórios Número de
População (1) Domicílio por Área (m²) (2) Demográfica
Ocupados Comunidades
Domicílio (hab/ha) (3)
36 UPPs 185 540.530 164.171 3,29 14.223.914 380,01
Habitantes Densidade
Número de
Cidade Comunidades
População (1) Domicílio por Área (m²) (2) Demográfica
Domicílio (hab/ha) (3)
633 Favelas 1024 1.436.049 440.902 3,26 45.809.730 313,52
Rio de Janeiro - 6.320.446 2.146.340 2,94 570.917.463 110,7
Source: (1) Instituto Pereira Passos and IBGE, Demographic Census (2010).
(2) The area used to calculate the demographic density refers to the urbanized area.
(3) Net demographic density.
Instituto Pereira Passos Economic, Social and Urban IntegrationRio de Janeiro – Reasons for the Turnaround: Security
Reduction in Crime
• Rio has reduced it’s crime rate significantly with the targeted security policy initiated in 2008
• From the moment of the implementation of the UPP there is a significant reduction in lethal
violence (79%) and theft (66%), and a high increase in drug busts.
UPP Average occurences in pacified favelas per month per 1000,000 people
Implementation Lethal Violence Murder Theft Drug Bust
Before 10,33 3,37 61,23 24,13
After 2,21 0,87 20,58 63,93
Variation -79% -74% -66% 165%
Source: Violence Analysis Laboratory - UERJ . “‘Os donos do morro’: uma avaliação exploratória do impacto das Unidades de Polícia Pacificadora (UPPS) no Rio de Janeiro “
Instituto Pereira Passos Economic, Social and Urban IntegrationWorld Bank Study on Public Security in Brazil
http://documents.worldbank.org/curated/en/2013/0
1/17431113/making-brazilians-safer-analyzing-
dynamics-violent-crime
Instituto Pereira Passos Economic, Social and Urban IntegrationRio de Janeiro – Profile of the Urban Favela
Why do we need Targeted Policies for the Favelas?
• Precarious living standards: limited access to adequate basic services such as water, sanitation,
waste collection, electricity.
• Young population – favela undergoing demographic transition equivalent to the formal city in
the 1980’s
• High percentage of youth responsible for their household – early insertion into labor market
• Low average of education levels in favelas – low stock of human capital
• Average income of R$380 (USD$165) – geographic concentration of poverty
• Extensive informal economy – low integration into formal economy of the city
• Productivity gap: Even when controlling for demographic characteristics, social benefits and
employment rates there is still a significant income gap → lower productivity.
Instituto Pereira Passos Economic, Social and Urban IntegrationRio de Janeiro – Profile of the Urban Favela
Why do we need Targeted Policies for the Favelas?
• Brazil’s current growth stagnation can be attributed to a high dependence on commodities, on
low labor productivity and a relative distance between social programs (cash transfers such as
Bolsa Familia) and inclusive production of the labour force.
• Economic growth that is not founded on sustainable inclusive production generates high levels
inequality.
• The productivity gap existent in favelas highlight the demand for targeted policies that foster
inclusive production.
• Inclusive production can break the vicious cycles and poverty traps and promote long-term
sustainable growth.
Instituto Pereira Passos Economic, Social and Urban IntegrationRio de Janeiro – Profile of the Urban Favela
Average nominal per capita income of households:
City of Rio de Janeiro 2010
1,600
1,378.00
1,400
1,157.53
1,200
1,000
Renda Média (R$)
800
600
382.76
400
200
0
Total Favelas Não Favelas
Fonte: estimativas produzidas através da base de dados dos Dados Agregados do Censo 2010 por setor censitário, extraída em 25/07/2012.
Nota: Domicílios: domicílios particulares permanentes
Instituto Pereira Passos Economic, Social and Urban IntegrationRio de Janeiro – Profile of the Urban Favela
Percentage of dwellers in owned permanent households x
Nominal monthly per capita household income range: City of Rio de
Janeiro, 2010
40
Total Favela Não Favela
35
30
Porcentagem de Moradores (%)
25
20
15
10
5
0
Sem rendimento Até 1/4 salário mínimo Mais de 1/4 a 1/2 Mais de 1/2 a 1 salários Mais de 1 a 2 salários Mais de 2 salários
nominal mensal salário mínimo mínimos mínimos mínimos
Faixas de Salário
Fonte: estimativas produzidas através da base de dados dos Dados Agregados do Censo 2010 por setor censitário, extraída em 25/07/2012.
Nota: 1. A categoria Sem rendimento inclui as pessoas que receberam somente em benefícios.
Instituto Pereira Passos Economic, Social and Urban IntegrationRio de Janeiro – Profile of the Urban Favela
Integration of slum and non-slum regions: City of Rio de Janeiro, 2010
20
Total
18
Favelas
16 Não Favelas
Porcentagem de Domicílios (%)
14
12
10
8
6
4
2
0
Com esgotamento sanitário Com energia elétrica de companhia Com coleta de lixo inadequado Com abastecimento de água
inadequado distribuidora sem medidor inadequado
Indicadores
Fonte: estimativas produzidas através da base de dados dos Dados Agregados do Censo 2010 por setor censitário, extraída em 25/07/2012.
Nota: 1.Esgotamento sanitário inadequado: esgotamento sanitário via fossa rudimentar, via vala, via rio, lago ou mar, via outro escoadouro e domicílios particulares permanentes sem
banheiro de uso exclusivo dos moradores e nem sanitário.
2. Destino de lixo inadequado: Lixo queimado na propriedade, lixo enterrado na propriedade, lixo jogado em terreno baldio ou logradouro e lixo jogado em rio, lago ou mar.
3. Abastecimento de água adequado: Abastecimento de água de poço ou nascente na propriedade, abastecimento de água da chuva armazenada em cisterna ou com outra
Instituto Pereira Passos Economic, Social and Urban IntegrationRio de Janeiro – Profile of the Urban Favela
Age Pyramid: City of Rio de Janeiro, 2010
100 anos ou mais
95 a 99 anos
Homens
90 a 94 anos
Mulheres
85 a 89 anos
80 a 84 anos
75 a 79 anos
70 a 74anos
65 a 69 anos
60 a 64 anos
Faixas Etárias
55 a 59 anos
50 a 54 anos
45 a 49 anos
40 a 44 anos
35 a 39 anos
30 a 34 anos
25 a 29 anos
20 a 24 anos
15 a 19 anos
10 a 14 anos
5 a 9 anos
0 a 4 anos
5.00 4.00 3.00 2.00 1.00 0.00 1.00 2.00 3.00 4.00 5.00
Porcentagem de pessoas (%)
Fonte: estimativas produzidas através da base de dados dos Dados Agregados do Censo 2010 por setor censitário, extraída em 25/07/2012.
Nota: Foram consideradas pessoas residentes em domicílios particulares e coletivos.
Instituto Pereira Passos Economic, Social and Urban IntegrationRio de Janeiro – Profile of the Urban Favela
Age Pyramid, Slum: City of Rio de Janeiro, 2010
100 anos ou mais Homens
95 a 99 anos Mulheres
90 a 94 anos
85 a 89 anos
80 a 84 anos
75 a 79 anos
70 a 74anos
65 a 69 anos
60 a 64 anos
Faixas Etárias
55 a 59 anos
50 a 54 anos
45 a 49 anos
40 a 44 anos
35 a 39 anos
30 a 34 anos
25 a 29 anos
20 a 24 anos
15 a 19 anos
10 a 14 anos
5 a 9 anos
0 a 4 anos
5.0 4.0 3.0 2.0 1.0 0.0 1.0 2.0 3.0 4.0 5.0
Porcentagem de pessoas (%)
Fonte: estimativas produzidas através da base de dados dos Dados Agregados do Censo 2010 por setor censitário, extraída em 25/07/2012.
Nota: Foram consideradas pessoas residentes em domicílios particulares e coletivos.
Instituto Pereira Passos Economic, Social and Urban IntegrationRio de Janeiro – Profile of the Urban Favela
Percentage of illiterate residents of households 15 years old or older by
ethnicity and gender: City of Rio de Janeiro 2012
8
7
6
Porcentagem de pessoas (%)
5
4
3
2
1
0
Homem branco Mulher branca Homem negro Mulher negra
Sexo e Cor
Favelas Não Favelas
Fonte: estimativas produzidas através da base de dados dos Dados Agregados do Censo 2010 por setor censitário, extraída em 25/07/2012.
Nota: Domicílios: domicílios particulares e domicílios coletivos
Instituto Pereira Passos Economic, Social and Urban IntegrationDemand for Economic, Social and
Urban Integration
Targeted Public PoliciesInstituto Pereira Passos
WE KNOW RIO WELL
UPP Social Program1- Areas of work
State and
Residents Directives and Federal
Monitoring Governments
Entrepreneurs Municipal
Goals Government
Demand Supply Institutional
Territorial Integrated
Management Management
Actions
Local
Public Civil Society
Information
Agents
Community Information Private
Organizations Management Sector
Instituto Pereira Passos UPP SocialTargeted Policies: UPP Social
• Strategy of the City Hall to promote urban, social and economic integration of the areas of the
city benefiting from the Pacification Police Units (UPPs)
• Mission of mobilizing and articulating municipal services and policies in these territories by
understanding and qualifying local demand and articulating with local leaders and institutions
• The program coordinates efforts of the various agencies of the City Hall and promotes
integrated actions with the state and federal governments, civil society and private initiative.
• The program aims to consolidate the peace brought by pacification and foster social and
economic development in these communities
Instituto Pereira Passos UPP SocialTargeted Policies: UPP Social
Methodology
• Field team composed of agents and managers present in every pacified community
• The agents are residents from these communities – focus on ownership and local participation
• The field team has the responsibility of collecting data in every favela to identify the main
demands for public services (infrastructure, social and economic)
• The presence of the public agents helps to take down historical barriers caused by absence of
the state in these territories
• The agents articulate with local leaders, micro entrepreneurs and the general population,
creating a relationship of trust
• The information gathered is then used to articulate with other government sectors to mobilize
the implementation of services in the favelas, according to their specific priorities.
Instituto Pereira Passos UPP Social1- Areas of work
Information Management: UPP Social collects and sistematizes information on the
pacified territories in order to understand their contexts and particularities.
Monitoring results: UPP Social and the City Government´s Civil Cabinet will monitor the
Result Agreements of the priority City Government Agencies (Secretarias Municipais) in
the UPP areas (priority Agencies: housing; urban conservation/lighting/garbage
collection; education; health; and slope containment/protection).
Dialogue with Government Agencies/Bodies: UPP Social dialogues and works closely
with City, State, and Federal Government Agencies/Bodies to aid and potentialize their
work in the pacified territories.
Economic Development: UPP Social gives support to the IPP´s Project Management
Office and the Productive Inclusion Department to help promote productive inclusion
through training, entrepreneurship, culture, and sport.
Instituto Pereira Passos UPP SocialInformation Management
• Identification and Mapping of Streets
Identification and verification of existing streets, alleys, and stairways in the communities.
•Studies and Diagnoses
Development of studies and diagnoses of the newly-pacified territories, and also update the existing
materials at least once a year (Outlook of the Territories, Profile of the Territories, social development
index - SDI, and others).
•Monitoring the variation of the area occupied by slums (annual)
Monitoring the variation of the area occupied by the communities together with the “Sub Town
Halls” and the City Housing Agency/Secretariat.
• Low Income Settlements System (SABREN)
Organization and production of information regarding the communities’ demographics,
administrative data, public facilities, internal subareas, social organizations, and community
leaderships.
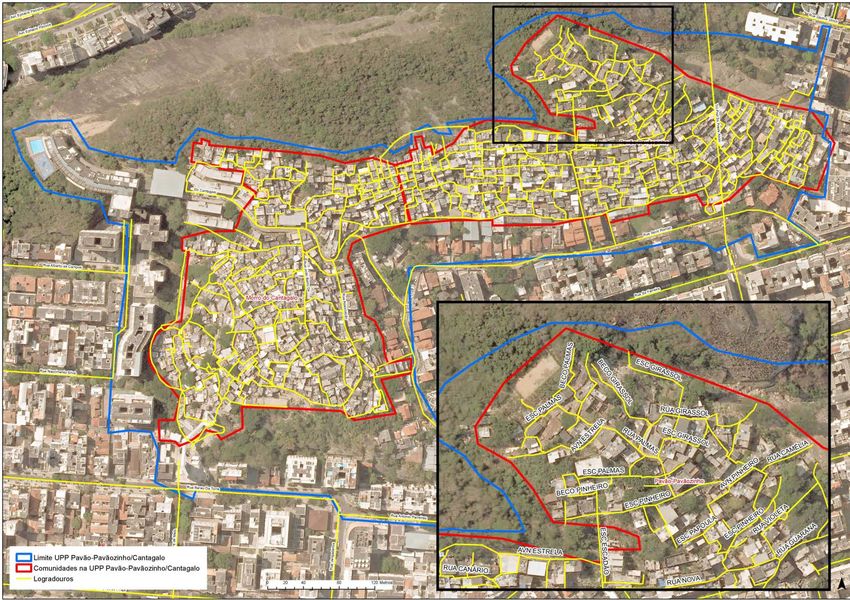
•Rapid Participatory Mapping (MRP)
Identification of the urban inequalities within the favelas to develop indicators.
Instituto Pereira Passos UPP SocialIdentification and Mapping of Streets
Before
Instituto Pereira Passos UPP SocialIdentification and Mapping of Streets
After
Instituto Pereira Passos UPP SocialProfile of Territories
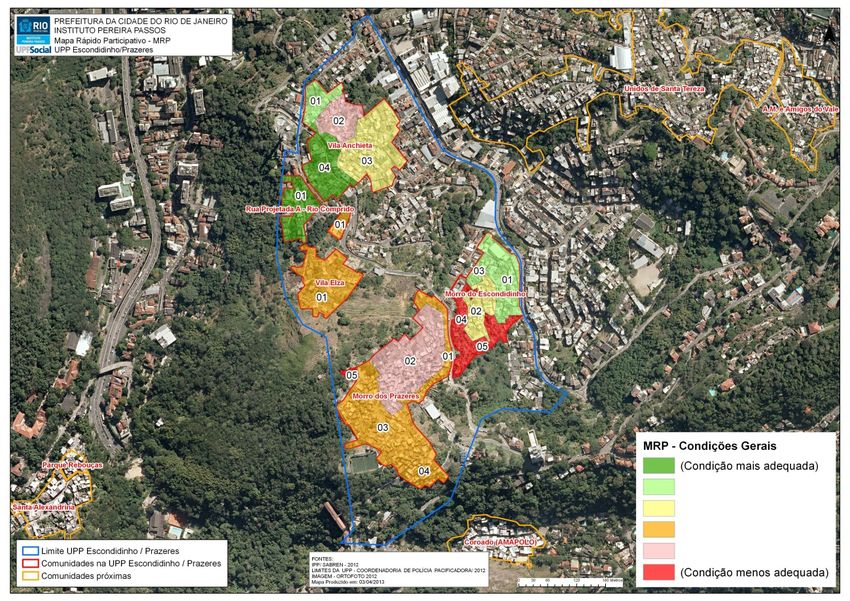
Instituto Pereira Passos UPP SocialRapid Participatory Mapping
Instituto Pereira Passos UPP SocialPorcentagem da Área, Índice Geral Urbano e Indicadores Urbanos do Mapeamento Rápido
Participativo segundo as Micro-Áreas e as comunidades da UPP Escondidinho / Prazeres –
2012 /2013
Iluminação
Regularização Infraestrutura
% da área na ÍNDICE Áreas de Padrão das Pública e
Comunidade Micro-Áreas Urbanística e para Água Esgoto Drenagem Lixo
comunidade GERAL Risco Moradias Energia
Construtiva Mobilidade
Elétrica
01 35% 40,91 6,00 2,92 4,23 6,00 5,14 6,00 4,00 4,63 1,99
02 23% 36,84 5,00 2,02 3,86 5,40 5,14 4,80 4,00 4,63 1,99
Morro do 03 8% 39,25 6,00 2,92 3,30 3,90 5,14 6,00 4,00 6,00 1,99
Escondidinho 04 13% 22,88 1,00 1,42 2,47 3,10 5,14 2,40 1,50 3,86 1,99
05 22% 26,06 1,00 2,92 2,95 4,10 5,14 3,00 1,50 3,46 1,99
MÉDIA 100% 34,34 4,05 2,52 3,57 4,84 5,14 4,62 3,14 4,39 1,99
01 10% 31,89 1,00 1,96 4,69 3,60 4,54 3,00 3,50 4,11 5,49
02 38% 27,48 3,00 1,96 2,63 3,60 4,54 2,40 3,50 3,71 2,13
Morro dos 03 41% 31,94 5,00 1,96 2,55 5,40 4,03 2,40 3,50 4,71 2,39
Prazeres 04 9% 30,91 5,00 1,96 2,47 3,60 4,03 3,60 4,00 3,86 2,39
05 1% 17,96 5,00 0,70 1,10 1,50 4,29 2,16 0,50 2,21 0,50
MÉDIA 100% 28,93 3,82 1,94 2,78 4,31 4,28 2,57 3,51 4,16 2,59
01 11% 38,21 6,00 1,42 2,79 4,40 5,74 6,00 6,00 2,63 3,23
02 17% 30,76 6,00 1,42 1,93 2,40 5,74 3,60 6,00 0,96 2,71
Vila Anchieta 03 45% 35,71 6,00 1,42 2,01 3,60 5,74 6,00 6,00 1,71 3,23
04 27% 44,26 6,00 2,50 4,33 4,40 5,74 6,00 6,00 5,40 3,89
MÉDIA 100% 37,41 6,00 1,71 2,70 3,70 5,74 5,58 6,00 2,67 3,32
Vila Elza 01 100% 33,33 5,00 1,42 3,19 3,10 5,40 3,60 6,00 2,63 2,99
Rua Projetada A 01 100% 45,45 6,00 3,40 4,62 5,00 5,74 4,80 6,00 6,00 3,89
UPP
Escondidinho / MÉDIA - 34,03 4,70 2,02 3,06 4,16 5,04 4,01 4,51 3,74 2,78
Prazerezs
Fonte: Dados Preliminares do Mapeamento Rápido Participativo (MRP) – IPP / UPPSocial – 2012 / 2013Examples of MRP Conditions
Instituto Pereira Passos UPP SocialA Greater Dialogue
MONITORING THE RESULT AGREEMENTS (Civil Cabinet and IPP/UPPSocial)
• Dialogue with City Government Departments to identify priorities.
• Develop Result Agreements with City Government Departments.
• Monitor the Result Agreements.
Instituto Pereira Passos UPP SocialA Greater Dialogue
- DIALOGUE WITH GOVERNMENT AGENCIES/BODIES
• Work agenda with the Government Agencies and Bodies
Develop a workflow with City, State, and Federal Government Agencies/Bodies to aid and potentialize
their work in the pacified territories.
• Integrated Management System
Organize and systematize information about projects, programs, and services from Government
Agencies in the pacified territories, making it possible to monitor actions/services/investiments in the
the pacified territories.
• Work Agenda with the “1746 system”
Develop a work agenda with the “1746 system”, with the goal of potentializing this service in the
pacified areas, and making it possible for Government Agencies to better meet the demands in these
areas.
Instituto Pereira Passos UPP SocialIntegrated Management System – Monitoring
Instituto Pereira Passos UPP SocialIntegrated Management System – Monitoring
Instituto Pereira Passos UPP SocialProject Management Office / IPP
Productive Inclusion Department / IPP
-ECONOMIC DEVELOPMENT
• Partnerships with local institutions
Examples: Orientation for Nissan´s investment in local NGOs in Borel, Macacos, and Turano;
development of courses with the Integrated Community Network (RCI) for Tabajaras, Pavão-
Pavãozinho, Cantagalo, Andaraí, Borel, and Formiga.
• Partnerships with civil society
Examples: Batalha do Passinho (in all the pacified communities); Cinemão (in all the pacified
communities); FLUPPensa – Literary Fest of the UPPs (in all the pacified communities); among others;
training of physical education teachers with the Instituto Compartilhar (Bernardinho´s institute) (in all
the pacified communities).
• Partnerships with the private sector
Example: Light´s project for the remodelling of sports courts and fields with investments from the
National Bank for Economic and Social Development (BNDES) (in all the pacified communities that
have sports/leasure infrastructure).
Example 2: TIM’s project for collecting data on the youth of the slums, training local young residents
to collect and analyse the profile of the youth of their own communities. 6,000 young residents from
age 15-24 were interviewed.
Instituto Pereira Passos UPP SocialTargeted Policies: City Hall
Targeted Policies: Examples of City Hall Projects and Programmes
• Morar Carioca – Infrastructure and Housing Integration Policy
• Education – Statistical impact of targeted education policies for favelas
• Health – Coverage of Family Clinics in the City
Instituto Pereira Passos UPP SocialTargeted Policies: City Hall
Morar Carioca
What is it?
• Created in July 2010, the program aims to promote social inclusion
through the complete urban integration of all of Rio’s favelas until R$ 8 Bilhões
2020;
• The aim is to contemplate 584 urbanized units with a total investment
of R$8 billion (approx. $4 billion).
R$ 1 Bilhão
R$ 2 Bilhões
First phase:
• 72 thousand households
1995/2008 – Favela Bairro
served
• 15 concluded works 2009/2012 – Morar Carioca 1ª fase
• 32 current works
2009/2020 – Morar Carioca
Instituto
Instituto Pereira
Pereira Passos
Passos UPP
UPP Social
SocialTargeted Policies: City Hall
Schools of Tomorrow
• School of Tomorrow
• Objective: reduce school evasion and improve performance of students in recently
pacified favelas
• 151 schools
• Full-time, includes arts and sports
• Tutoring for students in need
• Innovative teaching in sciences
• Health programmes within school
• Reading and computer rooms
• Annual performance bonus for schools that achieve their goals
• 62% increase in the number of teachers (2008-2011)
Instituto Pereira Passos UPP SocialTargeted Policies: City Hall
Dropout Rate 5th year, city of Rio de Janeiro, 2007 a 2011
7
6
City Average
5 Schools in "UPPs"
Schools not in slums
Schools in slums
Dropout Rate
4
"School of Tomorrow"
3
2
1
0
2007 2009 2011
Year
Source: Instituto Nacional de Estudos e Pesquisas Educacionais Anísio Teixeira - INEP
Instituto Pereira Passos UPP SocialTargeted Policies: City Hall
Family Health Program
Instituto Pereira Passos UPP SocialRio’s 3 “i”s
Challenges and Solutions for
Inequality, Integration and
InvestmentEconomic, Social and Urban Integration
Challenges of Inequality
• Rio de Janeiro is characterized for its high urban inequality, heightened by the fact that the
favelas are located within the affluent neighborhoods as well as in the periphery.
• To address inequality in Rio it is necessary to understand the underlying factors that cause
poverty and poverty traps.
• The multidimensional nature of poverty increases the complexity of the policies needed to
address it, as they need to be composed by different sectors in order to be truly effective in
breaking poverty traps.
• Example Initiatives: World Bank, World Without Poverty
Instituto Pereira Passos UPP SocialEconomic, Social and Urban Integration
Challenges of Integration
Policies, projects and activities in the public sector tend to be implemented independently –
This is because of the following reasons:
− Simplicity: it is easier to implement a single sector policy
− Bureacracy cost:
o there are no mechanisms or institutional structures adequate for integration;
o extremely time-consuming to plan and implement a cooperation agreement ;
− Lack of an integrated information database: policies reflect the available information
− Culture of “sectorialism”: budget dispute within government
Instituto Pereira Passos UPP SocialThe 3 “i”s: The Challenges
Challenges of Investment
• Budgetary constraints
• Multidimensional nature of poverty increases the complexity of the policies needed to tackle it.
This in turn increases the cost of such policies.
• Quality of the expenditure: lack of policy evaluation in terms of cost-benefit creates obstacles
for incresing efficiency of policies.
• “Brazil Cost” – heavy tax burdens, bureacracy
Instituto Pereira Passos UPP SocialThe 3 “i”s: The Challenges
Solutions: IPP = Innovation in Public Policy
Integrated Information Products:
• Statistical + Geographic Data
• Primary data collection, official city database, administrative records
Sectoral Integration
• Integrated Public Management Committees
• Articulation with stakeholders on the field = UPP Social Program
• Public Private and Third Sector Partnerships (PPP3)
Social Investment Funds
• Community development funds with mechanisms to finance integrated programs on the
ground.
Instituto Pereira Passos UPP SocialRIO Integrated City
You can also read