INVESTOR PRESENTATION - 1ST QUARTER - FY2020
←
→
Page content transcription
If your browser does not render page correctly, please read the page content below

INVESTOR
PRESENTATION
1ST QUARTER - FY2020

SAFE HARBOUR

 Some of the statements herein constitute “forward-looking statements” that do not
 directly or exclusively relate to historical facts. These forward-looking statements reflect
 our intentions, plans, expectations, assumptions and beliefs about future events and are
 subject to risks, uncertainties and other factors, many of which are outside our control.
 Important factors that could cause actual results to differ materially from the
 expectations expressed or implied in the forward-looking statements include known and
 unknown risks. Because actual results could differ materially from our intentions, plans,
 expectations, assumptions and beliefs about the future, you are urged to view all forward-
 looking statements contained herein with caution.
 Tata communications does not undertake any obligation to update or revise forward
 looking statements, whether as a result of new information, future events or otherwise.

                                                                                                2
AGENDA
         Business overview              Financial overview
         Growth Story                   Financial performance highlights
         Global Reach                   Portfolio Mix
         Our Customers                  Geography-wise distribution
         Market Overview                Investment Thesis
         Products and Services
         Expanding Addressable Market
         Investing in the future
         Awards and Recognitions

                                                                           3
BUSINESS OVERVIEW
                    4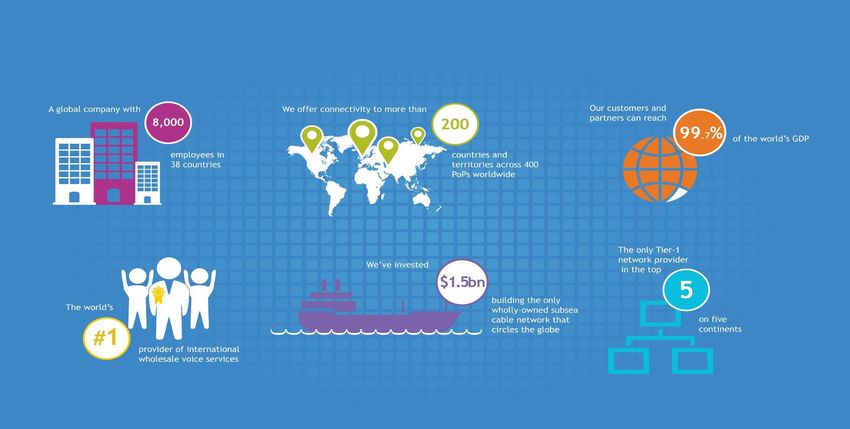
DELIVERING A NEW WORLD OF COMMUNICATIONS TM
Powering the platform economy, the internet and globalisation

                                                                5
GROWTH
GROWTH STORY
       STORY
Transforming from an INDIAN PSU to a Digital enablement player

            Transformation                                                 Growth                                                Innovation

     2002                 2008                    2010                   2012                     2014                    2015                   2016-19
   Tata Group                                 Launch of Cloud     Official connectivity       Partnered with        Joined forces with        #1 International Wholesale
                        VSNL, VSNL
 acquires stake                              Services, and Next        partnership              Salesforce to     Google, Microsoft Azure                Voice
     in VSNL       International, CIPRIS,   Generation Ethernet         with F1®          interconnect businesses   and AWS to deliver
                  Tata Indicom Enterprise                                                                                                      #1 India Large Enterprise
                                                  Network                                       to the cloud        cloud enablement
                  BU, Teleglobe and Tyco                                                                                 platform              Leader in Global Network
                                                                                              Signed first UK                               Services (Gartner) - 6th Year in
                       unite as Tata                                                           advertising
                   Communications LTD                                                                                                                    a row
                                                                                          sponsorship deal with
                                                                                          the Heathrow Express                              Exited Neotel and Data Center –
                                                                                                                                                         2017
                                                                                                                                                 Launched MOVE, and
                                                                                                                                                     NetFoundry
                                                                                                                                                                           6
GLOBAL REACH – PROVIDING CONNECTIVITY ACROSS THE WORLD
                         Over 40 Entities across the globe
               25% of                                        Leadership
  “Ring
               World’s                                       in Global     Global
Around the
              internet                                          SIP       Backbone
  World”
               routes                                        Trunking

                                                                                 7
OUR CUSTOMERS

Manufacturing   E-Commerce         IT/ITES       Services    Technology   Banking /      Media /        Healthcare/     Service
                                                                          Financial   Entertainment    Pharmaceutical   Provider

                                                                                            69%   of
                             60% of                                                           PWC
                             S&P 500
                                             ~2,000
                                                                                              100

                                                                          ~5,000
                                               Service      ~ 7,000       Enterprise              41%
                        66%   of                                                                       of
                                              Provider      Customers
                        Fortune                                           customers                FTSE
                          500                Customers       Globally:                             350

                                                   SOME KEY CUSTOMERS

                                                                                                                                   8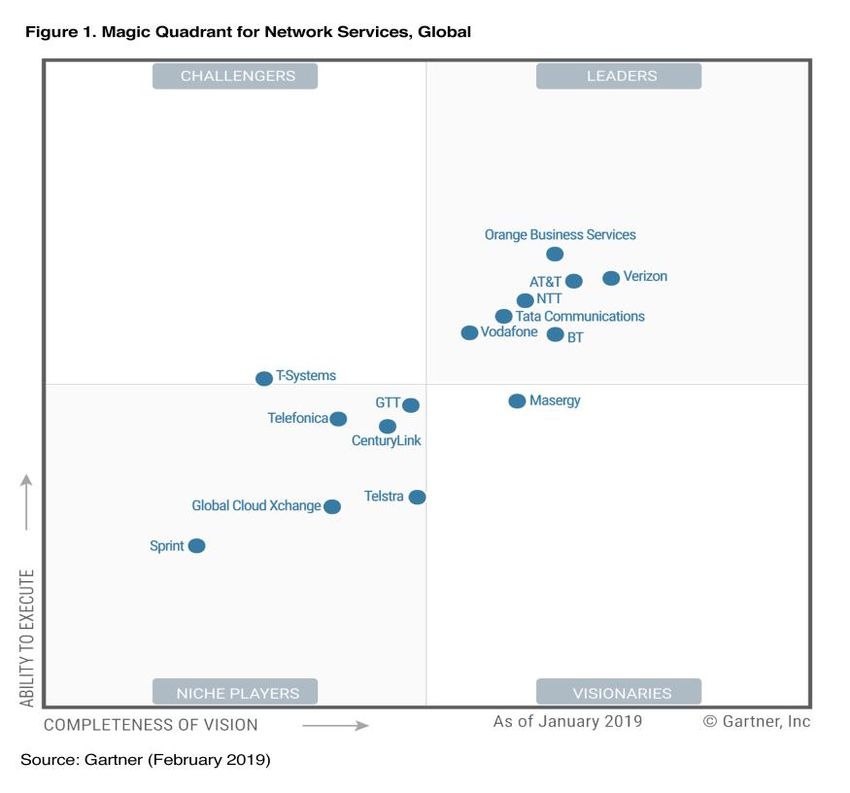
MARKET OVERVIEW
Technology is a game changer

                                                 70% of large and mid-sized enterprises are likely to rework their
                                                 networking setups over the next three years

                Network Function                 37%      of IT budgets are spent on cloud and cloud-related services
                  Virtualisation
                      (NFV)                      4.4 million IT jobs created globally to support big data in
 Big Data and                       Explosion    2015
   Analytics                         of APIs
                                                 56% of executives purchase IT products on smartphone or
                    Digital                      tablet
                Transformation
                                   The move to   92% of digital disrupters are leveraging APIs for mobile app
   Internet                         the Cloud    development
   of Things
                                                 By 2020, 40% of all data will come from sensors

                                                 31%   of companies don’t know how many of their employees
          Mobility     Consumerisation           work internationally each year
                            of IT

                                                                                                                        99
STAGES OFOF
STAGES DIGITAL MATURITY
DIGITAL MATURITY
TATA Communications offers solutions for each stage
CONTEXTUAL
—Highly customer
DIGITAL centric
—Real time faster
—Digitaltrading
trading
experience
OMNI-CHANNEL —Online co-exists
—Machine
—Mobile app Learning &
ONLINE with physical
—Social Media
Artificial
PHYSICAL office outlet
—Internet trading —Online trading
Intelligence
—Ecosystem
leads over mobile —Big Data and
—Trading portals collaboration
office is —Website —Client portals
Advanced
—Cloud
primary preferred over —Tablet app
Analytics
Infrastructure
mobile app —Robo-advisors
channel
—Chat bots
Access trading services and information from anywhere
Enterprise collaboration and digital access for multi-channel reach
Differentiated customer experience through personalisation
10
10A TRULY
STAGESDIGITAL BUSINESS…
OF DIGITAL MATURITY
Enables collaboration Effectively deploys Is developing with an
across employees, artificial intelligence intelligent network,
partners, and the toal and analytics intuitive collaboration
supply chain and borderless growth
11
11BUSINESS THEMES ENABLING DIGITAL TRANSFORMATION
Borderless Productivity Customer experience Managing
growth and efficiency and engagement business risk
Cloud and Business Managed Network Mobility Voice Media
data centre collaboration security
Providing 24x7x365 Operates the largest Provides access to No. 1 in wholesale voice Global network that can
Connecting businesses to Relationships with more
proactive monitoring of wholly-owned and most pervasive cellular globally transfer 1TB
8 main cloud platforms than 1600 carriers
security devices for over 700 advanced subsea fibre connectivity with over data/second for HD
in 20 locations across 3 worldwide, to ensure state-
customers network 600 mobile networks video without buffering
continents of-the-art communications
across 190+ countries
and collaboration
Connecting all major One of the largest cloud- Carrying around 30% of Video network that
cloud services providers End-to-end global managed based DDoS mitigation and the world’s internet reaches 300 media
globally. services and support scrubbing services with 17 routes hotspots globally
scrubbing farms globally
POWERED BY OUR PLATFORMS DELIVERED AND ASSURED BY OUR SERVICE TEAMS
12OUT OF A $1.1 TN TELECOM MARKET, WE ADDRESS ~$46 BN MARKET,
WHICH HAS EXPANDED…
MNaaS FROM $46BN IN 2017 TO $69BN IN 2020 INTERNATIONAL VOICE
$9bn
$9bn -12%
$0bn Growth
MOBILITY driven by
2020 $13bn
$5bn Innovation
$1bn
in new FROM CARRIER NETWORK
HEALTHCARE
services US$46 BN $10bn +4%
$3bn +71%
like IZOTM, IN 2017 $9bn
$1bn
Mobility TO
IZOTM
(MNaaS), US$69 BN
$4bn +44% DATA - INTERNATIONAL
$2bn Healthcare IN 2020 2017
$10bn +8%
UCC
and UCC CAGR 14% $8bn
$7bn +26%
$3bn DATA - INDIA
MEDIA $3bn +14%
$2bn +33% $2bn
$1bn CLOUD
BANKING SOLUTIONS
$7bn +12%
$1bn +26% 2020 2017
*Data – Intl Connectivity includes ILL, VPN, Ethernet, CDN, IPT
$5bn
$.0.5bn ^ IZOTM includes market for Enterprise Internet (excl. India) + Domestic VPN (excl. India)
13INNOVATING TOGETHER TO CREATE INNOVATIVE BUSINESS SOLUTIONS
Helping consumers remain agile, adaptable, and responsive
Internal Crowdsourcing ideas from 8,500 strong workforce and New business
Innovation incubate internal start-ups for go to market units e.g. IoT
in India
Start-up scouting in partnership with innovation partners to New product
garner ideas for new business creation development in
partnership
with start-ups
External
Northgate Telecom Cloud App Security
Innovation Innovation Fund
Artificial Intelligence Investments in
Cloud SDN
and security disruptive
technologies
Cloud-managed Mobile Virtual Network
like Sentient AI
SD-WAN Enabler
14INVESTING FOR THE FUTURE
MOVE is 3 Products built on Other Innovative Products
the Tata Global Network in our Portfolio Digital Transformation
SIM CONNECT Mobile customer engagement
Revamping systems and processes
• Mobile Messaging Exchange
to enhance long term productivity
Global Mobile Connectivity for Humans • SMS Firewall
– Providing Global Visibility, Security • API Suite and enrich customer experience
and Control to MNCs • Mobile Local Number Services
• Sponsored Data Exchange
IOT CONNECT LoRa LP-WAN (Low Power, Long
Range Network)
Global Connectivity for Machines and
• IOT infrastructure and developer
Things – Fully Programmable Global IoT
ecosystem in India
connectivity and services
• Based on LoRa network
MOBILE NETWORK ENABLEMENT
MNOs can leverage our MVNE “platform Net foundry
as a Service” and launch sophisticated
local or global MVNOs rapidly
15THIRD PARTY ENDORSEMENTS, AWARDS AND RECOGNITION
Continuous improvement
India's largest corporations: Frost & Sullivan India ICT Awards:
Tata Communications at #68
• Enterprise Data Service Provider of the Year (10th Year in a row)
Transparency International, a global civil society organisation, conducted
research into the public reporting practices of 100 emerging market • Enterprise Telecom Service Provider of the Year - Large Enterprises
companies based in 16 countries in 2016 (4th Year in a row)
• IoT New Product/Service Innovation Award (2nd Year in a row)
• Third Party Managed Hybrid Cloud Provider of the Year (first time
Tata Communications ranks #2
in the ‘Transparency in Corporate Report’ winner)
8 page feature story on the Leadership Profile of • SDWAN (Software-defined WAN) New Product/Service Innovation
Tata Communications in the December edition of
Award (first time winner)
Fortune India
http://fortuneindia.com/2016/december/the-importance-of-being-global- • Conferencing Service Provider of the Year
1.10468
GREAT PLACE TO WORK GLOBALLY
INDIA INDIA SINGAPORE
2018 | 2017 | 2016 2019|2018|2017|2016 2018 | 2017 HONG KONG
Best Small and Medium
Workplaces ( No 10)
HONG KONG HONG KONG CANADA GR. CHINA 2019
2018 | 2017 2018 | 2019 2018 2018 INDIA
2018 | 2017
16POSITIONED IN THE LEADERS’ QUADRANT
Tata Communications Positioned as a Leader in the 2019 Gartner Magic Quadrant for Network Services,
Global - 6 years in a row
Ability to Execute
Gartner evaluates providers on the quality and efficacy of the processes, systems, methods or
procedures that enable IT provider performance to be competitive, efficient and effective;
and to positively impact revenue, retention and reputation within Gartner’s view of the
market. Our emphasis is on a vendor’s service quality, pricing and track record. These
elements are particularly important for global networks because the issues of infrastructure,
language and culture are more challenging than if applicable to only one country.
Completeness of Vision
Gartner evaluates providers on their ability to convincingly articulate logical statements. This
includes current and future market direction, innovation, customer needs and competitive
forces, and how well they map to Gartner’s view of the market. Visionary providers should
have a clearly articulated strategy in evolving areas of enterprise networking, including, but
not limited to, networking for cloud services, SD-WAN, SDN, NFV and vCPE. The portfolio
should be broad enough to satisfy the evolving requirements of most enterprises, not just a
specific vertical industry or customer size.
Latest reprint link: http://www.gartner.com/reprints/tata-communications-international-pte--l?id=1-6AM1UID&ct=190228&st=sb
Source: Gartner, Inc. “Magic Quadrant for Network Services, Global” by Neil Rickard, Bjarne Munch, Danellie Young, February 25, 2019
This graphic was published by Gartner, Inc. as part of a larger research document and should be evaluated in the context of the entire document. The Gartner document is available upon request from Tata Communications. Gartner does not endorse any vendor, product or
service depicted in its research publications, and does not advise technology users to select only those vendors with the highest ratings or other designation. Gartner research publications consist of the opinions of Gartner's research organization and should not be construed as
statements of fact. Gartner disclaims all warranties, expressed or implied, with respect to this research, including any warranties of merchantability or fitness for a particular purpose.SHAREHOLDER VALUE CREATION
Focus on maximising long term intrinsic value for shareholders
• Recalibrate Investments
Drive
• Co-create with partners
Capital
• Strong discipline and governance around capital allocation and 1.7%
Efficiency 5%
expenditure
18.3%
Improve • Improve operating efficiency and drive operating leverage
Margin 48.9%
• Accelerate growth in high margin data segment and new services
Profile
26.1%
Invest for
• Reshape portfolio
Sustainable
• Invest in new services/ innovation to differentiate and accelerate
Long-Term growth
Growth
TATA sons GOI Foreign Institutions Domestic Institutions Non-Institutional
Create • Key priority is to generate free cash flow and deleverage balance
Financial sheet Shareholding pattern as of
and Strategic • Pursuit of opportunities to unlock intrinsic value
30 June 2019
Flexibility • Rationalise businesses with sub-par return profiles
18
18CORPORATE SOCIAL RESPONSIBILITY
Technology driving social change
Tata Communications and MasterCard joined forces to empower 100
million women in the developing world. Working with a unique network
of partners, we aim to bring our shared vision to life through access to
transformative mobile platforms across a range of financial, health and
education applications and service
• We’re committed to improving the quality of life of communities through
programmes such as health, education and vocational training
• Sustainability is built into our business processes
• We have impacted more than 150,000 lives in the last 3 years through 14 CSR
programs.
• Employees have contributed 70,000 hours globally in the last 3 years towards
community action.
• In FY18, 98% of our employees have undergone 69,081 days of skill By financially including women around the globe,
development training through 805 workshops we take an important step towards poverty
• Further, our employee engagement score remains very high at 81% in 2018. alleviation, equality and economic prosperity.
This helps us stay very high up in the top quartile of the Aon Hewitt global
telecom database Walt Macnee, Vice Chairman, Mastercard
19FINANCIAL PERFORMANCE
20PERFORMANCE HIGHLIGHTS | REVENUE, EBITDA AND FCF | QUARTERLY
REVENUE 4244 4169 Revenue
YoY QoQ
3944 Growth %
901 890
1027 o Data business witnessed strong growth Data 12.4% (1.9%)
INR Cr.
despite industry headwinds; strong
2917 3343 3278 growth in both Traditional (+6.1% YoY) Voice (13.3%) (1.2%)
& Growth Services (+29.2% YoY) has
Q1 FY 19 Q4 FY 19 Q1 FY 20
helped achieved this growth rate Core 5.7% (1.8%)
EBITDA o EBITDA grew by 40.7% YoY and 20.5% EBITDA
826 YoY QoQ
685 QoQ on the back of strong profitable Growth %
89
587 97 growth in Data business; margins Data 42.7% 25.1%
71
INR Cr.
736
expanded by 490 BPs YoY
516 589 Voice 26.3% (7.6%)
o Strong business performance translated
Q1 FY 19 Q4 FY 19 Q1 FY 20 into PAT of INR 77 crore Core 40.7% 20.5%
FCF
FCF o Q1 free cash flow of INR 315 crore,
Growth %
YoY QoQ
516 witnessing a growth of 447% over last
89 quarter, this free cash flow is post Data 390.7% 104.3%
INR Cr.
262
96 capex, tax and interest
103 485 Voice 30.3% (7.7%)
68 237
99
Q1 FY 19 Q4 FY 19 Q1 FY 20 Data Voice Core 400% 96.7%
21PERFORMANCE HIGHLIGHTS | REVENUE, EBITDA AND FCF | ANNUAL
REVENUE 16772 16525
Revenue
FY17 FY18 FY19
17620 Growth %
6758 5311 3870 o Consistent strong growth in Data Data 10.7% 5.5% 10.4%
Business despite industry challenges
INR Cr.
10862 11460 12655
Voice (16.1%) (21.4%) (27.1%)
o Data business growth is compensating
for the decline in Voice business Core (1.4)% (4.8%) (1.5%)
FY 17 FY 18 FY 19
EBITDA 2412 2745 o Voice business is declining in-line with EBITDA
FY17 FY18 FY19
2360 336 industry and technology trends Growth %
415 347
Data 7% 6.2% 16.6%
INR Cr.
2409 o Shift towards more profitable data
1946 2066
business leading to EBITDA growth and Voice (15.6%) (16.3%) (3.1%)
margin expansion
FY 17 FY 18 FY 19 Core 2.2% 2.2% 13.8%
o Voice business continues to generate
FCF healthy cash flow despite decline in FCF
898 FY17 FY18 FY19
881 Growth %
772 revenue
338 331
397 Data 38.1% 42.2% (7%)
INR Cr.
882 820
620 Voice (14.5%) (14.9%) (2.1%)
FY 17 FY 18 FY 19 Data Voice Core 15% 16.2% (1.9%)
22PERFORMANCE HIGHLIGHTS | PORTFOLIO MIX
Gross revenue mix EBITDA mix Operating free cash flow mix
18% 14% 12%
23% 21% 28% 29%
32% 39%
38%
45%
83% 86% 88%
77% 79% 72% 71%
68%
62% 61%
55%
FY 16 FY 17 FY 18 FY 19 FY 16 FY 17 FY 18 FY 19 FY 17 FY 18 FY 19
Data Voice
• There has been a significant shift in the mix of our business, with Data dominating both in terms of Revenue, EBITDA and Free Cash Flow, and the
declining dependence on Voice can be clearly seen above
• Traditional Connectivity services is our mainstay, and represents a majority portion of both our Revenue and EBITDA
• However, our investment in Growth & Innovation Services will drive the business in the future, share of Growth services is steadily increasing
Note: USD-INR: FY15 – 61.13; FY16 – 65.44; FY17 – 67.07; FY18 – 64.47, FY19 – 69.9; Q4FY17 – 67.09; Q1FY18 – 64.48; Q2FY18 – 64.30; Q3FY18 – 64.77; Q4FY18 – 64.35; Q1FY19 – 66.94; Q2 FY19 – 70.10; Q3 FY19 – 72.13, Q4 FY19 – 70.47;FY15, FY16
are reported numbers, and include Data centre business
23PERFORMANCE HIGHLIGHTS | NET DEBT
1438
1327 1268 1251 1287 1232 1248
1150 1151
USD Mn
Mar-15 Mar-16 Mar-17 Mar-18 Jun-18 Sep-18 Dec-18 Mar-19 Jun-19
Net Debt to EBITDA (x) Cost of Debt %
3.87% 3.93%
3.7 3.80%
3.67% 3.76% 3.86%
3.6 3.59%
3.4 3.4 3.41%
3.3 3.2 3.2 3.1 3.12%
2.9
Mar-15 Mar-16 Mar-17 Mar-18 Jun-18 Sep-18 Dec-18 Mar-19 Jun-19 Mar-15 Mar-16 Mar-17 Mar-18 Jun-18 Sep-18 Dec-18 Mar-19 Jun-19
• Net debt was at USD 1,248 Mn an increase of USD 16 Mn over last quarter, due to salary hike and bonuses paid during the quarter
• Average cost of borrowing for Q1 was 3.93%, an increase of 7 BPS over Q4 FY19
Note: USD-INR: FY15 – 61.13; FY16 – 65.44; FY17 – 67.07; FY18 – 64.47; Q4FY17 – 67.09; Q1FY18 – 64.48; Q2FY18 – 64.30; Q3FY18 – 64.77; Q4FY18 – 64.35; Q1FY19 – 66.94; Q2 FY19 – 70.10; FY15, FY16 are reported numbers, and include Data centre business
24PERFORMANCE HIGHLIGHTS |GEO-WISE CONTRIBUTION
Gross Revenue Share by Geography - FY15 FY19
APAC 8.7% 10.7%
Europe 24.6% 14.6%
India 30.6% 38.1%
America 22.5% 25.6%
MENA 8.6% 7.7%
Global 5.0% 3.3%
25KEY TAKE AWAY
Riding on global data growth
Digital Transformation and Cloud adoption to drive the business growth
Transformation driving demand for hosting, SD WAN and network virtualisation services
Positioned for the first time by Gartner in its 2017 Magic Quadrant for Managed Hybrid Cloud Hosting, Asia/Pacific as a niche player
Positioned as “Leader” in Gartner magic quadrant for network services, global for 6th consecutive year.
Digital push through partnerships
o Partnership with Batelco, Cisco for SD WAN
The revamped GTM strategy has started to show positive results with an improvement both in funnel adds as well as in closed sales.
Product penetration ratio (which is the number of products sold to each customer) of Top 300 customer has improved from 5.23 in Q1
FY19 to 5.42 in Q1 FY20.
Growth services continued to witness strong momentum with a YoY growth of 29.2%; IZO grew by 85%, MMX (A2P Messaging) grew by 71%
and Security services grew by 69% YoY. Traditional services have stabilised and witnessed growth of 6.1% YoY
FY19 Dividend of INR 4.5/share which is 45% of face value of each share
Demerger of surplus land approved by shareholders, NCLT and MCA; no further approval required, record date will be announced soon -
After the transfer of surplus land, the company still holds close to 850 acres of land across various states, and the
de-merger will enable evaluation of options to monetise this land at a later stage
26INVESTMENT THESIS
Data led growth
Valuation arbitrage as Geographically
compared to global peers Diversified business
TATA
COMMUNICATIONS
Value creation through huge Internal
land assets transformation
27THANK YOU
THANK YOU
tatacommunications.com
tatacommunications.com
© 2019 Tata Communications. All Rights Reserved.
TATA COMMUNICATIONS and TATA are trademarks of Tata Sons Limited in certain countries.
©2019 Tata Communications. All rights reserved. TATA COMMUNICATIONS and TATA are
trademarks of Tata Sons Private Limited.
28You can also read