Emera Investor Luncheon - Toronto, ON November 27, 2018
←
→
Page content transcription
If your browser does not render page correctly, please read the page content below

Emera Investor
  Luncheon

       Toronto, ON
       November 27, 2018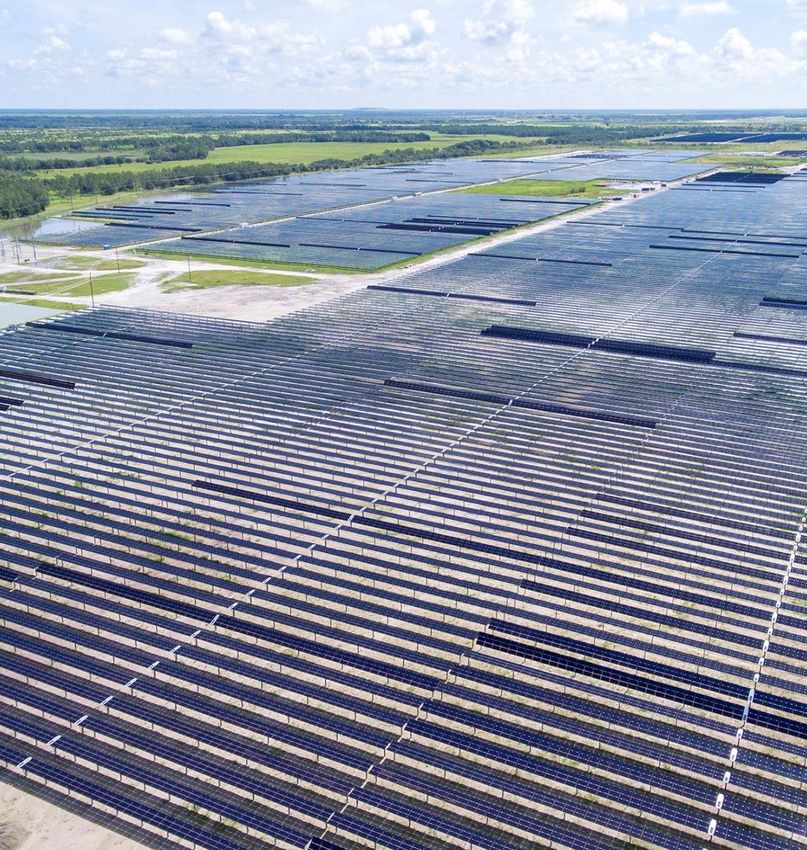
Agenda

    10:45 – 11:45   Company Presentations
                    Scott Balfour, President and CEO, Emera Inc.
                    Nancy Tower, President and CEO, Tampa Electric
                    Greg Blunden, CFO, Emera Inc.
    11:45 – 12:15   Audience Q&A
    12:15 – 1:30    Lunch

2
Forward-Looking Information
Forward-Looking Information
This document contains “forward-looking information” and statements which reflect the current view with respect to the Company’s expectations regarding future growth, results of operations,
performance, business prospects and opportunities and may not be appropriate for other purposes within the meaning of applicable Canadian securities laws. All such information and
statements are made pursuant to safe harbour provisions contained in applicable securities legislation. The words “anticipates”, “believes”, “could”, “estimates”, “expects”, “intends”, “may”,
“plans”, “projects”, “schedule”, “should”, “budget”, “forecast”, “might”, “will”, “would”, “targets” and similar expressions are often intended to identify forward-looking information, although not
all forward-looking information contains these identifying words. The forward-looking information reflects management’s current beliefs and is based on information currently available to
Emera’s management and should not be read as guarantees of future events, performance or results, and will not necessarily be accurate indications of whether, or the time at which, such
events, performance or results will be achieved.
The forward-looking information is based on reasonable assumptions and is subject to risks, uncertainties and other factors that could cause actual results to differ materially from historical
results or results anticipated by the forward-looking information. Factors that could cause results or events to differ from current expectations are discussed in the Business Overview and
Outlook section of Management’s Discussion and Analysis (“MD&A”) and may also include: regulatory risk; operating and maintenance risks; changes in economic conditions; commodity price
and availability risk; capital market and liquidity risk; future dividend growth; timing and costs associated with certain capital projects; the expected impacts on Emera of challenges in the global
economy; estimated energy consumption rates; maintenance of adequate insurance coverage; changes in customer energy usage patterns; developments in technology that could reduce
demand for electricity; weather; commodity price risk; unanticipated maintenance and other expenditures; system operating and maintenance risk; derivative financial instruments and hedging;
interest rate risk; credit risk; commercial relationship risk; disruption of fuel supply; country risks; environmental risks; foreign exchange; regulatory and government decisions, including changes
to environmental, financial reporting and tax legislation; risks associated with pension plan performance and funding requirements; loss of service area; risk of failure of information technology
infrastructure and cybersecurity risks; market energy sales prices; labour relations; and availability of labour and management resources.
Readers are cautioned not to place undue reliance on forward-looking information as actual results could differ materially from the plans, expectations, estimates or intentions and statements
expressed in the forward-looking information. All forward-looking information in this document is qualified in its entirety by the above cautionary statements and, except as required by law,
Emera undertakes no obligation to revise or update any forward-looking information as a result of new information, future events or otherwise.
Nothing in this document should be construed as an offer or sale of securities of Emera or any other person.
Non-GAAP Measures
Emera uses financial measures that do not have standardized meaning under USGAAP and may not be comparable to similar measures presented by other entities. Emera calculates the non-
GAAP measures by adjusting certain GAAP measures for specific items the Company believes are significant, but not reflective of underlying operations in the period. Refer to the Non-GAAP
Financial Measures section of our MD&A for further discussion of these items.

 3
Safety Moment

          Toronto, ON
4
          November 27, 2018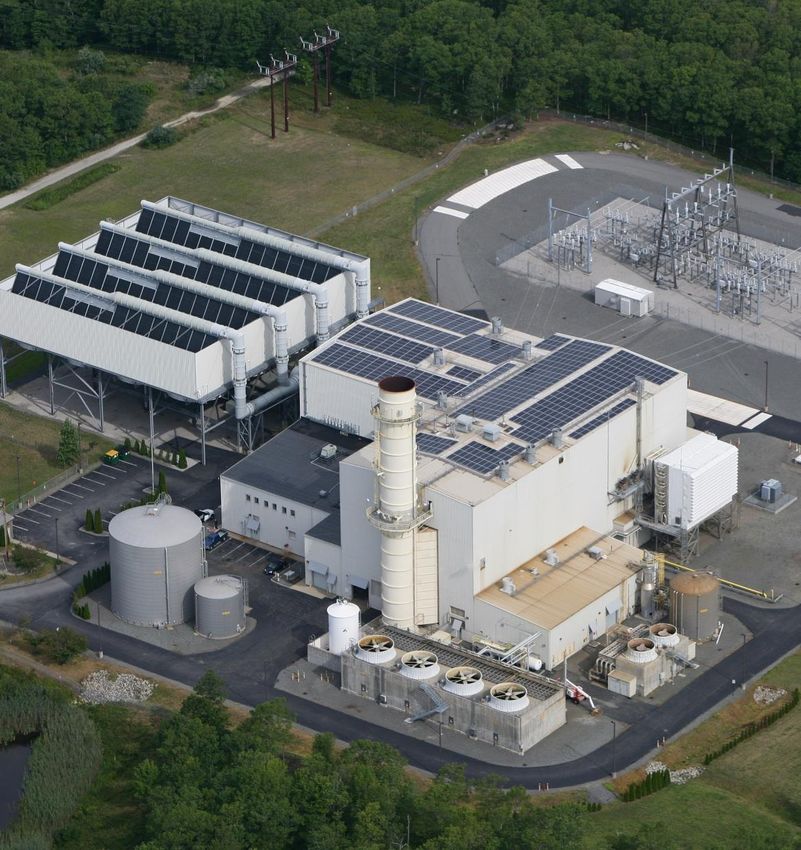
Business&Update
    Strategy   Capital
        Allocation

              Scott Balfour
              President & CEO
5             Emera Inc.
Emera Today
                                                                                                 RI
                                                                                                      Maritime Link(1)
                                             RI                                                       Approved ROE: 8.75-9.25%
                                                  Emera New Brunswick                                 Approved equity: 30%
                                                  $0.6 billion in assets                              Rate base: $1.8 billion                                   ~90% regulated portfolio of
                                                                                                      Labrador Island Link(1)
                         RI
                              Emera Maine                                                             Approved ROE: 8.5%                                         predominately vertically-
                              Approved ROE: 9.85%(3)
                              Approved equity: 60.4%(3)
                                                                                                      Construction complete Q2 2018                           integrated electric utilities and
                                                                                                      Equity investment: $492 million
                              Rate base: $0.7 billion                                                 Equity ownership: 49.5%                                  gas LDCs across North America
                              Customers: 158,000
                                                                                         RI
RI                                                                                            Nova Scotia Power
     New Mexico Gas                                                                           Approved ROE: 8.75-9.25%

                                                                                                                                                            $30B                                                 $6B
     Approved ROE: 10%                                                                        Approved equity: 40%
     Approved equity: 50%                                                                     Rate base: $3.7 billion
     Rate base: $0.6 billion                                                                  Customers: 515,000
     Customers: 525,000
                                                                                              Corporate and Other(4)
                                                                                              $0.7 billion in assets                                              Assets                                     Revenues
                RI
                     Tampa Electric
                                                                        Emera Energy
                     Approved ROE: 9.25-11.25%
                                                                        Target US$15-30 million
                     Approved equity: 54%
                                                                        earnings annually

                                                                                                                                                            2.5M                                            7.4K
                     Rate base: $6.0 billion
                     Customers: 750,000                                                    RI
                                                                                                Emera Caribbean
      RI                                                                                        9.4% approved return on
           Peoples Gas
           Approved ROE: 9.25-11.75%
                                                                                                rate base(2)
                                                                                                Rate base: $0.6 billion
                                                                                                                                                             Customers                                     Employees
           Approved equity: 54.7%                                                               Customers: 184,000
           Rate base: $0.9 billion
           Customers: 375,000                                                                                                                        RI    Regulated Investments

                                                                Note: Emera Florida and New Mexico, Emera Maine, and Emera Caribbean dollar amounts are USD, all other CAD; all values as at December 31, 2017
                                                                (1) Maritime Link and Labrador Island Link are equity accounted and are in the Corporate and Other segment of the financial statements
                                                                (2) Weighted average return on rate base. The weighted average equivalent return on equity is 12.8% with a 63.8% equity thickness.
      6                                                         (3) Weighted average of transmission, distribution, and stranded costs
                                                                (4) Excluding ENL and Emera New Brunswick
CUSTOMER FOCUS         Cleaner, affordable, reliable energy delivered safely

              ASSET FOCUS          Regulated electricity & gas assets

           GEOGRAPHIC FOCUS        North American markets with opportunities for growth

Emera                              Dividend Target        EPS Growth              Capital Allocation      Balance Sheet

Strategy
                                   4-5% CAGR through      6-7% rate base          ongoing optimization    achieve target capital
                                   2021                   CAGR to 2021            of the portfolio to     structure, supporting
            FINANCIAL FOCUS                               supports average EPS    achieve our financial   our investment grade
                                                          growth in excess of     targets, with a         rating
                                                          the dividend growth     current emphasis on
                                                          target                  organic growth

                                   Carbon Reduction       Rate Stability          Innovation              Sustainability
                                   investing to reduce    ensuring cost           exploring new           executing with
                                   the carbon intensity   certainty through       solutions to meet the   discipline to deliver
           STRATEGIC INITIATIVES   of our operations      “Fuels to Assets” and   current and future      for our customers,
                                                          “O&M to Assets”         energy needs of our     employees,
                                                          projects                customers               shareholders,
                                                                                                          communities and the
                                                                                                          environment
7
Executing on Our Strategy
Strong year-to-date earnings and cash flow
growth driven by load growth, solar
investments and favourable market conditions
in key service areas
Advancing accretive, rate base investments
across the portfolio, most notably in Florida
Maritime Link operational and providing cash
earnings and regional electrical stability
Positive regulatory outcomes in Florida,
mitigating the 2018 impact of US tax reform
8
696MW                      16%                  $18.1M
                             Renewable capacity       Reduction in GHG         Invested in our
     Sustainability               installed          emissions since 2005       communities

    We are executing with
                                   272                  Best 50               Strong
     discipline to deliver      Proactive safety     Corporate Citizen in   Governance
     for our customers,       incident reports for
                             every 100 employees
                                                           Canada
                                                      (2018, Corporate
                                                                            2018 Governance Gavel
                                                                             Award & consistently
         employees,               across Emera            Knights)           top 5 in the Globe &
                                                                              Mail’s Board Games
        shareholders,
    communities and the
                              Employer               Leadership                    83%
        environment                                  31% women on Emera     Employee engagement
                              of Choice                     Board            index based on 2018
                              Canada's Top 100         and 39% of senior            survey
                              Employers (2019)         executive teams

9
MARITIME LINK               FLORIDA SOLAR              BIG BEND MODERNIZATION

      $1.55 billion rate base    Investing US$850 million       Investing US$850 million
     investment placed into     to install 600MW of solar        to repower Unit 1 with
      service on January 15,    in Florida; placed the first      natural gas combined
     2018; delivered on-time      145MW into service in           cycle technology and
          and on-budget              September 2018                    retire Unit 2

10
2019-2021 Highlights
$6.5+ billion capital 6% - 7% rate base CAGR 4% - 5% dividend
program driving average EPS growth in growth target
focused in regulated utilities excess of dividend growth returning capital to shareholders
11Adapting to the Capital Market Cycle
Emera is
• Rising interest rates well
• U.S. tax reform impacts positioned to
• Investor preference for self-funded growth manage
• Current valuation gap between Canadian through the
capital
and U.S. utilities market cycle
12Redeploying Capital to Enable Growth
• Potential asset sales based on Determine Strategic
valuation and marketability and, in incremental review of
the context of Emera’s cost of capital, funding asset
long-term growth potential and requirements portfolio
impact on credit quality
• Rotating capital investment into our
high value businesses will maximize
shareholder returns Direct Identify and
• Strengthening our balance sheet will proceeds to evaluate
enable Emera to continue to grow high growth possible asset
jurisdictions sales
shareholder value
13Sale of New England Gas Generation
• Gross proceeds of US$590 million (~C$780 million)
• Transaction improves business risk profile and
increases the proportion of regulated earnings in
Emera’s portfolio to approximately 95%,
improvements that are credit positive
• Proceeds to be used to repay holding company
debt and to fund ongoing rate base growth
initiatives
• Expected to be accretive to earnings beginning in
2020, relative to issuing equity
• Expected close Q1 2019
14Asset Sales
• Off to a strong start and expect total 2019-2021 Asset Sales
asset sales to generate C$1.4-$2.0 Total Proceeds
$1.4B - $2.0B
billion of net proceeds
• Expect sales to be complete by the end
of 2019 $0.6B - $1.2B
• Objective is to minimize, and
potentially eliminate, external common
equity needs beyond the DRIP
$0.8B
• Florida and Atlantic Canada utility
assets offer greatest growth potential
and will remain part of portfolio NEGG Additional Asset Sales
15Visible Plan to Invest $6.5B+ in Rate Base
Forecasted Capital Spend (1)
$3.0
$2.5
$2.3
$1.1
$0.2
$2.5
$2.2
$1.8
2019F 2020F 2021F
Baseline Forecast Opportunities Under Development
(1) In
billions of Canadian dollars. U.S. dollar denominated capex is translated at a forecasted average USD/CAD exchange rate of 1.30 in 2019-2021. Details by affiliate
16 can be found in the appendix. Forecast is subject to change in the normal course of business.Investment Focused in Regulated Utilities
2019-2021 Capital by Jurisdiction (1)
• Over 85% of capital being
13% deployed in Florida and Nova
Scotia, both considered
constructive regulatory
Florida
jurisdictions
19%
Nova Scotia • Investment in jurisdictions with
above-average equity
Other
68% thicknesses will result in higher
EPS growth and lower
consolidated leverage
(1) U.S. dollar
denominated capex is translated at a forecasted average USD/CAD exchange rate of 1.30 in 2019-2021. Details by affiliate can be found in the appendix.
17 Forecast is subject to change in the normal course of business.Capital Program Drives Rate Base Growth
Forecasted Rate Base Levels (1)
$21.6 $22.5
$20.7
$18.9
2018F 2019F 2020F 2021F
(1) Averagetotal rate base in billions of Canadian dollars. U.S. dollar denominated rate base is translated at forecasted average USD/CAD exchange rate of 1.30 in
18 2018-2021. Florida utilities’ rate base includes deferred tax liabilities. Forecast includes Maritime Link and implied Labrador Island Link rate base. Only approved and
ordinary course capital projects are included. Details by affiliate can be found in the appendix. Forecast is subject to change in the normal course of business.Solid Long-term Shareholder Returns
5.4%
3 year 6.9%
7.5%
12.8%
5 year 5.2%
6.6%
12.7%
10 year 9.5%
8.1%
11.0%
15 year 7.3%
7.5%
Emera TSX TSX Utilities Index
Notes
19 (1) As at November 23, 2018Growing and Sustainable Dividend
5.7% CAGR since 2000 4%-5%
target through 2021
$0.84 $0.89 $1.16 $1.31 $1.36 $1.41 $1.48 $1.66 $2.00 $2.13 $2.28
00 05 10 11 12 13 14 15 16 17 18 19F 20F 21F
Notes
20 (1) Denotes annual cash dividends paid.Financial Results–
Project Update
Tampa Electric
Nancy Tower
President & CEO
21 Tampa ElectricFlorida Solar Initiative
• Investing approximately US$850
million to install 600 MW of
solar generation by 2021
EXPECTED IN-SERVICE DATES • Investment earns AFUDC during
construction
• Tranche 1 (145 MW) – in service September 2018
• Tranche 2 (260 MW) – January 2019 • Full and immediate cost
• Tranche 3 (145 MW) – Q1 2020 recovery starting on in-service
• Tranche 4 (50 MW) – Q1 2021
date of each tranche
• Annual net earnings of US$50
million in 2021
22Progress to Date
• Tranche 1 – both projects placed into service in September 2018; customer
rates have been increased in accordance with the SoBRA
• Tranche 2 – Florida Public Service Commission (“FPSC”) approved the
SoBRA on October 29, 2018; projects are permitted and under construction
• Tranche 3 and 4 – projects are beginning development and have started
initial permitting and zoning
23SOLAR PHASE 2
• Potential to invest a further US$850 million of
capital to add additional 600 MW of solar
• Post-2020 investment
• Modernized Big Bend will act as a balancing
resource for additional renewable capacity
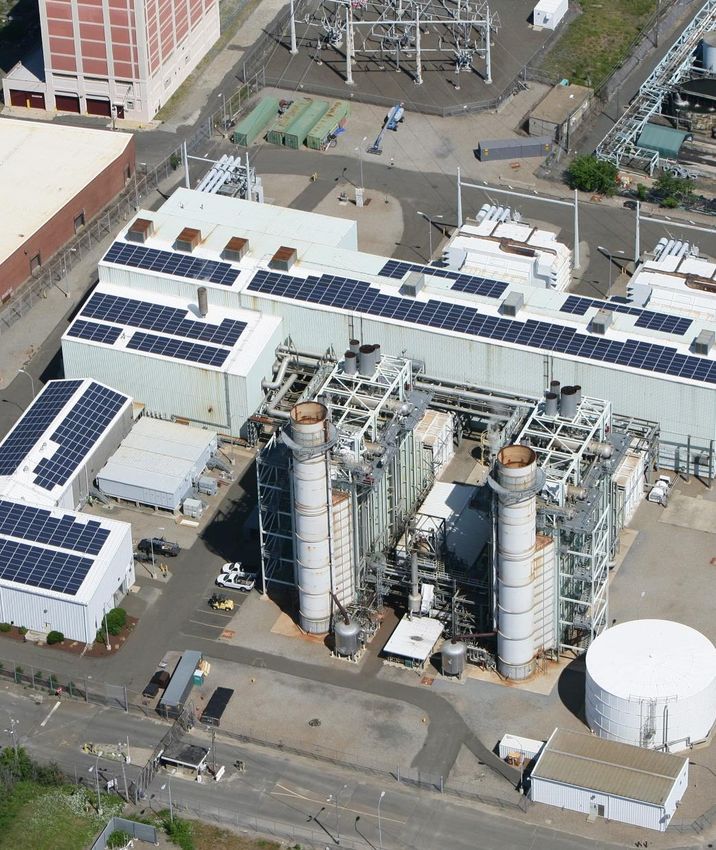
24BIG BEND MODERNIZATION
• Investing approximately US$850 million
to repower Unit 1 with natural gas
combined-cycle technology and retire
Unit 2
• Expect simple-cycle to be operational in
2021 and full combined-cycle in 2023
• Investment will improve land, water and
air emissions, generate customer
savings of approximately US$750 million
and increase plant operating efficiency
25Next Steps
• The project is progressing well with
procurement of major equipment items well
advanced; no scheduling concerns at this
time
• Site Certification (SCA) and Environmental
permits filed; approval anticipated May 2019
• Four major contracts have been awarded so
far and all have come in under budget
• Consistent with standard practice in Florida,
recovery of capital and costs expected to be
included in the next rate application
26INVESTMENTS IN CUSTOMER TECHNOLOGIES
AMI
• US$230 million investment
• Deploying more than 800,000 3rd
generation meters over the next 3 years
LED
• US$135 million investment
• Converting over 200,000 existing non-LED
lights to smart LEDs over the next 4 years
27Financial Results
Financial Outlook
Greg Blunden
CFO
28 Emera Inc.Strong Adjusted Earnings and EPS Growth
Adjusted Net Income(1) Adjusted Earnings per Share(1)
$191 $504 $0.82 $2.17
$387
$0.55 $1.82
$118
+30% +19%
+62% +49%
2017 2018 2017 2018 2017 2018 2017 2018
Q3 September Year-to-Date Q3 September Year-to-Date
(1) Adjusted net income and adjusted EPS are non-GAAP measures
29Growing Operating Cash Flow
September Year-to-Date Operating
Cash Flow
Pre Working Capital
+ 29%
$1,237
$956
2017 2018
30Redeploying Capital to Fund Rate Base Growth
2019-2021 Funding Plan
Reinvested Cash Flow
Asset Sale Proceeds + Common Equity
~$2.0B (30%) Total Capex
~$2.0B (~30%)
~$0.7B ~$0.3B $6.5B
$0.6B - $1.2B $0B - $0.6B ~5%
~$5.5B ~$2.0B ~10%
8% - 18% 0% - 10%
$0.8B
~$1.5B ~$1.5B 12%
~25%
Op. Cash Dividends Holdco Debt OpCo Debt NEGG Other Select Common DRIP Preferred Total
Flow Repayments Issuances Proceeds Asset Sales Equity Equity
Proceeds from select asset sales are expected to materially reduce or potentially eliminate common
equity requirements
31Sale of NEGG – Strategic Rationale
• Create funding flexibility to position Emera for future growth
• Remove uncertainty associated with forward capacity and energy market
conditions in New England
• Increase proportion of regulated earnings, thereby improving the
stability of Emera’s forward earnings and cash flow and reducing credit
risk
32NEGG Delivered Solid Returns for Shareholders
in millions of USD
Initial
Cash In Investment Investment
$541 delivered an
unlevered return
Net Cash Proceeds on investment of
Cash Out Flow
(1)
from Sale approximately 10%
$240 $590
• Initial investment made at $1.04 exchange rate versus at current rate of $1.32
• Assets sold at $516/kW, comparable to or in excess of recent precedent transactions
33 (1) Total operating cash flow less capital expenditures during Emera’s holding period (November 2013 – February 2019E)Sale of NEGG – Impact on 2019 • Prior to the announced transaction, it was expected that NEGG would contribute 2019 earnings in line with our 2018 estimates (approximately US$40- $50 million) • The transaction is targeted to close at the end of February 34
NEGG Sale – Next Steps
     • Transaction close is subject to
       regulatory approvals
     • Net proceeds, net of tax and
       transaction costs, are expected to be
       US$580-585 million
     • Net proceeds to be used to repay
       US$500 million Emera US LP bonds
       maturing in June 2019 and to fund
       ongoing rate base growth
       investments in Florida
     • Expect to record a modest gain on
       sale in Q1 2019
35
Regulatory Update
Rate Base Authorized Allowed Earned
Affiliate Regulator ($ billions) ROE Equity ROE(1) Regulatory Plan
TEC FPSC US$6.0 9.25 – 11.25% 54.0% 11.17% Settlement agreement through 2021
PGS FPSC US$0.9 9.25 – 11.75% 54.7% 11.25% Settlement agreement through 2020
Settlement agreement reached on distribution rate
NMGC NMPRC US$0.6 10.0% n.a. 7.5%
case; resolution expected Q1/19
Rate stabilization agreement through 2019; filing
NSPI UARB CA$3.7 8.75 – 9.25% 40% 9.25%
expected in the first half of 2019
Emera FERC & FERC transmission rates reset annually; new
US$0.7 9.85%(2) 60.4%(2) 8.55%(2)
Maine MPUC distribution rates were effective July 1, 2018
BLP anticipated rate application in 2018 for new
Emera (5)
Multi(3) US$0.6 9.3%(4) n.a. 7.9% rates in 2020; GBPC rate stability agreement
Caribbean
through 2021
NSPI’s rate stabilization agreement through 2019
NSPML UARB CA$1.8 8.75 – 9.25% 30% 9.00% applies to NSPML; NSPML will be seeking recovery
of 2020 rates in 2019 in coordination with NSPI
(1) ReflectsDecember 2017 year-end ROE
(2) Weighted average transmission, distribution and stranded costs
(3) Includes BLP (Fair Trading Commission), GPBC (Grand Bahama Port Authority) and DOMLEC (Independent Regulatory Commission)
36 (4) Weighted average allowed return on rate base (“RORB”)
(5) Domlec’s results were negatively impacted by Hurricane Maria in 2017. Excluding Domlec, the earned RORB in the Caribbean was 9.2% vs. an authorized return of 9.5%.Strengthening the Balance Sheet
• Management goal to improve both ‘left and right’ sides of the balance sheet
• HoldCo debt retirements in combination with decreased exposure to non-regulated cash flows
• Achieving target capital structure and increasing exposure to our highest quality regulated cash
flows improves business risk for all stakeholders
September 30, 2016 September 30, 2018 2020 Target
10.4% 10.9% 10%
25.6% 35%
28.8%
64.0% 60.3% 55%
Debt Equity Preferred equity
Notes:
(1) Preferred equity includes hybrid debt
37 (2) Equity includes the NCI and excludes AOCIFinancial Plan Supports Credit Ratings
• Our financial plan supports our credit ratings, improves our financial
strength and provides increased flexibility going forward
• Specifically, our actions are focused on achieving:
• Improved business risk through the sale of unregulated assets
• Higher sustained CFO/FFO to debt metrics as compared to 2016
and 2017
• Materially reduced holding company debt as a percentage of
total debt
• Lower consolidated leverage
38Financing Strategy
• We have excellent businesses and we are taking the necessary actions to
strengthen our balance sheet and provide financing flexibility in the future
• Over the next twelve months, we will reallocate capital in a disciplined and
prudent manner resulting in a stronger Emera
• Our financing strategy positions us well and supports our long term growth
targets
Over the forecast period, adjusted EPS is expected to grow, on average, at
a rate comparable to rate base growth and is expected to be in line with
current market consensus.
39Business Update
Wrap Up
Scott Balfour
President & CEO
40 Emera Inc.Our Growth Story
1999 2000-2005 2005-2015 2015-2016 2016-2021
BEGIN EXPAND BUILD EXPAND BUILD
Emera Inc. launched with Grow geographic footprint Continued growth through Acquire TECO, doubling the Execute on organic growth
an agenda for growth through acquisitions and tuck-in acquisitions and size of Emera and in regulated electric and
new creation of new energy developing opportunities, establishing a platform for gas utilities
companies including the Maritime Link, growth in Florida
created by the demand for
cleaner affordable energy
41Why Invest in Emera
• 5 year annualized total shareholder return of 11.2% compared 7.0% returned
SUPERIOR SHAREHOLDER by S&P/TSX Capped Utilities Index and 7.7% returned by the S&P/TSX
RETURNS Composite Index
• Attractive valuation by historical standards
• ~90% regulated earnings
STRONG EARNINGS • Adjusted earnings per share CAGR of 7.7% over the last 5 years(1)
• Dividend increase of 4% to $2.35 announced August 9, 2018
GROWING DIVIDENDS • 4-5% dividend CAGR target through 2021
• Attractive 5.4% dividend yield
• Strong cash coverage of dividends
GROWING OPERATING CASH
• 11.7% CAGR in pre working capital operating cash flow per share over the last
FLOWS 5 years
• $6.5+ billion 3-year capital program focused on rate base investments in
VISIBLE GROWTH & FUNDING constructive regulatory jurisdictions
PLAN • Funding to be provided primarily by operating cash flow, OpCo debt in support
of rate base investments and proceeds from select asset sales
Note: All figures as at September 30, 2018
42 (1) Adjusted earnings is a US non-GAAP financial measureAppendix
Toronto, ON
November 27, 2018Capital Forecast by Affiliate
Capital Forecast (CAD millions) 2019F 2020F 2021F Total
Tampa Electric $ 1,410 940 910 3,260
Peoples Gas 310 340 310 960
New Mexico Gas Company 100 190 140 430
Nova Scotia Power 340 330 350 1,020
Emera Maine 90 150 110 350
Emera Caribbean 160 70 70 300
Emera Newfoundland - 190 - 190
Other (incl. Seacoast) 80 80 60 220
Less: Asset Sale Program Adjustment - (140) (110) (250)
Subtotal – Baseline Capital Forecast $ 2,490 2,140 1,840 6,480
Add: Opportunities Under Development - 190 1,130 1,320
Total Capital Forecast 2,490 2,340 2,970 7,800
(1) In
millions of Canadian dollars. Forecasted capital includes AFUDC. U.S. dollar denominated capex is translated at a forecasted average USD/CAD exchange
44 rate of 1.30 in 2019-2021.Rate Base Forecast by Affiliate
2017- 2018-
2020 2021
Rate Base (CAD millions)(1) 2017A 2018F 2019F 2020F 2021F CAGR CAGR
Tampa Electric(2) $ 7,850 8,400 9,375 10,150 10,650 8.9% 8.2%
Peoples Gas(2) 1,175 1,250 1,475 1,700 1,900 13.1% 15.0%
New Mexico Gas Company 775 725 750 850 925 3.1% 8.5%
Nova Scotia Power 3,675 3,775 3,950 4,200 4,350 4.6% 4.8%
Emera Maine 950 950 950 1,000 1,075 1.7% 4.2%
Emera Caribbean 750 825 1,050 1,050 1,025 11.9% 7.5%
Maritime Link(3) 1,800 1,800 1,800 1,775 1,725 -0.5% -1.4%
Labrador Island Link(4) 1,100 1,175 1,300 1,875 1,850 19.5% 16.3%
Less: Expected Asset Sales - - - (1,000) (1,000) n.a. n.a.
Total $ 18,075 18,900 20,650 21,600 22,500 6.1% 6.0%
(1) Average total rate base in billions of Canadian dollars. U.S. dollar denominated capex is translated at a forecasted average USD/CAD exchange rate of 1.30 in 2018-2021.
(2) Includes deferred tax liability, a zero cost-of-capital component of the regulated capital structure in Florida
45 (3) Maritime Link begins to depreciate in 2020 when Muskrat Falls is fully operational
(4) Implied rate base based on a 45% equity thickness.Target Long-term HoldCo Debt Retirements
Target Debt Retirements Issuance
(CAD millions) Currency 2019F 2020F 2021F Total
Emera Finance LP USD $ 650 - - 650
Emera Inc. CAD 225 - - 225
NMGI USD 65 - - 65
TECO Finance USD - 390 - 390
Total $ 940 390 - 1,330
(1) In billions of Canadian dollars. U.S. dollar denominated debt is translated at a forecasted average USD/CAD exchange rate of 1.30 in 2019-2021.
46You can also read