Debt investor update 19 May 2017 - Experian plc
←
→
Page content transcription
If your browser does not render page correctly, please read the page content below

Debt investor update 19 May 2017

Disclaimer
THIS PRESENTATION IS NOT AN OFFER OR SOLICITATION OF AN OFFER TO BUY OR SELL SECURITIES. IT IS SOLELY FOR USE AT AN INVESTOR PRESENTATION AND IS PROVIDED AS INFORMATION ONLY. THIS
PRESENTATION DOES NOT CONTAIN ALL OF THE INFORMATION THAT IS MATERIAL TO AN INVESTOR. BY ATTENDING THE PRESENTATION OR BY READING THE PRESENTATION SLIDES YOU AGREE TO BE BOUND AS
FOLLOWS:
This presentation is strictly confidential to the recipient, is being distributed to a limited range of invited persons solely for their own information, may not be distributed to the press or any other person, and may not be reproduced or published, in
whole or in part, in any form. Failure to comply with this restriction may constitute a violation of applicable securities laws.
This document is not a prospectus for any securities. Investors should only subscribe for any securities on the basis of information in a relevant prospectus and term sheet, and not on the basis of any information provided herein.
This presentation has been prepared by Experian plc (the “Company”) and may be amended and supplemented and may not be relied upon for the purposes of entering into any transaction. The information contained herein has been obtained from
sources believed to be reliable. Although the Company has taken all reasonable care to ensure that the information herein is accurate and correct, no representation, warranty or undertaking, express or implied, is given by or on behalf of the
Company or any of its directors, officers, employees, shareholders, affiliates, agents, advisers, other representatives (collectively, "Representatives") or any other person as to, and no reliance should be placed on, the fairness, accuracy,
completeness or correctness of the information or the opinions contained herein or any other material discussed at the presentation. Neither the Company nor any Representatives nor any other person shall have any liability whatsoever (in
negligence or otherwise) for any loss howsoever arising from any use of this presentation or any other material discussed at the presentation or their contents or otherwise arising in connection with the presentation. The views reflected herein are
solely those of the Company and are subject to change without notice. All estimates, projections, valuations and statistical analyses are provided to assist the recipient in the evaluation of the matters described herein and may be based on subjective
assessments and assumptions and may use one among alternative methodologies that produce different results, and to the extent that they are based on historical information, they should not be relied upon as an accurate prediction of future
performance. Certain analysis is presented herein and is intended solely for purposes of indicating a range of outcomes that may result from changes in market parameters. It is not intended to suggest that any outcome is more likely than another,
and it does not include all possible outcomes or the range of possible outcomes, one of which may be that the investment value declines to zero.
This presentation may include forward-looking statements that reflect the Company’s intentions, beliefs or current expectations. Forward-looking statements involve all matters that are not historical by using the words “may”, “will”, “would”, “should”,
“expect”, “intend”, “estimate”, “anticipate”, “target”, “believe” and similar expressions or their negatives. Such statements are made on the basis of assumptions and expectations that the Company currently believes are reasonable, but could prove to
be wrong. Any forward-looking statements made by or on behalf of the Company speak only as at the date of this presentation. Save as required by any applicable laws or regulations, the Company undertakes no obligation publicly to release the
results of any revisions to any forward-looking statements in this document that may occur due to any change in its expectations or to reflect events or circumstances after the date of this document.
This presentation contains certain non-GAAP financial information. The Company’s management believes that these measures provide valuable additional information in understanding the performance of the Company or the Company’s businesses
because they provide measures used by the Company to assess performance. Although these measures are important in the management of the business, they should not be viewed as replacements for, but rather as complementary to, the GAAP
measures.
No action has been taken or will be taken that would permit a public offering of any securities in any jurisdiction in which action for that purpose is required. No offers, sales, resales or delivery of any securities or distribution of any offering material
relating to any such securities may be made in or from any jurisdiction except in circumstances which will result in compliance with any applicable laws and regulations.
The distribution of this presentation in certain jurisdictions may be restricted by law and persons into whose possession this document comes should inform themselves about, and observe any such restrictions. This presentation is for the recipient’s
use only. This presentation is not for distribution to retail clients. Neither the presentation nor any copy of it may be taken or transmitted into the United States of America, its territories or possessions, or distributed, directly or indirectly, in the United
States of America, its territories or possessions. Any failure to comply with this restriction may constitute a violation of U.S. securities laws. The presentation is not an offer of securities for sale in the United States. Neither the Company nor Experian
Finance plc intend to conduct a public offering of any securities in the United States. Securities may not be offered or sold in the United States except pursuant to an exemption from, or transaction not subject to, the registration requirements of the
This presentation is being communicated only to (i) persons who are outside the United Kingdom, (ii) persons who have professional experience in matters relating to investments falling within Article 19(5) of The Financial Services and Markets Act
2000 (Financial Promotion) Order 2005 (the “Order”), or (iii) high net worth entities, and other persons to whom it may lawfully be communicated, falling within Article 49(2)(a) to (d) of the Order (all such persons together being referred to as “relevant
persons”). This presentation is communicated only to relevant persons and must not be acted on or relied on by persons who are not relevant persons. Any investment or investment activity to which this presentation relates is available only to
relevant persons and will be engaged in only with relevant persons. By attending the presentation to which this document relates or by accepting this document you will be taken to have represented, warranted and undertaken that (i) you are a
relevant person (as defined above); (ii) you have read and agree to comply with the contents of this notice; and (iii) you will treat and safeguard as strictly private and confidential all such information and take all reasonable steps to preserve such
confidentiality.
This presentation does not constitute an offer or an agreement, or a solicitation of an offer or an agreement, to enter into any transaction (including for the provision of any services). No assurance is given that any such transaction can or will be
arranged or agreed. Before entering into any transaction, you should consider the suitability of the transaction to your particular circumstances and independently review (with your professional advisers as necessary) the specific financial risks as well
as the legal, regulatory, credit, tax and accounting consequences. This document does not disclose all the risks and other significant issues related to an investment in any securities/transaction. Prior to transacting, potential investors should ensure
that they fully understand the terms of any securities/transaction and any applicable risks.

 2       © Experian Public

Presenters

                        Antony Barnes                   Nadia Ridout-Jamieson
                        Director of Corporate Finance   Chief Communications Officer

3   © Experian Public
Overview
Snapshot of Experian

•   Total Revenue: US$4.3bn
•   Benchmark EBIT: US$1.2bn
•   Market Cap*: c.£16bn
•   In top 50 of FTSE-100
•   Employees: c.16,000
•   Offices in 37 countries
•   Largest markets: US, Brazil, UK
•   Corporate headquarters: Dublin

    Experian is the world’s leading global
    information services company. Our roots lie in
    assessing credit risk; today we do much more.

                        For the year ending 31 March 2017
4   © Experian Public   * At 18 May 2017
Overview
                        The Experian investment case

                          Market leading global information company
                           • Unique proprietary data, coupled with
                             analytics and software
                           • Scalable business model
                          Strong market positions
                           • No. 1 or 2 position across our largest markets
                           • High barriers to entry
                          Significant growth potential
                           • By bringing our assets together to access new
                             market opportunities
                          Strong financial track record
                           • High quality, recurring revenues
                           • Highly cash generative with low capital intensity

5   © Experian Public
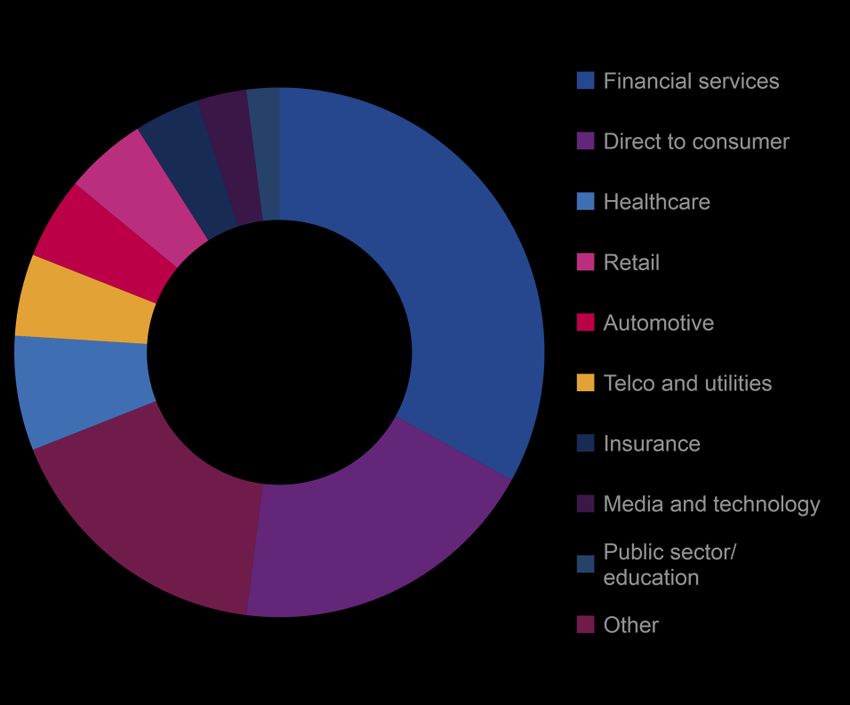
Overview
 Global revenue FY17
                    EMEA/Asia Pacific
                                                                                    By customer segment
                                8%
                UK and
                Ireland 19%                                                                     2%
                                                                                          4% 3%
By region                                       North
                                               America
                                        56%                                               5%
                          17%
                                                                                     5%
                Latin
                                                                                                           33%
               America                                                               5%

                                                                                     7%

                                              Consumer Services                                                  33%

                         By business                         22%                          17%        19%
                           activity      Marketing
                                                       10%
                                         Services
                                                                          Credit
                                                                   55%   Services
                                                       13%
                                           Decision
                                           Analytics

 6            Diverse portfolio by region, business activity and customer segment
     © Experian Public
Overview
Market leader with unparalleled global reach and range
                           5,000
                                    4,3351
                           4,500
                           4,000
     Global revenue US$m

                           3,500
                                     44%                3,1452
                           3,000
                           2,500                         34%

                           2,000                                             1,7662                 1,7042
                                                                              12%                   17%
                           1,500
                                     56%                                                                                  1,0203                 8814
                           1,000                         66%
                                                                               88%                                         9%
                                                                                                     83%                                        36%
                            500                                                                                           91%
                                                                                                                                                64%
                              0
                                   Experian            Equifax            TransUnion                 D&B                Acxiom                  FICO
                                   (Baa1 / A-)       (Baa1 / BBB+)          (NR / BB)            (NR / BB+)            (NR / NR)             (NR / NR)
                                                                     North America               Other regions

                      1 Year ended 31 March 2017                3 Year ended 31 March 2016                      *US only. NR = not rated by Moody’s or S&P.
7   © Experian Public 2 Year ended 31 December 2016             4 Year ended 30 September 2016                  Source: Latest full year revenue, company SEC filings
                      This analysis covers traditional competitors that are publicly listed. It does not include companies where a single division competes against Experian.
Overview
Twelve year performance
            Revenue US$m                                                                                                                   4,772          4,658
                                                                                                                             4,582
                                                                                                                4,456
            Benchmark EBIT US$m                                                                                                                                         4,164   4,335
                                                                      3,790         3,803         3,859                                    1,309
                                                        3,712                                                                                            1,271                  1,199
                                                                                                                             1,244
                                          3,407                                                                 1,169                                                   1,130
                            2,930
                                                                                                   991
                                                                       896           932
                                                         848
                                            747
                              616

                            FY06           FY07         FY08          FY09          FY10          FY11         FY12          FY13          FY14           FY15          FY16    FY17
              Organic
              revenue
               growth
                              12%           8%            4%            3%            2%            8%         10%             8%            5%            1%           5%        5%
            Cash flow
           conversion       102%          100%            99%        101%          100%            98%          96%          94%          101%           104% 106%              96%

Global ongoing activities revenue and Benchmark EBIT only. Excluding growth rates, FY06 to FY15 revenue, Benchmark EBIT and cash flow conversion may have
been adjusted to exclude various exited business activities and discontinued operations, 2016 results have been restated to reflect the email/cross-channel marketing
business ('CCM') reclassification as a discontinued operation. – for further information refer to the respective Annual Reports available on www.experianplc.com.
Revenue growth shown at constant FX rates. Growth rates are not restated.
8    © Experian Public
Business overview

9   © Experian Public
Business overview
Experian business activities

        Credit                                    Decision                             Marketing                 Consumer
        Services                                  Analytics                            Services                  Services
        • Large databases of                      • Helping clients to:                • Data quality and        • Direct to consumer
          information, used to                         • Lend effectively                management                credit monitoring
          manage risk                                                                  • Targeting relevant      • Credit matching
                                                       • Minimise the risk
        • 17 consumer credit                             of fraud                        offers to individuals     services / lead
          bureaux                                                                                                  generation
                                                  • Using advanced
        • 11 business credit                        software and                                                 • Identity theft
          bureaux                                   analytics, and expert                                          protection services
        • Automotive                                consulting                                                   • Affinity (white label)
          information                                                                                              credit and identity
        • Health                                                                                                   monitoring services

                         55%                                           13%                         10%                        22%
10   © Experian Public   % split of revenue shown for the year ending 31 March 2017.
Business overview
Credit Services
We help organisations lend responsibly and protect themselves and their customers
from risk. From our 17 consumer and 11 business information bureaux, we provide
What we do
millions of credit reports every day, enabling lending decisions to be made fairly,
responsibly and quickly to people and businesses.
Market position We’re the number one or two operator in our key markets.
Competitors Our main competitors are Equifax, TransUnion, and Dun and Bradstreet
Financial
Our revenue is primarily transactional, pricing is volume-tiered, per report delivered
Characteristics
11 © Experian PublicBusiness overview
Decision Analytics
We help our customers to lend effectively and to minimise the risk of fraud by
developing advanced software and models to analyse data. We help our clients
What we do
minimise risk to their organisation while delivering the customer experience that
people expect.
Market position We’re a market-leading provider in our key markets
Competitors Our competitors include Fair Isaac, IBM, SAS and smaller niche providers.
Financial Scores and checks are sold on a transactional, volume-tiered basis. Software and
Characteristics system sales include implementation fees, recurring licence fees and transactions.
12 © Experian PublicBusiness overview
Marketing Services
We help businesses to understand their customers. We use our strengths in data
management and analytics to give our clients a clear picture of who each individual is
What we do
and of their needs, so they can target relevant offers and communications to each
individual.
Market position We hold leading positions in targeting and data quality in our key markets.
Competitors Our competitors include Acxiom, Epsilon, GB Group, Oracle and Trillium.
Financial
Our revenue comes from transactions, data licences and subscription fees.
Characteristics
13 © Experian PublicBusiness overview
Consumer Services
We empower people to take control of their credit – helping people to understand and
What we do better manage their financial position, while protecting themselves from identity theft
and fraud.
Market position We are a market leader in the USA, Brazil and the UK.
Our competitors include CallCredit, Credit Karma, Equifax, Fair Isaac, TransUnion
Competitors
and other niche providers.
Financial Subscription and transaction fees from consumers, revenue on white-label
Characteristics partnerships, and commissions for credit offers from financial services providers.
14 © Experian PublicBusiness overview
Revenue and Benchmark EBIT by business activity
Twelve months ended 31 March
US$million
Benchmark
Total Organic
Revenue 2017 2016 EBIT
growth % growth %
margin
Credit Services 2,389 2,240 6 6 34.2%
Decision Analytics 584 566 9 9 20.5%
Marketing Services 421 407 8 8 22.6%
Consumer Services 941 951 2 (4) 25.8%
Total revenue – ongoing activities 4,335 4,164 6 5
Benchmark EBIT – ongoing activities 1,199 1,130 7
Benchmark EBIT margin 27.7% 27.1%
All results are Benchmark figures and are on an ongoing activities basis. Growth at constant exchange rates.
15 © Experian Public The 2016 results have been restated to reflect the email/cross-channel marketing business ('CCM') reclassification as a discontinued operation.Business overview
Revenue and Benchmark EBIT by region
Twelve months ended 31 March
US$million
Benchmark
Total Organic
Revenue 2017 2016 EBIT
growth % growth %
margin
North America 2,457 2,294 7 5 31.8%
Latin America 730 631 9 9 34.4%
UK and Ireland 807 924 1 1 30.5%
EMEA/Asia Pacific 341 315 9 9 (0.9)%
Total revenue – ongoing activities 4,335 4,164 6 5
Benchmark EBIT – ongoing activities 1,199 1,130 7
Benchmark EBIT margin 27.7% 27.1%
All results are Benchmark figures and are on an ongoing activities basis. Growth at constant exchange rates.
16 © Experian Public The 2016 results have been restated to reflect the email/cross-channel marketing business ('CCM') reclassification as a discontinued operation.Strategic overview 17 © Experian Public
Strategic overview
A clear plan of action

                                         Improve
                         Growth        performance        Efficiency
         Focus                                                              Capital
                                                                          optimisation

     • Simplified our portfolio
     • Growth has returned to our target range
     • Considerably improved performance in Brazil and Marketing Services
     • Executing on a strategic repositioning of our relationship with consumers
     • Driven substantial efficiencies from our business, and used the funds to invest
     • Innovation is accelerating
     • Rigorous approach to capital allocation

18   © Experian Public
                                                                                         18
Strategic overview
Defining the path ahead: our growth objectives
Broaden and deepen our data assets
Extend our lead in analytics and software solutions
Exploit the breadth of our capabilities
Accelerate pace of innovation
Scale in targeted verticals and geographies
Transform engagement with consumers
19 © Experian PublicFinancial overview 20 © Experian Public
Financial overview
Highlights – from FY17 (post discontinued operations)
              Twelve months ended 31 March 2017
              US$million

                                                      Revenue                                                                                          US$4,335m
                              Revenue                 Total revenue growth                                                                                6%

                                                      Organic revenue growth                                                                              5%

                                                      Benchmark EBIT                                                                                   US1,199m
                                  EBIT                Benchmark EBIT margin                                                                              27.7%

                                                      Benchmark EBIT growth                                                                               7%

                                                      Benchmark operating cash flow                                                                     $1,149m
                             Operating
                             cash flow
                                                      Benchmark operating cash flow conversion                                                            96%

                                                       Net debt                                                                                        US$3,173m
                               Funding
                                                       Leverage ratio of Net debt / Benchmark EBITDA                                                      2.1x

21   © Experian Public   Benchmark metrics exclude the discontinued operations of email/cross-channel marketing. Revenue, Benchmark EBIT growths and
                         Benchmark EBIT margin are on an ongoing activities basis and at constant currency
                         See note 5 to the FY17 Group financial statements on our website for definitions of non-GAAP measures
Financial overview
A broad portfolio
FY17: +5% organic growth Two thirds of the portfolio growing in mid-high single digit
9%
8% 8%
6%
3%
EMEA/APAC
Credit Services
UK&I Latin America Global Marketing North America Global
(3%) (2%) Credit Credit Services Services Credit Services Decision Analytics
North America Services
Consumer
Services
(9)%
UK&I
Consumer
Services
Horizontal axis indicates share of revenue excluding CSIdentity and vertical axis indicates organic revenue growth.
22 © Experian PublicFinancial overview
Benchmark cashflow
Twelve months ended 31 March 2017
US$million
21
1,199 (393)
(70)
322 Working 1,149
capital and Net interest (144)
other paid (2)
Tax paid on Dividends to 933
operating minorities
activities
Net capital Amortisation
expenditure and
depreciation
96% 112%
conversion of Benchmark conversion of Benchmark
EBIT into Benchmark earnings into Benchmark
operating cash flow free cash flow
Benchmark Benchmark Benchmark free
EBIT operating cash cash flow
flow
23 © Experian Public Benchmark metrics exclude the discontinued operations of email/cross-channel marketing
See note 5 to the FY17 Group financial statements on our website for definitions of non-GAAP measuresCapital strategy
Capital allocation
US$m
FY17
1,600
Capital allocation Other
Increase in Acquisitions
1,400 net debt and minority
• Disciplined capital allocation framework investments
1,200
1,000
• Strong cash generation Share repurchase
programme1
800 Funds from
Operations2
• Organic innovation investment 600 Dividends
400
• Selective acquisitions
Organic capital
200
investment
• Shareholder remuneration 0
Cash Uses of
generated cash
1 Share repurchases as at 31 March 2017.
2 Funds from Operations is defined as Benchmark free cash flow plus organic capital investment (capital expenditure).
24 © Experian PublicCapital strategy
Net Debt / Benchmark EBITDA
Net debt to EBITDA
US$bn
6.0 3.0
5.0 2.5
4.0 2.0
3.0 1.5
2.0 1.0
1.0 0.5
0.0 0.0
FY07 FY08 FY09 FY10 FY11 FY12 FY13 FY14 FY15 FY16 FY17
Current target net debt to
Net debt Net debt to EBITDA range
EBITDA Former target net debt to
EBITDA range
25 © Experian Public Net debt includes adjustment for the Serasa put option FY08-FY12Financial overview
Consistent credit rating history
Rating
Mar 2017
S&P Moody's
S&P:
Re-affirmed
Unchanged
A3 / A- A-
Apr 2017
Baa1/BBB+ Moody’s:
Re-affirmed
Unchanged
Baa1
Jun 2007
Jul 2009 Nov 2010 Dec 2011
Oct 2006 Moody’s:
Baa1/BBB+ Negative Moody’s: S&P: S&P:
(at IPO) Outlook (at Returned to Positive Upgraded
Serasa Stable Outlook to A-
acquisiiton)
Rating policy: maintain strong investment grade rating (at least Baa1/BBB+)
26 © Experian PublicFinancial overview
Treasury policies
Liquidity
• Maintain significant undrawn committed bank facilities
Refinancing
• Space out debt maturities to mitigate refinancing risk
Dividends
• Grow dividends in line with underlying earnings
Ratings
• Maintain strong investment grade (at least Baa1/BBB+)
27 © Experian PublicFinancial overview
Treasury policies (cont.)
Interest rate risk
• 50-100% of net funding to be fixed rate for over 6
months
• Interest rate swaps used to adjust the balance
between fixed and floating rate liabilities
Currency risk
• Borrowings broadly match currencies of earnings
• Currently no borrowings in Brazilian Real or
Colombian Peso
• FX contracts used to manage currency exposure
• Borrowings after forward FX (March 2017):
USD: US$2.6bn (81%);
GBP/EUR/Other: US$0.6bn (19%)
28 © Experian PublicFinancial overview Capital strategy
US$5.5
US$5.5 billion billion committed
committed fundingfunding at 31 March
at 31 March 20172017
$3,000 m
$2,500 m
$2,000 m
One financial
covenant under
committed bank
$1,500 m facilities:
1800
50 • Covenanted
$1,000 m
Benchmark
450 225
EBIT interest
cover > 3x
$500 m
300 707 • March 2017
600 640
498 actual cover 16x
200
$0 m
2017 2018 2019 2020 2021
Bonds Drawn bank loans Undrawn committed bank facilities
29 © Experian Public Data presented above as at 31 March 2017
29Financial overview
Summarised organisation chart
Guarantor Experian plc
(Ireland)
(Jersey incorporated)
Experian Finance plc (UK) Issuer
Brazil &
Asia Pacific EMEA US UK
Colombia
operating operating operating operating
operating
businesses businesses businesses businesses
businesses
Corporate headquarters: Dublin, Ireland
30 © Experian PublicAppendix 31 © Experian Public
Appendix
North America
     Twelve months ended 31 March
     US$million

      Revenue                                                                     2017    2016   Total growth   Organic growth

      Credit Services                                                            1,341   1,237            8%               8%

      Decision Analytics                                                          162     161             0%               0%

      Marketing Services                                                          215     200             8%               8%

      Business-to-Business                                                       1,718   1,598            8%               8%

      Consumer Services                                                           739     696             6%             (2)%

      Total revenue – ongoing activities                                         2,457   2,294            7%               5%

      Benchmark EBIT – ongoing activities                                         781     704            11%

      Benchmark EBIT margin                                                      31.8%   30.7%

     All results are Benchmark figures and are on an ongoing activities basis.
     Growth at constant exchange rates

32    © Experian Public
Appendix
Latin America
Twelve months ended 31 March
US$million
Revenue 2017 2016 Total growth Organic growth
Credit Services 658 579 6% 6%
Decision Analytics 48 36 34% 34%
Marketing Services 24 16 39% 39%
Total revenue – ongoing activities 730 631 9% 9%
Benchmark EBIT – ongoing activities 251 226 3%
Benchmark EBIT margin 34.4% 35.8%
All results are Benchmark figures and are on an ongoing activities basis.
Growth at constant exchange rates
33 © Experian PublicAppendix
UK and Ireland
Twelve months ended 31 March
US$million
Revenue 2017 2016 Total growth Organic growth
Credit Services 246 275 3% 3%
Decision Analytics 214 234 5% 5%
Marketing Services 145 160 5% 5%
Business-to-Business 605 669 4% 4%
Consumer Services 202 255 (9)% (9)%
Total revenue – ongoing activities 807 924 1% 1%
Benchmark EBIT – ongoing activities 246 297 (4)%
Benchmark EBIT margin 30.5% 32.1%
All results are Benchmark figures and are on an ongoing activities basis.
Growth at constant exchange rates
34 © Experian PublicAppendix
EMEA/Asia Pacific
Twelve months ended 31 March
US$million
Revenue 2017 2016 Total growth Organic growth
Credit Services 144 149 (3)% (3)%
Decision Analytics 160 135 21% 21%
Marketing Services 37 31 16% 16%
Total revenue – ongoing activities 341 315 9% 9%
Benchmark EBIT – ongoing activities (3) (15) n/a
Benchmark EBIT margin (0.9)% (4.8)%
All results are Benchmark figures and are on an ongoing activities basis.
Growth at constant exchange rates
35 © Experian PublicAppendix
Contacts
Experian
Cardinal Place
80 Victoria Street Tel: +44 (0)203 042 4200
London Website: www.experianplc.com
SW1E 5JL
Nadia Ridout-Jamieson Antony Barnes
Chief Communications Officer Director of Corporate Finance
Email: nadia.rjamieson@experian.com Email: antony.barnes@experian.com
Andy Simms Sarah Schibli
Head of Investor Relations Investor Relations and Communications Manager
Email: andrew.msimms@experian.com Email: sarah.schibli@experian.com
36 © Experian Public©2017 Experian Information Solutions, Inc. All rights reserved. Experian and the Experian marks used herein are trademarks or registered trademarks of Experian Information Solutions, Inc. Other product and company names mentioned herein are the trademarks of their respective owners. No part of this copyrighted work may be reproduced, modified, or distributed in any form or manner without the prior written permission of Experian. Experian Public
You can also read