Earnings Results 1Q 2021 - INVESTOR PRESENTATION (Nasdaq: OCDX) - Investor Relations | Ortho-Clinical ...
←
→
Page content transcription
If your browser does not render page correctly, please read the page content below

Earnings
                 Results
                 1Q 2021
INVESTOR         May 5, 2021
PRESENTATION
(Nasdaq: OCDX)
HIGHLY CONFIDENTIAL © Ortho Clinical Diagnostics 2021

Forward-Looking Statements
This presentation and the oral remarks may contain “forward-looking statements” within the meaning of Section 27A of the Securities Act of 1933, as amended, and Section 21E of the Securities
Exchange Act of 1934, as amended. Such forward-looking statements reflect, among other things, our current expectations and anticipated results of operations, all of which are subject to known
and unknown risks, uncertainties and other factors that may cause our actual results, performance or achievements, market trends, or industry results to differ materially from those expressed or
implied by such forward-looking statements. Therefore, any statements contained herein that are not statements of historical fact may be forward-looking statements and should be evaluated as
such. Without limiting the foregoing, the words as “anticipate,” “expect,” “suggest,” “plan,” “believe,” “intend,” “project,” “forecast,” “estimates,” “targets,” “projections,” “should,” “could,” “would,”
“may,” “might,” “will,” and the negative thereof and similar words and expressions are intended to identify forward-looking statements. Factors that might materially affect such forward looking
statements include: the ongoing global coronavirus (COVID-19) pandemic; increased competition; manufacturing problems or delays or failure to develop and market new or enhanced products or
services; adverse developments in global market, economic and political conditions; our ability to obtain additional capital on commercially reasonable terms may be limited or non-existent; our
inability to implement our strategies for improving growth or to realize the anticipated benefits of any acquisitions and divestitures, including as a result of difficulties integrating acquired businesses
with, or disposing of divested businesses from, our current operations; a need to recognize impairment charges related to goodwill, identified intangible assets and fixed assets; our ability to operate
according to our business strategy should our collaboration partners fail to fulfill their obligations; risk that the insurance we will maintain may not fully cover all potential exposures; product recalls
or negative publicity may harm our reputation or market acceptance of our products; decreases in the number of surgical procedures performed, and the resulting decrease in blood demand;
fluctuations in our cash flows as a result of our reagent rental model; terrorist acts, conflicts, wars and natural disasters that may materially adversely affect our business, financial condition and
results of operations; the outcome of legal proceedings instituted against us and/or others; risks associated with our non-U.S. operations, including currency translation risks, the impact of possible
new tariffs and compliance with applicable trade embargoes; the effect of the United Kingdom’s withdrawal from the European Union; our inability to deliver products and services that meet
customers’ needs and expectations; failure to maintain a high level of confidence in our products; significant changes in the healthcare industry and related industries that we serve, in an effort to
reduce costs; reductions in government funding and reimbursement to our customers; price increases or interruptions in the supply of raw materials, components for our products, and products and
services provided to us by certain key suppliers and manufacturers; our ability to recruit and retain the experienced and skilled personnel we need to compete; work stoppages, union negotiations,
labor disputes and other matters associated with our labor force; consolidation of our customer base and the formation of group purchasing organizations; unexpected payments to any pension
plans applicable to our employees; our inability to obtain required clearances or approvals for our products; failure to comply with applicable regulations, which may result in significant costs or the
suspension or withdrawal of previously obtained clearances or approvals; the inability of government agencies to hire, retain or deploy personnel or otherwise prevent new or modified products
from being developed, cleared or approved or commercialized in a timely manner; disruptions resulting from former President Trump’s invocation of the Defense Production Act; our inability to
maintain our data management and information technology systems; data corruption, cyber-based attacks, security breaches and privacy violations; our inability to protect and enforce our
intellectual property rights or defend against intellectual property infringement suits against us by third parties; risks related to changes in income tax laws and regulations; risks related to our
substantial indebtedness; our ability to generate cash flow to service our substantial debt obligations; and risks related to the ownership of our ordinary shares, including the fact that we are a
“controlled company” within the meaning of the corporate governance standards of Nasdaq. Unless legally required, we assume no obligation to update any such forward-looking information to
reflect actual results or changes in the factors affecting such forward-looking information.

Information contained in this presentation concerning our industry and the markets in which we operate, including our general expectations and market position, market opportunity and market size,
is based on information from various sources, on assumptions that we have made that are based on such information and other similar sources and on our knowledge of, and expectations about,
the markets for our service offerings. This information involves a number of assumptions and limitations and you are cautioned not to give undue weight to such estimates.
                                                                                                                                                                                                                2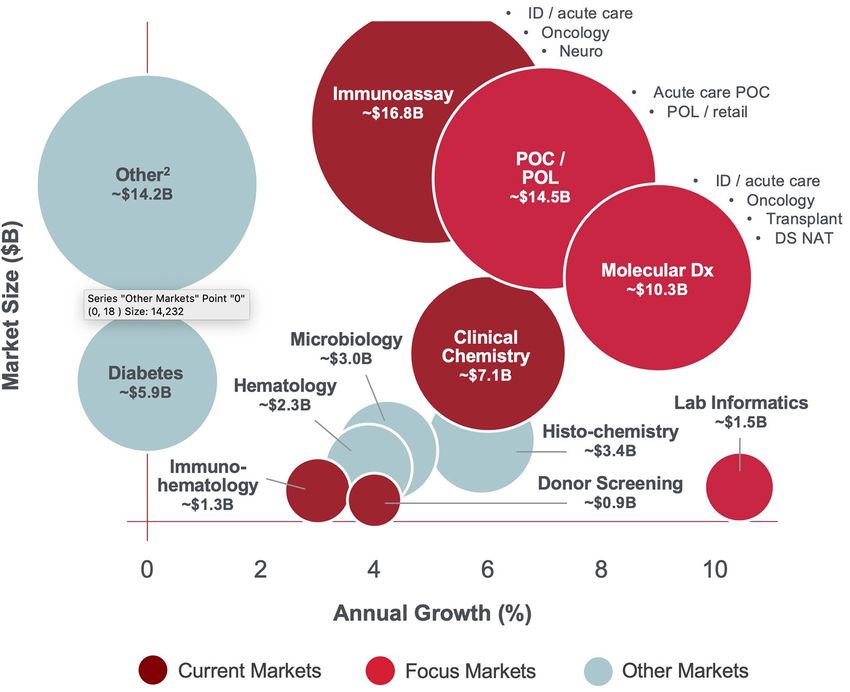
HIGHLY CONFIDENTIAL © Ortho Clinical Diagnostics 2021

Non-GAAP Financial Measures
This presentation contains financial measures, such as constant-currency growth rate, adjusted EBITDA, adjusted net income, adjusted diluted EPS and adjusted free cash flow, which are
considered non-GAAP financial measures under applicable U.S. Securities and Exchange Commission rules and regulations. These non-GAAP financial measures should be considered
supplemental to, and not a substitute for, financial information prepared in accordance with U.S. generally accepted accounting principles (GAAP). Adjusted EBITDA, adjusted net income, adjusted
diluted EPS and adjusted free cash flow eliminate impacts of certain non-cash, unusual or other items that that we do not consider indicative of our ongoing operating performance. The Company’s
definitions of these non-GAAP measures may differ from similarly titled measures used by others. The Company generally uses these non-GAAP financial measures to facilitate management’s
financial and operational decision-making, including evaluation of the Company’s historical operating results, comparison to competitors’ operating results and determination of management
incentive compensation. These non-GAAP financial measures reflect an additional way of viewing aspects of the Company’s operations that, when viewed with GAAP results and the reconciliations
to corresponding GAAP financial measures, may provide a more complete understanding of factors and trends affecting the Company’s business. Because non-GAAP financial measures exclude
the effect of items that will increase or decrease the Company’s reported results of operations, management strongly encourages investors to review the Company’s consolidated financial
statements and publicly filed reports in their entirety. Reconciliations of the non-GAAP financial measures to the most directly comparable GAAP financial measures are included in the tables in this
presentation. For example, such reconciling items include the impact of unrealized foreign currency exchange gains or losses, gains or losses that are unusual or nonrecurring in nature, as well as
discrete taxable events. We cannot estimate or project these items and they may have a substantial and unpredictable impact on our results presented in accordance with GAAP. Some columns
and rows within tables may not add due to rounding. Percentages have been calculated using actual, non-rounded figures.

                                                                                                                                                                                                         3
OUR MISSION
We improve and save lives.
We enable our customers to
optimize the long-term value for
patients through our innovative
IVD solutions and services.

HIGHLY CONFIDENTIAL © Ortho Clinical Diagnostics 2021
Core Revenue Core Revenue
Grew to Increased
$499M 21.1%(a)
1Q 21 In Review: Operating Income Adjusted EBITDA
Strong Momentum Increased of $152M
Represented an
382%
Commercial Excellence programs in
the Americas – accelerates growth to Increase of
29%
Continued strong rebound in many
emerging markets – 1Q growth of
net loss per diluted share was ($0.19),
adjusted earnings per share was $0.26 49%
17%
Core Revenue growth of 14%,
excluding COVID-19
(a) Constant Currency 5
Reference non-GAAP reconciliation slide for details
HIGHLY CONFIDENTIAL © Ortho Clinical Diagnostics 2021

Strong Growth in Core Business Continues Into FY 2021
Core Revenue % Growth (Excl. local HCV)

Core Excl. HCV
                                                                                                                                         21%
    CoV-2
                                                                                                                          10%
 Core Excl.
 HCV/CoV-2                                                                                                                   10%
                                                                                 6%                                     Clinical Chemistry
                                                                                                5%
                                                                4%                       4%                      4%            33%
                 1%        1%

                                          (3%)
                                Clinical Chemistry
                                       62%

                                                                                                        (12%)
                 2017     2018              Q1 19             Q2 19             Q3 19   Q4 19   Q1 20   Q2 20   Q3 20       Q4 20        Q1 21

                                                                                                                                                 6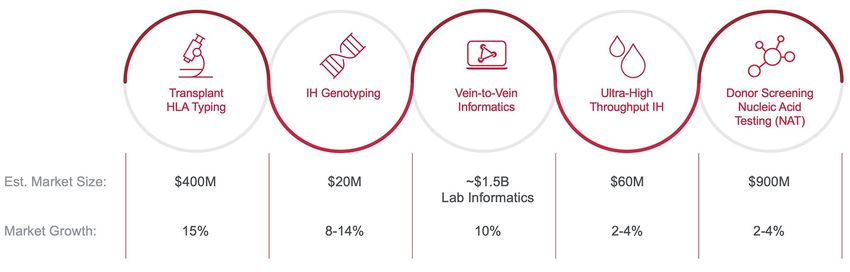
HIGHLY CONFIDENTIAL © Ortho Clinical Diagnostics 2021
Three Strategic Priorities Driving Profitable Growth
1Q21 Strong momentum in the base business, bolstered by innovative
growth opportunities and operational efficiencies
Product Global Commercial Operational
Innovation Excellence Efficiency
Recognized with Edison Award for Competitive customer wins pacing Net Leverage of 4.4x, ahead
COVID-19 solutions for mass-scale ahead of prior year of forecast
testing EMEA commercial excellence is Improved DSO by 10 days to 59
Awarded ~$54M BARDA/DoD grant yielding growth in Western Europe (vs. 1Q 2020)
to expand manufacturing Recognized with Stevie Award 1Q Value Capture on track to
Received FDA approval for ORTHO for Exceptional Customer Service achieve full year target
OptixTM Card Reader completing 5 Years in a Row Began Phase 2 Shared
semi-automated offering Initiated business with CTS Service Centers program
7
HIGHLY CONFIDENTIAL © Ortho Clinical Diagnostics 2021

Clinical Labs Opportunities for Immunoassay Growth Through
Integrated System Upgrades and Placements
                                                                                                                     Global Installed Base

2020 Ortho CL Revenue1                                     2019 Market Data2                                                   EMEA                  China
                                                                                                         Americas               14%                   31%
                                                                                                           32%

                                                                                                                                                   ASPAC/Japan
  Immunoassay                                                                      Clinical                                                           15%
     38%                                                                          Chemistry
                                                                                    33%

                     Clinical
                    Chemistry                                  Immunoassay
                      62%                                         67%

                                                                                                                     Integrated Penetration
        Strength in Clinical                              Opportunity in larger, faster
     Chemistry underpinned by                               growing Immunoassay
     benefits in dry technology                              market with growth in                                                                  24%      25%
                                                           integrated installed base                                                  16%   19%
                                                                                                               6%     11%    12%

                                                                                                       2008   2010    2012   2014   2016    2018   2020      1Q21
1. 2020 Ortho revenue excluding COVID-19 assays
2. Sourced from 2019 IQVIA Market Book to exclude impact of COVID-19
                                                                                                                                                                    8
HIGHLY CONFIDENTIAL © Ortho Clinical Diagnostics 2021
M&A Targets Across High-Growth, High-Fit Adjacencies
MDx, POC/POL & Immunoassay Expansion Top Priorities
Opportunity Map: Centralized Lab & POC1 M&A/Partnership Opportunities to Strengthen TM Leadership
SMG, IQVIA & Allied Market Research
Ortho Platform Provides Strong Foundation for M&A
Targeting products that can be leveraged across global
commercial call points
Seeking additional exposure/entry to high-growth markets
Accelerate Clinical Laboratories growth and strengthen
Transfusion Medicine leadership through MDx opportunities
1. Market sizes represent 2020 estimates per management-provided figures and industry research reports from IQVIA and Allied Market Research
2. Includes coagulation, urinalysis, mass spectrometry, flow cytometry, NGS and cytology, among other products 9
Financial Results
HIGHLY CONFIDENTIAL © Ortho Clinical Diagnostics 2021
1Q21 Revenue Mix
Clinical Labs outperformance drives strong double-digit growth to start FY21 Transfusion
Medicine
32%
Clinical
Labs
Clinical Labs Non-Core
67%
Strong growth across all geographies, 1%
led by the Americas and China
Continued business recovery supplemented
∆
by COVID-19 testing sales $ millions Apr 4, 2021 Mar 29, 2020
∆
in constant
as reported
currency (a)
Transfusion Medicine Clinical Labs $338.0 $256.4 31.8% 29.9%
Solid growth in the Americas, Japan
and ASPAC Transfusion Medicine $161.4 $147.9 9.1% 6.0%
CTS business went live, contributing
Core Revenue $499.3 $404.3 23.5% 21.1%
to revenue in Americas
Other Product $4.3 $0.0 n.m. n.m.
Non-Core
Contract manufacturing business and Collaboration and Other $3.2 $3.6 (15.6%) (15.6%)
contractual collaboration revenue
Non-Core Revenue $7.5 $3.6 106.4% 106.4%
Net Revenue $506.8 $407.9 24.2% 21.8%
Unless otherwise noted, dollars and growth rates are at actual foreign exchange rates
(a) The term “constant currency” means we have translated local currency revenues for all reporting periods into U.S. dollars using the same comparable foreign currency exchange rates. This additional non-GAAP financial information is
not meant to be considered in isolation from or as substitute for financial information prepared in accordance with GAAP. See reconciliation of non-GAAP measures included in Appendix. 11HIGHLY CONFIDENTIAL © Ortho Clinical Diagnostics 2021
1Q21 Segment Results Other
12%
China
11%
EMEA Americas
14% 63%
Commercial Excellence programs
continue to show strong returns
America’s performance driven by pronounced
∆
growth in CL and TM as well as COVID-19 $ millions Apr 4, 2021 Mar 29, 2020
∆
in constant
revenues as reported
currency (a)
EMEA growth, including Western Europe,
driven by resumption of routine activities Americas $321.4 $250.5 28.3% 28.8%
and COVID-19 revenues
China growth underpinned by integrated EMEA $68.5 $58.7 16.8% 8.2%
instrument installations and menu expansion
Other segment revenue driven by recovery
in Japan and Asia Pacific Greater China $55.0 $46.3 18.7% 10.6%
Strong rebound in many emerging markets
including Brazil and India Other $61.9 $52.4 18.2% 15.1%
Total Revenue $506.8 $407.9 24.2% 21.8%
Unless otherwise noted, dollars and growth rates are at actual foreign exchange rates
(a) The term “constant currency” means we have translated local currency revenues for all reporting periods into U.S. dollars using the same comparable foreign currency exchange rates. This additional non-GAAP financial information is
not meant to be considered in isolation from or as substitute for financial information prepared in accordance with GAAP. See reconciliation of non-GAAP measures included in Appendix. 12HIGHLY CONFIDENTIAL © Ortho Clinical Diagnostics 2021
Operating Results Summary
Focused on operational excellence and revenue growth driving margin expansion
Three Months Ended
$ millions
Apr 4, 2021 Mar 29, 2020
Revenue $506.8 $407.9
Core Revenue Growth in Constant Currency(a) 21.1% 0.7%
Gross Margin 51.0% 47.7%
Income from Operations $57.4 $11.9
EPS (GAAP) ($0.19) ($0.69)
Adjusted EPS(b) $0.26 ($0.01)
Adjusted Free Cash Flow(b) ($13.1) ($28.4)
Adjusted EBITDA(b) $152.4 $102.0
Unless otherwise noted, dollars and growth rates are at actual foreign exchange rates
(a) The term “constant currency” means we have translated local currency revenues for all reporting periods into U.S. dollars using the same comparable foreign currency exchange rates.
This additional non-GAAP financial information is not meant to be considered in isolation from or as substitute for financial information prepared in accordance with GAAP.
(b) See reconciliation of non-GAAP measures included in Appendix. 13HIGHLY CONFIDENTIAL © Ortho Clinical Diagnostics 2021
Balance Sheet, Cash Flow & Liquidity
Net IPO proceeds and improved annual Free Cash Flow
have positioned balance sheet to support growth
Target Leverage Reduction
(Net Debt to EBITDA)
$1.4 Billion $153.8 Million
Debt Paydown with
Cash at 4/4/21
Net IPO Proceeds At least 0.5x
Annual
4.5x1
Reduction
235 Million $(13.1) Million 4.0x
1Q 21 Adjusted
Common Shares
Free Cash Flow (a)
Outstanding
4.4x $463.0 Million
Borrowing Capacity Post
Net Debt to LTM
Revolver Expansion on 2/4/21
EBITDA Ratio
2020 2021 2022 2023 2024
(a) Q2 expect to generate in excess of $100 million of Adjusted Free Cash Flow 14HIGHLY CONFIDENTIAL © Ortho Clinical Diagnostics 2021
FY21 Setting Expectations $1.93 – $1.96 Billion
Core Revenue
9% – 11%
Constant Currency Core Revenue Growth
Strategic plan and focus for continued
top-line growth and operating leverage
$520 – $532 Million
Raising all key performance indicators for fiscal 2021 Adjusted EBITDA
Focusing on increasing lifetime customer value
Supporting 1.2 - 2x operating leverage expansion
for Adjusted EBITDA growth in excess of total
14.0% – 16.5%
revenue expansion Adjusted EBITDA Growth (Reported)
Continuing to fund innovation and R&D efforts
to expand future growth opportunities
$0.64 – $0.69
Adjusted Diluted Earnings Per Share
15HIGHLY CONFIDENTIAL © Ortho Clinical Diagnostics 2021
Investment Thesis
Pure-play IVD company in
1 highly attractive, growing market
Clear differentiation that creates lifetime
2 customer value and recurring revenue base
Strong momentum with renewed
3 focus on profitable growth
16Appendix
17HIGHLY CONFIDENTIAL © Ortho Clinical Diagnostics 2021
Adjusted EBITDA Reconciliation
Fiscal First Q uarte r Ende d
April 4, 2021 March 29, 2020
Net revenue $ 506.8 $ 407.9
Cost of revenue, excluding amortization of intangible assets 248.2 213.2
Gross profit 258.6 194.7
Selling, marketing and administrative expenses 131.5 117.4
Research and development expense 28.9 23.6
Amortization of intangible assets 33.4 33.0
Other operating expense, net 7.4 8.8
Income from operations 57.4 11.9
Interest expense, net 43.4 52.2
Tax indemnification income, net (0.2) (2.5)
Other expense, net 50.0 59.3
Loss before provision for income taxes (35.8) (97.1)
Provision for income taxes 3.3 4.1
Net loss $ (39.1) $ (101.2)
Basic and diluted net loss per common share $ (0.19) $ (0.69)
Basic and diluted weighted-average common shares outstanding 206.2 146.3
Unless otherwise noted, dollars are at actual foreign exchange rates. 18HIGHLY CONFIDENTIAL © Ortho Clinical Diagnostics 2021
Adjusted Net Income and Adjusted Diluted EPS Reconciliation
Fiscal First Q uarte r Ende d
(Dollars in millions) April 4, 2021 March 29, 2020
Net loss $ (39.1) $ (101.2)
Intangible amortization 33.4 33.0
Loss on extinguishment of debt 50.5 10.0
Stock-based compensation 3.5 1.6
Restructuring and severance related costs (a) 1.3 2.4
Foreign currency exchange losses (b) - 49.3
Other adjustments (c) 6.9 6.3
Total adjustments 95.6 102.6
Tax effect of reconciling items (d) (2.0) (3.3)
Discrete tax items (e) 0.3 -
Adjusted net income (loss) $ 54.9 $ (1.9)
Adjusted basic EPS $ 0.27 $ (0.01)
Adjusted diluted EPS $ 0.26 $ (0.01)
Unless otherwise noted, dollars are at actual foreign exchange rates. 19HIGHLY CONFIDENTIAL © Ortho Clinical Diagnostics 2021
Notes to Non-GAAP Reconciliations
(a) Represents restructuring and severance costs related to several discrete initiatives intended to strengthen operational performance and to support building our commercial capabilities including a project announced in fiscal year
ended January 3, 2016 to outsource equipment manufacturing operations in Rochester, New York and a project announced in fiscal year ended December 30, 2018 to transfer certain production lines among facilities.
(b) For fiscal quarter ended March 29, 2020, this represents non-cash unrealized gains and losses resulting from the remeasurement of transactions denominated in foreign currencies primarily related to intercompany loans. In fiscal
year 2021, the Company initiated programs to mitigate the impact of foreign currencies related to intercompany loans in our results and, as a result, such non-cash net unrealized losses were approximately $22 million for the fiscal
quarter ended April 4, 2021. Given we expect these programs to continue to mitigate the impact in future periods, we will not be adjusting our Adjusted EBITDA and Adjusted Net Income for non-cash unrealized gains and losses
resulting from the remeasurement of transactions denominated in foreign currencies starting in the first quarter of fiscal 2021.
(c) Represents miscellaneous other adjustments related to unusual items impacting our results including the elimination of management fees, non-cash derivative mark-to-market (gain) loss and certain asset write-downs. See
information below.
Fiscal First Q uarte r Ende d
($ in millions) April 4, 2021 March 29, 2020
EU medical device regulation transition costs $ 0.9 $ 1.1
Principal shareholder management fee 0.8 0.8
Derivative mark-to-market loss 0.6 1.0
Other 4.6 3.4
Total other adjustments $ 6.9 $ 6.3
(d) Non-GAAP adjustments were tax effected based on the nature of the expense and related jurisdiction, many of which are impacted by valuation allowances resulting in little to no tax impact.
(e) We exclude deferred tax resulting from changes in tax law and expiration of statutes, adjustments for uncertain tax positions, and other unusual items not related to current operating results.
Unless otherwise noted, dollars are at actual foreign exchange rates. 20HIGHLY CONFIDENTIAL © Ortho Clinical Diagnostics 2021
Adjusted Free Cash Flow
Fiscal First Q uarte r Ende d
($ in millions) April 4, 2021 March 29, 2020
Net cash used in operating activities - GAAP $ (9.9) $ (17.5)
Adjustments:
Net cash used in investing activities - GAAP (10.7) (18.3)
Unusual or non-recurring payments 7.5 7.4
Adjusted free cash flow (f) $ (13.1) $ (28.4)
(f) The Company defines free cash flow as net cash flow from operations accounted for under GAAP less net cash used in
investing activities accounted for under GAAP plus or minus any unusual or non-recurring payments.
Unless otherwise noted, dollars are at actual foreign exchange rates. 21HIGHLY CONFIDENTIAL © Ortho Clinical Diagnostics 2021
Reported and Constant Currency Revenue Reconciliation
Fiscal first quarte r e nde d
April 4, March 29, Constant Curre ncy
2021 2020 Pe rce nt Change Curre ncy Impact Growth Rate (a)
Core Revenue $ 499.3 $ 404.3 23.5% $ 9.2 21.1%
Non-Core Revenue 7.5 3.6 106.4% - 106.4%
Net Revenue $ 506.8 $ 407.9 24.2% $ 9.2 21.8%
Segment net revenue
Americas $ 321.4 $ 250.5 28.3% $ (0.7) 28.8%
EMEA 68.5 58.7 16.8% 4.8 8.2%
Greater China 55.0 46.3 18.7% 3.7 10.6%
Other 61.9 52.4 18.2% 1.6 15.1%
Net revenue $ 506.8 $ 407.9 24.2% $ 9.2 21.8%
Unless otherwise noted, dollars and growth rates are at actual foreign exchange rates.
(a) The term “constant currency” means we have translated local currency revenues for all reporting periods into U.S. dollars using the same comparable foreign currency exchange rates. This additional non-GAAP financial
information is not meant to be considered in isolation from or as substitute for financial information prepared in accordance with GAAP.
22HIGHLY CONFIDENTIAL © Ortho Clinical Diagnostics 2021
Supplemental Non-GAAP Financial Measures
Fiscal Year Ended Fiscal quarter ended
(% Growth) 2017 2018 Q1 19 Q2 19 Q3 19 Q4 19 Q1 20 Q2 20 Q3 20 Q4 20 Q1 21
Core Revenue
Growth 4.8% 0.3% (3.4%) 1.3% 4.6% 2.5% (0.6%) (12.6%) 1.6% 10.1% 23.5%
Rate
Less: Foreign
(0.1%) 0.5% (2.9%) (2.3%) (0.9%) (0.4%) (1.3%) (2.0%) (0.4%) 1.0% 2.4%
Currency Impact
Core Revenue
Constant Currency 4.8% (0.2%) (0.5%) 3.7% 5.5% 2.9% 0.7% (10.6%) 2.0% 9.1% 21.1%
Growth Rate
Less: Local HCV and
3.5% (1.4%) 2.5% (0.1%) (0.3%) (1.5%) (4.0%) 1.5% (1.6%) (0.6%) 0.2%
Other Adjustments
Core Revenue
Constant Currency
1.4% 1.2% (3.0%) 3.8% 5.8% 4.3% 4.7% (12.1%) 3.6% 9.7% 20.9%
Growth Rate (excl.
local HCV)
Less: CoV-2 0% 0% 0% 0% 0% 0% 0% 6.4% 4.9% 5.8% 7.1%
Core Revenue
Constant Currency
Growth Rate (excl. 1.4% 1.2% (3.0%) 3.8% 5.8% 4.3% 4.7% (18.4%) (1.3%) 3.9% 13.8%
local HCV and CoV-
2)
In Q1 2019 we signed a new supply agreement in Japan related to our HCV business. As a result of the new supply agreement, we recognized increased revenue in Q1 2019 and Q3 2019. Revenue recognition is based on
the timing of periodic shipments which may create unusual YoY variances in certain quarters. Other adjustments include Day 2 countries in 2016 and 2017.
23You can also read