2020 Full Year Results Presentation - TI Fluid Systems plc 16 March 2021

Page created by Alberto Tran
 
CONTINUE READING
2020 Full Year Results Presentation - TI Fluid Systems plc 16 March 2021
2020 Full Year Results Presentation
TI Fluid Systems plc
16 March 2021
2020 Full Year Results Presentation - TI Fluid Systems plc 16 March 2021
Disclaimer
This presentation contains certain forward-looking statements with respect to
the financial condition, results of operations and business of TI Fluid Systems
plc (the “Company”). The words “believe”, “expect”, “anticipate”, “intend”,
“estimate”, “forecast”, “project”, “will”, “may”, “should” and similar expressions
identify forward-looking statements. Others can be identified from the context
in which they are made. By their nature, forward-looking statements involve
risks and uncertainties, and such forward-looking statements are made only
as of the date of this presentation. Accordingly, no assurance can be given
that the forward-looking statements will prove to be accurate and you are
cautioned not to place undue reliance on forward-looking statements due to
the inherent uncertainty therein. Past performance of the Company cannot be
relied on as a guide to future performance. Nothing in this presentation should
be construed as a profit forecast.
The financial information in this presentation does not contain sufficient detail
to allow a full understanding of the results of the Company. For more detailed
information, please see the preliminary results announcement for the year
ended 31 December 2020.

                                                                                     2
2020 Full Year Results Presentation - TI Fluid Systems plc 16 March 2021
Agenda

         1   Key Highlights for 2020 – Bill Kozyra

         2   Financial Performance – Ron Hundzinski

         3   Q&A

                                                      3
2020 Full Year Results Presentation - TI Fluid Systems plc 16 March 2021
Key Investment Propositions

        Experienced                 Demonstrated               Significant growth         Strong revenue         Awarded the London
management team with         Above market growth with     opportunities aligned with      growth, superior     Stock Exchange Green
 proven track record of         leading technologies,     electrification of HEVs and     margins and free         Economy Mark
    strong growth and         strong market positions,    BEVs and TI’s strength in     cash flow generation       recognizing the
 financial performance        global low-cost footprint      thermal management                                 environmental benefit
   and support of ESG        (including China strength)     systems and pressure                               our products provide to
   initiatives, including         and diversification      resistant HEV fuel tanks                             the global automotive
enhanced diversity and                                                                                                 market
         inclusivity

                            Sustainable business model – ‘doing what we said we would do’
                                     and making the world a cleaner place to live
                                                                                                                                         4
2020 Full Year Results Presentation - TI Fluid Systems plc 16 March 2021
Key Highlights – Bill Kozyra

                               5
2020 Full Year Results Presentation - TI Fluid Systems plc 16 March 2021
Key Highlights – 2020 Full Year Results
Solid full year results despite unprecedented market uncertainty and historic light vehicle production decline due to global
COVID-19 pandemic
    Revenue continues to be resilient
       • 0.2% outperformance above global light vehicle production a)
    Flexible cost structure with cost savings and cash preservation measures delivering robust positive margins
       • 6.2% Adj. EBIT margin b)

    Strong and positive Adj. Free Cash Flow
      • €148 million c)
Acted early and quickly to protect our employees and supported healthcare providers at COVID-19 outset
Initiated fixed cost restructuring of manufacturing capacity and fixed cost base – positioning for new volume reality
Awarded the London Stock Exchange Green Economy Mark – helping the world transition to a greener, cleaner place to live
Commitment to diversity and inclusion through the establishment of Diversity Committee and assessment process
Continued to focus on organic strategy for electrification with advanced EV thermal products and systems and HEV fuel tanks
  • Continuing to win thermal products and systems with key customers for global and regional BEVs
  • Launched production of coolant assemblies and sole supply of high technology cabin comfort heat pump on VW ID.3/ ID.4
  • Average CPV wins for BEV increasing with leading representation on key BEVs coming to market
  • Continuing to use our leading technology in pressure resistant fuel tanks to win share at greater rates than overall tank share
                       a) February 2021 IHS Markit
                       b) Adj. EBIT defined as Adj. EBITDA less depreciation, amortisation & impairments of tangible and intangible assets net of depreciation and amortisation arising on purchase price accounting adjustments
                       c) Adj. Free Cash Flow defined as cash generated from operating activities, less cash used by investing activities, cash movements in financial assets at fair value through the profit and loss, cash payments related to IPO costs, net cashflows relating to restructuring and
                       settlement of derivatives                                                                                                                                                                                                                                                           6
                       Presentation subject to rounding
2020 Full Year Results Presentation - TI Fluid Systems plc 16 March 2021
Europe
 Global Light Vehicle Production 2019 - 2020
                                                                            North America                      Asia-Pacific                            Global
                                          (a)
                         Europe

Region

                                                                                                                                                               0.2% above
                                                                                                                                                              auto production

                                                                                                                           (2.5)%
                                                                                                              (11.3)%
2019 –         (b)
                       (20.8)%             (21.0)%                            (20.2)%          (22.2)%
                                                                                                                                                    (16.1)%         (15.9)%

2020 (b)              Vehicle                   TI                            Vehicle            TI           Vehicle        TI                                      TI
                                                                                                                                                    Vehicle
                     Production           Revenue                          Production          Revenue       Production   Revenue                  Production      Revenue
                      (units)                                                 (units)                         (units)                                (units)

           •   Europe revenue (21.0)%       •                          North America revenue (22.2)%     •    Asia Pacific revenue (2.5)%    •   Group revenue 15.9%
               lower (or 0.2% below vehicle                            lower (or 2.0% below vehicle           lower (or +8.8% above              lower (or +0.2% above
               production)                                             production)                            vehicle production)                vehicle production)
           •   Programme ramp downs                             •      Ramp downs of powertrain          •    Positive trend in fuel tanks   •   Business model continuing
               impacts                                                 programmes                             with new business                  to demonstrate resilience
           •   New business and                                 •      Under-indexed on large trucks &
               HEV/ BEV launches                                       SUVs
                      (a) Europe vehicle production units include Africa and the Middle East
                      (b) Revenue at constant currency
                                                                                                                                                                                7
                      Source: February 2021 IHS Markit and company estimates
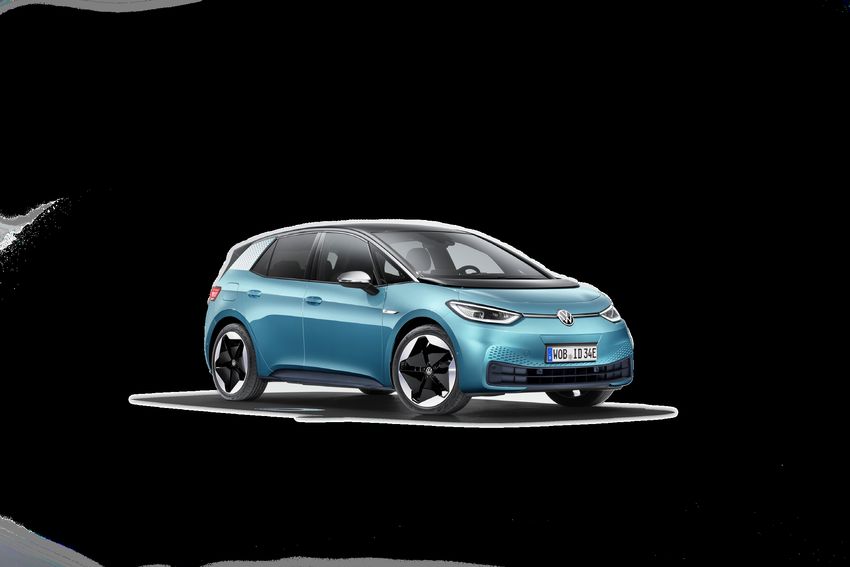
2020 Full Year Results Presentation - TI Fluid Systems plc 16 March 2021
Covid-19 Response
                •   Quick response in early 2020 to fast-changing business conditions to protect our employees and
                    operations as the COVID-19 pandemic spread globally

                      •   Amongst first of global suppliers to mandate remote work and global travel restrictions

                      •   Temporarily closed our plants to protect our workers starting in Asia Pacific and then moving to
                          Europe and North America as the crisis expanded globally

                      •   Implemented enhanced workplace and manufacturing measures such as temperature checks,
                          protective facial coverings, social distancing, improved hygiene procedures and modified work
                          proximities and altered shift patterns

                •   Collaborated with Ford Motor Company and 3M to produce air flex tube assemblies for powered air-
                    purifying respiratory systems (PAPR) for front line health workers

                •   Supported the design, engineering, manufacturing and assembly locally in the USA to allow Ford and
                    3M to rapidly meet demand for much-needed protection for healthcare professionals

                      •   Quick connector production and subassembly - TIFS New Haven, Michigan
                      •   Final tube assembly – TIFS Ashley, Indiana

 Early actions limited the impact of COVID-19 infection across our employees and enabled
              facilities to safely re-open to support OEM customer production
                                                                                                                             8
2020 Full Year Results Presentation - TI Fluid Systems plc 16 March 2021
Our Continued BEV Success
 VW MEB ID.3/ ID.4 BEV                                                 • Production launch of thermal coolant assemblies for thermal fluid
                                                                         management on Volkswagen’s newly introduced ID.3 and ID.4 BEVs

                                                                       • Sole supplier of the BEV cabin comfort CO2 heat pump valve unit assembly –
                                                                         delivering increased operating efficiency and supports extended driving range

                                                                       • Lifetime production volume:        2.9m units a)

                                                                       • Product Technology:                Thermal coolant assemblies, CO2 Cabin
                                                                                                            comfort heat pump valve assembly

                                                                       • Average CPV:                       ~€80 - ~€460

• Continuation of new BEV business across 8 global and regional OEMs and includes all three major vehicle production regions

• These awards further demonstrate our ability to meet the fluid handling and thermal management needs of all propulsion modes including
  electrification

                                   2020 BEV success with 30% of total business wins on BEV platforms
                                                                                                                                                         9
  Source: Company information, a) based on customer planning volumes
2020 Full Year Results Presentation - TI Fluid Systems plc 16 March 2021
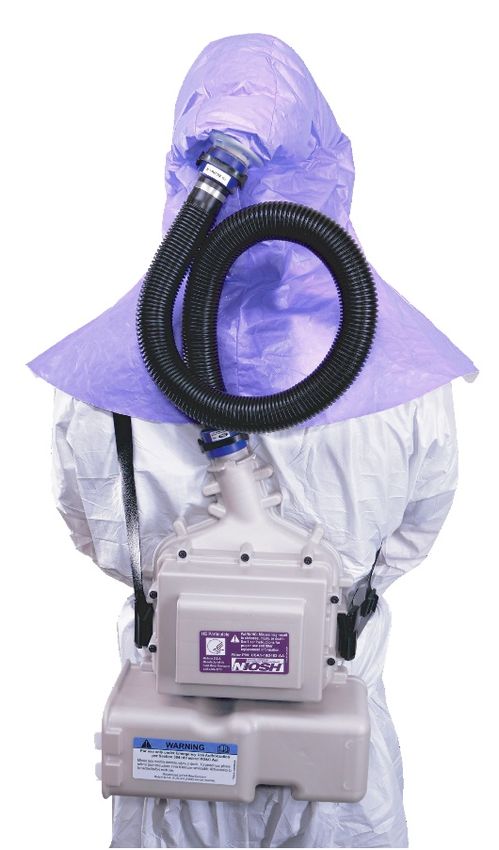
Demonstrating Success: Accretive BEV Award CPVs
                  Meaningful increase in BEV win CPVs – more than 2x ICE average CPVs

                                     ICE                                BEV            +20%

                                                                                       € 480
                                                             € 400            +13.5%

                                       € 288
                                                     € 120                    € 135
                              € 56
                              AVG      MAX           AVG      MAX              AVG     MAX

                                   2020                  2018                     2020
                                 ICE CPV         BEV Business Win CPV     BEV Business Win CPV
                               All Products        Thermal Products         Thermal Products

                                                                                                 10
Source: Company information
Demonstrating Success: BEV Platform Representation
                            Developing a significant leading representation on key BEV launches

Key BEV’s Entering Market                                                                                                  • 46 key BEV platforms have been identified to come to
      2020 - 2022                                                                                                              market in Europe and North America between 2020 and
                                                                                                                               2022
            46
                                                                                                                           • TIFS estimated to have product content on more than two-
                                         31                                                                                    thirds of the 46 BEVs including ~50% with thermal
                                                                                                                               product content -- leading product representation

                                                                                            67%                                                           Product representation
                                                                                                                                                          higher than ICE today!

                                                                                                                  • Validation evidence of TIFS electrification strategy
   Key BEV(a)                      TIFS (b)                                                                           progressing well
  Platforms                      Content

                                                                                                                                                                                                                                 11
Source: a) JP Morgan Europe Equity Research: EV Deep Dive: European Focus 10 July 2020, b) Company information identified as having at least on TIFS product on specific key BEV platforms won and targeted to win (2022 only)
Our Continued HEV Success - Examples
   Thermal Products: Jeep Grand Cherokee PHEV                        • Lifetime production volume:   1.1m units a)

                                                                     • Product Technology:           Reinforced rubber hose,
                                                                                                     aluminum tube, plastic
                                                                                                     tube

                                                                     • Average CPV:                  ~€245

   HEV Fuel Tank Example: Volkswagen Passat                          • Lifetime production volume:   413k units a)

                                                                     • Product Technology:           Pressure resistant LPT
                                                                                                     tanks technology

                                                                     • Average CPV:                  ~€270

                                 2020 HEV success with 17% of total business wins on HEV platforms
                                                                                                                               12
Source: Company information, a) based on customer planning volumes
TI Revenue on EVs

                                                                                              18%

                                                                               10%

                                  HEV
                                  BEV                                           3%             3%

                                                                        2020                  2020
                                                                    Production Mix         Revenue Mix

                                                          TI’s EV revenue outperforms EV production mix
                                                                                                          13
Source: Company information, January 2021 IHS Markit, Note: Revenue excludes aftermarket
New Business Wins on EVs

                                                               47%

                              EV
                                       1%

                                       2017                    2020
                                   Business Wins           Business Wins

                                   47% of 2020 new business wins on EVs
                                                                           14
Source: Company information
London Stock Exchange Green Economy Mark Award

         •   TI Fluid Systems is pleased to be awarded the London Stock Exchange’s Green Economy Mark,
             recognizing the scale of environmental benefit TI Fluid Systems products provide to the global
             automotive market
         •   The Green Economy Mark:
              •   Recognises companies that generate over 50% of revenue from environmentally positive goods,
                  products and services
              •   Is developed and managed by FTSE Russell for its global investor clients
         •   As a leading global manufacturer of highly engineered fluid and thermal management systems, TI Fluid
             Systems enables vehicle manufacturers to sustainably reduce CO2 emissions and improve fuel economy
             across all vehicle types, especially hybrid and battery electric vehicles

     Lightweight nylon fluid lines ● Thermal fluid products & Systems ● Zero emission fuel tanks ●
                                      Pressure resistant fuel tanks

        Helping the world transition to a greener, cleaner and better place to live
                                                                                                                    15
Our Commitment to Diversity and Inclusivity
                 Focusing on Diversity and Inclusivity
                         •   Not withstanding the challenges of COVID-19, TI Fluid Systems made significant
                             progress in our commitment to diversity through inclusion

                         •   Our simple D&I strategy focuses on evaluating and improving top and middle
                             management inclusivity behaviour to create a fertile work environment for current and
                             prospective employees

                               •   By partnering with Canadian firm MESH/Diversity and Dr. Leeno Karumanchery,
                                   TIFS uses the science behind management behaviour to create change
                               •   By the end of 2020, we assessed 1/3 of the Company’s middle and top
                                   management and plan to assess the balance of the team in 2021

                         •   Other D&I initiatives in 2020 included:

                               •   Making diversity and inclusion a topic in all monthly All Employee Meetings
                               •   Establish a US based diversity committee, which will expand globally in 2021

                         •   Looking ahead, we will:

                               •   Expand the initiatives starting in the United States to all regions
                               •   Implement anti-bias training, globally, across our more than 100 locations around
                                   the world
                               •   Continue to evaluate and implement ideas and initiatives raised by our diversity
                                   committee
                                                                                                                       16
Financial Performance – Ronald Hundzinski

                                            17
Revenue Performance
          Continued resilience during significant falls in global vehicle production in 2020

                   Group Revenue (€m)                                                                            Key Comments
                     YoY change -17.5% at reported rates
                                                                                           • Revenue declined by 15.9% at constant currency (or –
                                                                                             17.5% at reported rates)
                                                                                                                                                 (a)

                   3,411                                                                        • Global light vehicle production level of (16.1)%

                                                            2,815                               • Revenue outperformance of + 0.2%

                                                                                           • Asia Pacific revenue continued to outperform regional
                                                                                             vehicle production

                                                                                                • Europe – 38% of the Group’s revenue with programme
                                                                                                  ramp downs offset by HEV/EV launch activity

                   2019                                      2020                               • North America – 26% of the Group’s revenue impacted
                                                                                                  by vehicle mix and powertrain programme ramp downs
 Global Auto Production (YoY)                                - 16.1%
                                                                                                • Asia Pacific – 35% of the Group’s revenue benefiting
                                                                                                  from new business for FTDS in China
                                (a) February 2021 IHS Markit and company estimates
                                Note: Latin America represents 1% of the Group’s revenue
                                                                                                                                                         18
Adj. EBIT and Adj. EBITDA Margin Solid
           Highly flexible cost structure leading to relatively stable margins

                Adj. EBIT (€m)                                                                                                                                           Key Comments
                                                            (b)

        10.0%
                                                                                                                      • Adj. EBIT of €173m or 6.2% margin
        340

                                                                                                                      • Solid margin in light of current global environment:
                                                  6.2%
                                                   173                                                                              • Significant decrease in global vehicle production
                                                                                                                                          volumes due to COVID-19 pandemic

                                                                                                                                    • High operating leverage and flexible cost structure
        2019                                      2020
                                                                                                                                    • Adj. EBITDA of €331m or 11.8% margin
                                                                                                                                                                         (a)

           Adj. EBITDA (€m)
                                                                  (b)

                                                                                                                                    • Stable and strong margins demonstrate strength of
        14.6%
        498                                                                                                                               business model with ability to adjust costs in different
                                                11.8%
                                                                                                                                          volume environments
                                                   331

        2019                                      2020
          a)    Adjusted EBITDA defined as profit or loss before tax for the period before exceptional items, net finance expense, share of profits or losses of associates, foreign exchange gains or losses and depreciation, amortisation & impairments of tangible and
                intangible assets adjusted for net restructuring charges and associate dividends received                                                                                                                                                                    19
          b)    The main adjusting item relates to €16m restructuring where we took action in our operations in Europe and North America
Segment Revenue and Adj. EBIT Margins
                       FCS impacted by market weakness with FTDS performing well

                    FCS Revenue (€m)                                            FTDS Revenue (€m)

                                                                                     1,493
                     1,918
                                                                                                 1,288
                                  1,527

                     2019         2020                                               2019        2020

 Adj. EBIT Margin   10.4%                 6.4%                    Adj. EBIT Margin   9.4%                 5.9%

• Revenue decline of 18.4% at constant currency               • Revenue decline of 12.7% at constant currency
     • At reported rates, YoY change of (20.4)%                    • At reported rates, YoY decline of 13.8%
• Continue to deliver solid Adj. EBIT margin at 6.4%          • Adj. EBIT margin of 5.9%
     • YoY margin reduction largely driven by the impact of        • Decrease in margin due to reduced volumes, despite
       market volume reductions particularly in Europe and           underlying strong operational performance and new
       North America                                                 business launches

                                                                                                                          20
Adj. Net Income, Adj. Basic EPS and Dividend Per Share
                 Adj. Basic EPS of 2.6 € cents with final dividend of 6.74 € cents per share

          Adj. Net Income Reconciliation (€m)                                                                                                                Adj. Net Income (€m)
                                                          2019                          2020

       Profit / (loss) for the period                        145                         (252)                                                               150

       Non Controlling Interests                                (3)                        (2)
       Net FX gains                                             (1)                       (27)
       Exceptional items                                         -                        275
       Other reconciling items                                   9                         20

      Adj. Net Income (a)                                    150                            14
                                                                                                                                                                                                           14

                                   Dividend
                                                                                                                                                            2019                                         2020
•   2020 interim dividend of 6.74 euro cents per share                        (c)

                                                                                                                                      Adj. Basic (b)
•   Represents full year dividend and is in excess of our 30% of Adjusted                                                                                         28.9 euro cents                       2.6 euro cents
                                                                                                                                      EPS
    Net Income dividend policy

•   Payout of €35.0m on 520m shares outstanding
•   Committed to annual dividend policy
                         (a)   Adjusted Net Income defined as Profit or Loss for the period attributable to the ordinary shareholders before exceptional items adjusted to reflect associate dividends received and eliminate the impact of net restructuring
                               charges and foreign exchange gains or losses
                         (b)   Adjusted Basic EPS defined as Adjusted Net Income divided by the weighted average number of shares for the year                                                                                                                  21
                         (c)   Dividend exchange rate of EUR to GBP set at ex-dividend date. Dividend payment date of 19 February 2021
Adj. Free Cash Flow Growth – Solid Business Model
                                                                   Strong Adj. Free Cash Flow generation
                                                                                                                                                                                                                                    (a)
   Adj. EBITDA to Adj. Free Cash Flow Reconciliation (€m)                                                                                                           Adj. Free Cash Flow (€m)

                                                                              2019                        2020

Adj. EBITDA                                                                    498                         331

                                                                                                                                                                          180
Cash Interest                                                                   (62)                        (54)
                                                                                                                                                                                                                           148

Cash Tax                                                                       (80)                         (60)

Working Capital, Provisions and Other                                          (20)                           57

PP&E and Intangibles                                                         (159)                       (112)

Cash Received on Settlement of Derivatives                                        (6)                      (17)

Net restructuring cash                                                             9                            3                                                         2019                                            2020

Adj. Free Cash Flow                                                            180                         148

                      a)   Adj. Free Cash Flow defined as cash generated from operating activities, less cash used by Investing activities, cash movements in financial assets at fair value through the profit and loss, cash payments related to IPO costs, net cashflows relating to
                           restructuring and settlement of derivatives
                                                                                                                                                                                                                                                                                          22
Strong Capital Structure – Continuing to De-lever

                    Capital Structure Evolution
                                                                                                                                                                  Key Comments
€m                                        Interest rate                     2019                 2020
Financial liabilities
                                         US LIBOR+ 3.75%
                                                                                                                         • Capital allocation priority remains on deleveraging
Secured Term Loan                        Euribor + 3.75%
                                                                            1,168                1,102
                                                                                                                              through free cash flow generation in the medium term
Unamortised Fees                                                                (17)                 (25)
Total borrowings                                                            1,151                1,077
                                                                                                                                    • Successful refinancing in September 2020 –
                                 (a)
Cash and cash equivalents                                                     (413)                (487)
                                                                                                                                          maturity dates extended to 2024
Net Debt                                                                       738                  590
                                  (b)
Net Debt / Adj. EBITDA LTM                                                    1.5x                 1.8x                             • Continue to deliver through free cash flow
                                                                                                                                          generation

              Leverage (Net Debt / Adj. EBITDA)
                                                                                 1.8x
           1.5x

         Dec 2019                                                            Dec 2020

                        (a)   Cash and cash equivalents includes financial assets at Fair Value Through Profit or Loss (“FVTPL”)
                        (b)   With IFRS 16 lease liabilities, net debt would be €741 million (2019: €905 million) and leverage 2.2x Adj. EBITDA Last Twelve Months (LTM) as at 31 December 2020 (2019: 1.8x)
                                                                                                                                                                                                               23
Fixed Cost Restructuring Summary
              Consolidation of capacity to remain competitive through production recovery

• Structural changes necessary given the likelihood of a prolonged period of light vehicle production recovery

• Restructuring focus targeted to reduce Fixed Cost by 16.2%

• Workforce reduction:

     • Reduction in workforce of at least ~ 1,000 associates from our global workforce of 25,700

• Cash expenditures and savings of restructuring plan
     • Cash expenditures of ~ €17m 2020 and ~ €30m in 2021, totaling ~ €47m

     • Savings in 2022 of ~ €74m and cumulative savings through 2022 of ~ €94m

• 6 Plant closures and 2 partial closures

     • 4 in Europe | 2 in North America

• Plant equipment and development cost asset impairments recorded

                                                                                                                 24
Capital Structure – Extend and Amend Summary
            Extended and amended existing capital structure – no additional capital raised

                    Term Loans                                        Revolving Facilities
Euro
                                                         Revolving facilities
   • €422m increased by €78m to €500m
   • Extended from 30 June 2022 to 16 December 2024         •   Asset Backed Loan (ABL) $100m extinguished
   • Interest rate increased by 1%:                         •   Revolving Credit Facility increased by $100m to $225m
     • Old: EURIBOR (minimum 0.75% p.a.) +2.75% p.a.        •   Eliminated variable ABL element from prior agreement
     • New: EURIBOR (minimum 0.75% p.a.) +3.75% p.a.        •   Extended from 16 July 2023 to 16 July 2024
                                                            •   Interest payable range on the facility was increased:
US Dollar                                                        • Old: US$ LIBOR +3.0% to US$ LIBOR + 3.5% p.a.
                                                                   (depending on leverage ratios)
                                                                 • New: US$ LIBOR +3.0% to US$ LIBOR + 3.75% p.a.
   • $834.2m decreased by $94.2m to $740m                          (depending on total net leverage ratio)
   • Extended from 30 June 2022 to 16 December 2024
   • Interest rate increased by 1.25%:
     • Old: US$ LIBOR (minimum 0.75% p.a.) +2.5% p.a.
     • New: US$ LIBOR (minimum 0.75% p.a.) +3.75% p.a.

                   Increased revolver flexibility and maturities extended through 2024
                                                                                                                        25
Capital Allocation Priorities
        Capital allocation priorities aligned with TI Fluid Systems’ strategic objectives

                                   Net cash generated from operations

  Capex & Capitalised R&D                       Dividends                         Deleveraging

 Continue to invest ~ 4% - 5% of       Target pay-out ratio of 30% of    Target leverage levels in line with
   revenue to support organic              Adjusted Net Income                 UK/ European peers
              growth

                                          Other Considerations

                                      Continually assess other options
                                       that may benefit shareholders
                                              including M&A

                                                                                                               26
2021 Outlook
           €m                                            2019                           2020                      2021 Outlook

        Revenue                                2.1% above auto production   0.2% above auto production         Outperformance
     Outperformance                               (at constant currency)       (at constant currency)            Continues
            0

     Adj. EBIT Margin                                    10.0%                          6.2%                   High Single Digit

    Adj. Free Cash Flow                                   180                            148
                                                                                                             Conversion Similar
                                                                                                             to pre-2020 levels
                            (a)

                                                       1.5 x LTM                     1.8 x LTM
       Net Leverage
                                                      Adj. EBITDA                   Adj. EBITDA              Continue to De-lever

   Dividend Payout Ratio                         10% of Adj. Net Income
                                                                            Pay-out reflecting strong cash        Target 30%
                                                                                 generation - €35m            of Adj. Net Income

                (a)   Net Debt / Adj. EBITDA
                                                                                                                                    27
Summary
     Experienced management team with proven track record of strong growth and financial performance
     and commitment to support ESG initiatives, including enhanced diversity and inclusivity

     Demonstrated above-market growth with leading technologies, strong market positions, global low-cost
     footprint (including China strength) and diversification

     Significant growth opportunities aligned with electrification of HEVs and BEVs and TI’s strength in
     thermal management systems and pressure resistant HEV fuel tanks

     Strong revenue growth, superior margins and free cash flow generation based on financial discipline and
     stakeholder aligned capital allocation

     Recognized for the environmental benefit our products provide to the global automotive market

                                                                                                               28
Q&A

      29
Appendix

           30
High Level Income Statement
                            Adjustments to EBITDA and EBIT – non-cash and non-operational
                Income Statement Summary                                                                                                         Key Comments
€m                                                           2019                             2020
Revenue                                                      3,411                           2,815                     • Adjustments primarily relate to certain non-cash and non-
Adj. EBIT                                                       340                             173                          operational expenses
Adj. EBIT %                                                      10.0%                             6.2%
PPA                                                              (72)                            (55)                  • Purchase Price Accounting (“PPA”) - depreciation and
D&A                                                             230                             213                          amortisation arising on the fair value uplifts related to the
Adj. EBITDA                                                     498                             331                          Bain Capital and Millennium acquisitions

Adj. EBITDA %                                                    14.6%                           11.7%                 • Exceptional impairment- recognised in H1 2020 and
D&A                                                            (230)                           (213)                         relates to the likelihood of business performance in the
Net FX Gains                                                        1                             27                         medium term given the context of a prolonged period of light
Exceptional impairment                                               -                         (305)                         vehicle production recovery. This impairment had an
Other Reconciling Items
                            (a)
                                                                 (10)                            (16)                        associated deferred tax credit of €30 million
Operating Profit / (Loss)                                       259                            (176)
                                                                                                                       • Net FX gains / losses - primarily FX impact on unhedged
Net finance expense                                              (58)                            (74)
                                                                                                                             2020 US to UK inter-company loans in USD upon unwinding
Tax                                                              (57)                               2
                                                                                                                             hedging program in March 2020
Associate profit / (loss)                                            -                             (4)

Profit / (Loss) for the Period                                  145                            (252)

                            (a)   Other reconciling items include non-exceptional restructuring charges and adjustments for associate income                                                 31
Adj. Effective Tax Rate
                                                                                               Adj. Effective Tax Rate ~ 43%
                                                                                                          (a)
                         Effective Tax Rate Adjustments                                                                                                         Key Comments

€m                                                                                             2019                     2020               • Adjusted effective tax rate - approximately 43%

Profit before Income Tax                                                                         202                        51             • Adjustments to reported profit before tax – relate to
                                                                                                                                             expenses in the UK that are either not deductible or not tax
 UK losses                                                                                         35                       26               effected because of the UK loss position including interest,
                                                                                                                                             financing and operating costs
Adj. Profit before Income Tax                                                                    227                        77

                                                                                                                                           • Adjustments to income tax – relate to changes arising in
Income tax before exceptional items                                                              (57)                     (28)
                                                                                                                                             the year affecting items originally provided for in prior
 Prior year tax provisions / adjustments                                                         (19)                       (6)
                                                                                                                                             periods
Adj. Income Tax before exceptional items                                                         (76)                     (34)

Adj. Effective Tax Rate                                                                         32%                      43%

(a) Amounts in the table do not include the exceptional impairment charge of €304.6 million and exceptional tax benefit of €29.7 million

                                                                                                                                                                                                            32
You can also read