Corporate Presentation - February 2020 - Advancing the Keno Hill Silver District to Production - Alexco Resource ...
←
→
Page content transcription
If your browser does not render page correctly, please read the page content below
NYSE American/TSX: AXU

    Advancing the Keno Hill Silver District
               to Production

Corporate Presentation – February 2020
Cautionary Notes
Forward-Looking Statements
 This presentation contains forward-looking statements within the meaning of the United States Private Securities Litigation Reform Act of 1995 and forward-looking
 information within the meaning of applicable Canadian securities laws (together, “forward-looking statements”) concerning Alexco's business, including but not limited to
 statements with respect to results of the independent pre-feasibility study on Alexco’s Keno Hill Silver Project in Yukon, Canada (the “PFS” or the “2019 PFS”); future mineral
 exploration including the estimation of mineral reserves and mineral resources and the realization of mineral reserve and mineral resource estimates; future mine
 construction and development activities; future mine operation and production; the timing of activities and reports; the amount of estimated development and operational
 expenses; projected operational and economic metrics; the success of exploration and development activities; the potential upside and growth in respect of certain deposits
 comprising the Keno Hill Silver Project; anticipated permitting time lines; anticipated installation of certain infrastructure; projected equipment and production capacity; and
 potential capital, revenue and sources and uses of funds. Forward-looking statements are subject to a variety of known and unknown risks, uncertainties and other factors
 which could cause actual events or results to differ from those expressed or implied by the forward-looking statements. Such factors include, among others, risks related to
 actual results and timing of exploration and development activities; actual results and timing of mining activities; actual results and timing of environmental services
 activities; actual results and timing of remediation and reclamation activities; conclusions of economic evaluations; changes in project parameters as plans continue to be
 refined; future prices of silver, gold, lead, zinc and other commodities; possible variations in mineable resources, grade or recovery rates; failure of plant, equipment or
 processes to operate as anticipated; accidents, labour disputes and other risks of the mining industry; First Nation rights and title; continued capitalization and commercial
 viability; global economic conditions; competition; and delays in obtaining governmental approvals or financing or in the completion of development activities. Forward-
 looking statements are based on certain assumptions that management believes are reasonable at the time they are made. In making the forward-looking statements
 included in this presentation, Alexco has applied several material assumptions, including, but not limited to, the assumption that Alexco will be able to raise additional capital
 as necessary, that the assumptions, projections and estimates in the PFS will proceed as planned, and that market fundamentals will result in sustained silver, gold, lead and
 zinc demand and prices. There can be no assurance that forward-looking statements will prove to be accurate and actual results and future events could differ materially
 from those anticipated in such statements. Alexco expressly disclaims any intention or obligation to update or revise any forward-looking statements whether as a result of
 new information, future events or otherwise, except as otherwise required by applicable securities legislation. Alexco does not intend, and does not assume any obligation,
 to update these forward-looking statements, except as required by applicable law. To the extent that such information may constitute a financial outlook within the meaning
 of applicable securities laws, such information has been approved by management and is provided for the purposes of providing information relating to management and
 Alexco's current expectations and plans. Readers are cautioned that any such financial outlook information contained herein should not be used for purposes other than for
 which it is disclosed herein.

 The PFS was compiled by Mining Plus with contributions from a team of Qualified Persons as defined by National Instrument 43-101 – Standards of Disclosure for Mineral
 Projects (“NI 43-101”) as follows: Zach Allwright, P.Eng. of Mining Plus, Adrian Churcher, P.Eng. of Mining Plus, Hassan Ghaffari, P.Eng of TetraTech, Paul Hughes, PhD, P.Eng.
 of Mining Plus, Gilles Arseneau, Ph.D., P.Geo. of SRK Canada Inc., Cliff Revering, P. Eng. of SRK Canada Inc. All mineral resources in the PFS are classified following the CIM
 Definition Standards for Mineral Resources and Mineral Reserves (May 2014), in accordance with the CIM Estimation of Mineral Resources and Mineral Reserves Best
 Practice Guidelines and NI 43-101.

 The disclosure in this presentation of scientific and technical information regarding exploration has been prepared by or under the supervision of Alan McOnie, FAusIMM,
 Alexco’s Vice President, Exploration, while that regarding mine development and operations has been prepared by or under the supervision of Neil Chambers, P.Eng., Mine
 Superintendent, each of whom is a Qualified Person as defined by NI 43-101 and has approved the disclosure herein. The technical information in this document was
 reviewed by Zach Allwright, P.Eng. and Adrian Churcher,P.Eng. both of Mining Plus, Gilles Arseneau, Ph.D., P.Geo. and Cliff Revering, Ph.D., P. Geo both of SRK Canada Inc.
 and Hassan Ghaffarhi, P.Eng of Tetra Tech, each of whom is a Qualified Person and has approved the disclosure herein.

                                                                                                                                                                                      2
Cautionary Notes
Technical Disclosure Cautionary Statement

The material scientific and technical information in respect of Alexco’s Keno Hill Silver District Project in this presentation, unless otherwise indicated, is based upon
information contained in the technical report dated February 14, 2020 entitled “NI 43-101 Technical Report Prefeasibility Study of the Keno Hill Silver District Project, Yukon
Territory, Canada” (the “PFS”). Readers are encouraged to read the PFS, which is available under the Company's profile on SEDAR, for detailed information concerning the
Keno Hill Silver District. All disclosure contained in this presentation regarding the mineral reserves and mineral resource estimates and economic analysis on the property is
fully qualified by the full disclosure contained in the PFS.

A production decision which is made without a feasibility study of mineral reserves demonstrating economic and technical viability carries additional potential risks which
include, but are not limited to, the risk that additional detailed work may be necessary with respect to mine design and mining schedules, metallurgical flow sheets and
process plant designs, and the noted inherent risks pertaining to the inclusion of approximately 2% inferred mineral resources in the mine plan.

This presentation has been prepared in accordance with the requirements of the securities laws in effect in Canada, which differ from the requirements of United States
securities laws. The terms “mineral reserve”, “proven mineral reserve” and “probable mineral reserve” are Canadian mining terms as defined in accordance with NI 43-101
and the Canadian Institute of Mining, Metallurgy and Petroleum (the “CIM”) - CIM Definition Standards for Mineral Resources and Mineral Reserves, adopted by the CIM
Council, as amended. These definitions differ materially from the definitions in SEC Industry Guide 7 (“SEC Industry Guide 7”) under the United States Securities Act of 1933,
as amended. Under SEC Industry Guide 7 standards, a “final” or “bankable” feasibility study is required to report reserves, the three-year historical average price is used in
any reserve or cash flow analysis to designate reserves, and the primary environmental analysis or report must be filed with the appropriate governmental authority. In
addition, the terms “mineral resource”, “measured mineral resource”, “indicated mineral resource” and “inferred mineral resource” are defined in and required to be
disclosed by NI 43-101; however, these terms are not defined terms under SEC Industry Guide 7 and are normally not permitted to be used in reports and registration
statements filed with the SEC. Investors are cautioned not to assume that all or any part of a mineral deposit in these categories will ever be converted into SEC Industry
Guide 7 reserves. Under Canadian rules, inferred mineral resources can only be used in economic studies as provided under NI 43-101. Investors are cautioned not to assume
that all or any part of an inferred mineral resource exists or is economically or legally mineable. An “inferred mineral resource” is that part of a mineral resource for which
quantity and grade or quality are estimated on the basis or limited geological evidence and sampling. Geological evidence is sufficient to imply but not verify geological and
grade or quality continuity. And inferred mineral resource has a lower level of confidence than that applying to an indicated mineral resource and must not be converted to
a mineral reserve. It is reasonably expected that the majority of inferred mineral resources could be upgraded to indicated mineral resources with continued exploration.
Disclosure of “contained ounces” in a resource is permitted disclosure under Canadian regulations; however, the SEC normally only permits issuers to report mineralization
that does not constitute “reserves” by SEC Industry Guide 7 standards as in place tonnage and grade without reference to unit measures. Accordingly, information contained
in this presentation regarding descriptions of the Corporation’s mineral deposits may not be comparable to similar information made public by U.S. companies subject to the
reporting and disclosure requirements under the United States federal securities laws and the rules and regulations thereunder, including SEC Industry Guide 7.

                                                                                                                                                                             3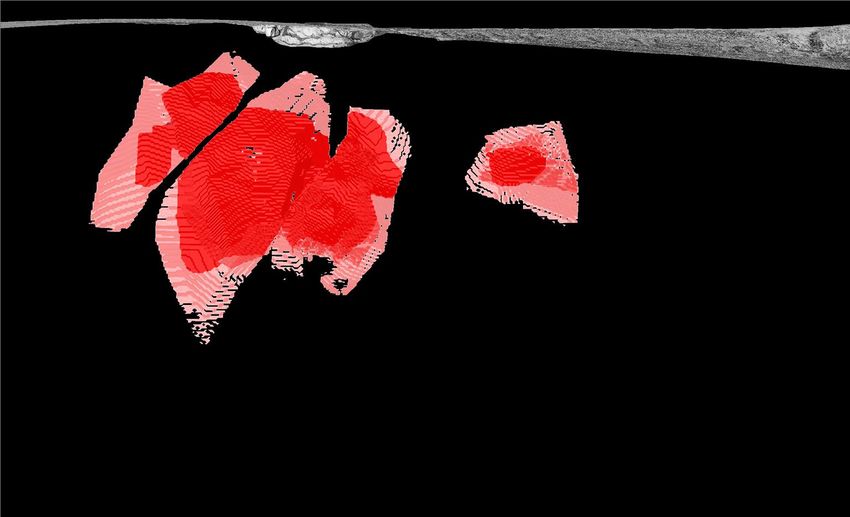
A Pure Play Silver … With Leverage

  • A uniquely positioned high grade primary silver asset in a safe
    jurisdiction
  • A de-risked, low capital, high return, scaleable project on
    track for near–term production

  • A record of sustained exploration success

  • AXU, demonstrated high beta to silver price

             On track to become Canada’s only
              Primary Silver Producer in 2020
                                                                      4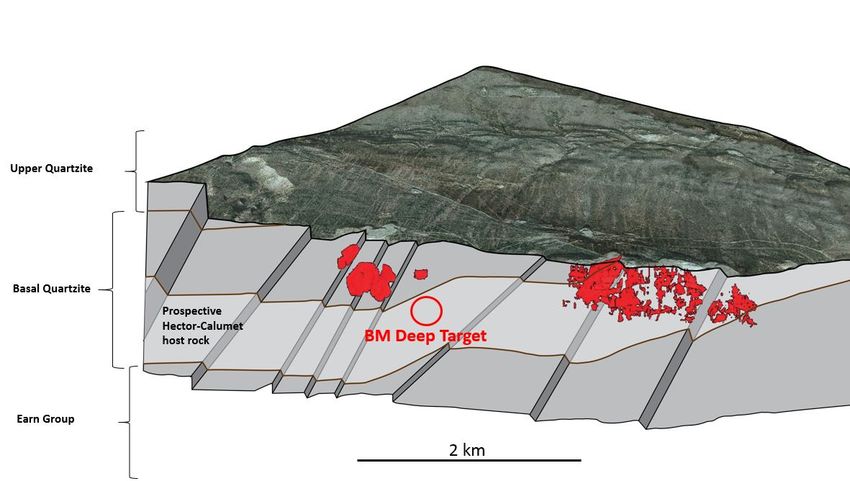
2019 Review

 Achievements
 • Filed Keno Hill Pre-feasibility Study (“PFS”) in May 2019
 • Completed surface infrastructure de-risking projects at Bermingham
 • Advanced Bermingham permitting to final stage (QML granted Q4 2019, WUL
   expected Q1 2020)
 • Completed 11,333 m surface exploration (8,333 m diamond drilling, 3,000 m RAB
   drilling)
 • High-grade intercepts at Bermingham Deep target
 • Discovered new Inca Vein
 • ERDC completed environmental assessment process for Keno Closure Plan - Final
   Evaluation Report from YESAB expected early 2020
 • Maintained excellent safety and environmental performance – No LTA in 6 years

                                                                                   5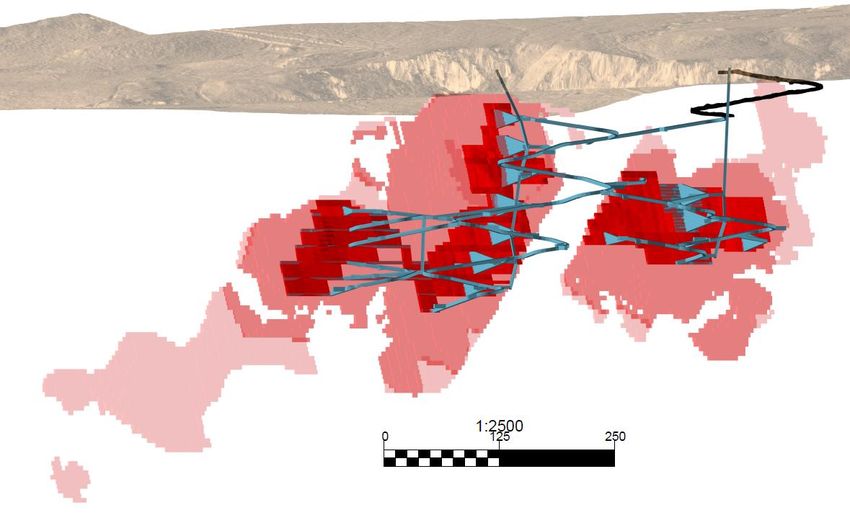
Keno Hill Silver District
                                  District’s historic
                                  production grade:                              2019 PFS Mine Plan – Probable Mineral Reserves
                                     ~44 oz/t Ag                                   • 1.18 Mt @ ~805 g/t Ag

            Keno Hill
                                                                                                                                   ✓ Cut and fill and
        YUKON                                                                                                                        longhole
                                                                                                                                     underground
       YUKON                                                                                                                         operations

                                                                                                                                   ✓ Year-round
                                                                                                                                     access
                                                                                                                                     roads/airport,
                                                                                                                                     grid power

                                                                                    KENO DISTRICT MILL
                                                                                                                                   ✓ 400 tpd modern
                                                                                                                                     mill. Premium
                                                                                                                                     Pb/Ag, Zn
                                                                                                                                     concentrate
        Underground Mineral Resource Estimates                                                                                     ✓ Deep water port
        • +74 Moz Ag Indicated (3.88 Mt @ 594 g/t Ag) – including 30.5 Moz Probable                                                  accessibility
         Mineral Reserves (1.18 Mt @ 805 g/t Ag)
        • +24 Moz Ag Inferred (1.66 Mt @ 455 g/t Ag)
See slide 2 for PFS cautionary statement.
                                                                                                                                                  6
See Appendix I for a full view of the Mineral Reserve and Resources Summary Table associated with the Keno Hill Silver District.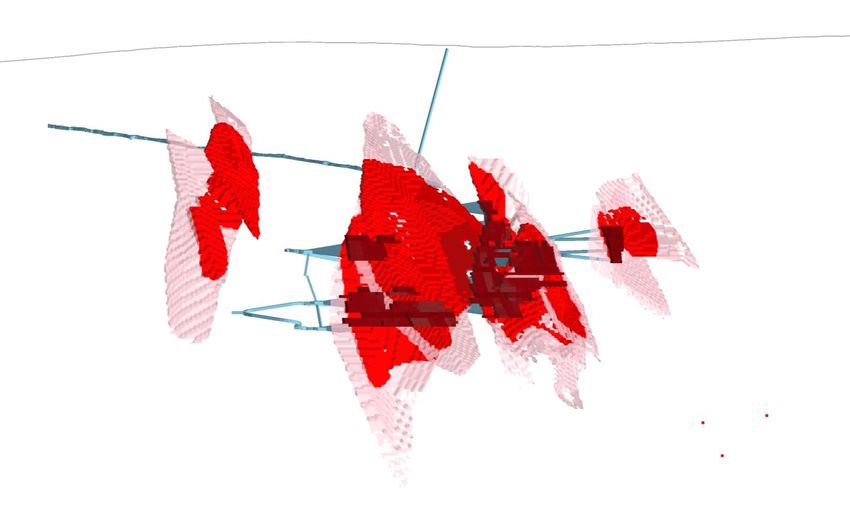
Keno Hill Silver District – Ready to Go
   PFS LOM Tonnes and Grade by Deposit
                                                                     PROBABLE MINERAL RESERVE

                                                                          1,177,379 Tonnes
                                                                    805 g/t Ag, 2.98% Pb, 4.13% Zn
                                                                          (1,133 g/t AgEq*)
        YUKON

         FLAME & MOTH                                     BERMINGHAM                                       LUCKY QUEEN             BELLEKENO
                TONNES                                         TONNES                                          TONNES               TONNES
                704,211                                        362,343                                          70,717               40,109
             GRADE                                            GRADE                                           GRADE                 GRADE
            672 g/t Ag                                       972 g/t Ag                                    1,244 g/t Ag            843 g/t Ag

            •      +1,000 m underground development completed
            •      Capex:
                     • Pre-production $17.9 M
                     • Working capital $5.3 M
            •      After-tax IRR 74%
Calculated at the following prices: Ag US$ 17.65/oz, Au US$ 1,322.55/oz, Pb US$ 1.00/lb, Zn US$ 1.25/lb.
See slide 2 for PFS cautionary statement.                                                                                                       7
See Appendix I for a full view of the Mineral Reserve and Resources Summary Table associated with the Keno Hill Silver District.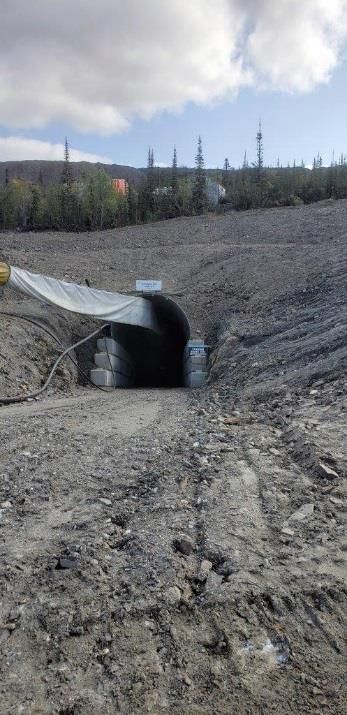
Keno Hill Silver District
   PFS Silver Production

         Ozs
        Millions                         Annualized Production* - Ag Contained in Concentrate
            6

                                                                                           5.0
            5
       YUKON                                                         4.5
                                                                                                                4.3
                                               4.1
            4            3.7                                                                                                          3.5       3.4
            3

            2

            1                                                                                                                                            0.7

           -
                       Year
                        20201                 Year
                                              20212                 Year
                                                                    20223                 Year
                                                                                          20234                 Year 5
                                                                                                                2024                 Year
                                                                                                                                     20256      Year 7
                                                                                                                                                2026     Year
                                                                                                                                                         20278
                                                                                                                                                         (5 months)

                Average Silver production years 1 to 7 = 4 M oz Ag/year
*Production figures from PFS have been re-cast to reflect annualized production once development (approximately 6 months) has been completed.
See slide 2 for PFS cautionary statement.
                                                                                                                                                                      8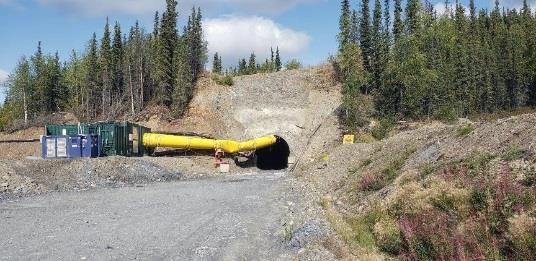
PFS Production Profile
      A Primary Silver Producer by any Measure

                                                         Annualized PFS Payable Metals - By Year
                    Ag Ozs                                                                                                                Pb and Zn lbs
                                                            Payable Pb lbs       Payable Zn lbs     Total Payable Ag Ozs

                    5,000,000                                                                                                             16,000,000
                    4,500,000                                                                                                             14,000,000
                    4,000,000
                                                                                                                                          12,000,000
                    3,500,000

                                                                                                                                                          Pb and Zn lbs
                    3,000,000                                                                                                             10,000,000
           Ag Ozs

                    2,500,000                                                                                                             8,000,000
                    2,000,000                                                                                                             6,000,000
                    1,500,000
                                                                                                                                          4,000,000
                    1,000,000
                     500,000                                                                                                              2,000,000

                             -                                                                                                            -
                                      Year
                                       20201    Year
                                                 20212         2022
                                                              Year 3          20234
                                                                             Year           2024
                                                                                           Year 5      20256
                                                                                                       Year           Year
                                                                                                                       20267      2027
                                                                                                                                 Year 8

 Revenue               Ag               70%       78%            75%           77%            74%        77%               75%      60%

contribution           Pb               18%       11%            12%           10%            11%         9%               8%        9%

 by metal              Zn               12%       10%            12%           12%            13%        12%               15%      28%

                                                              •              Payable Ag = 27.2 M oz
                                                    Total LOM •              Payable Pb = 65.4 M lbs
                                                              •              Payable Zn = 67.2 M lbs
    See slide 2 for PFS cautionary statement.                                                                                                    9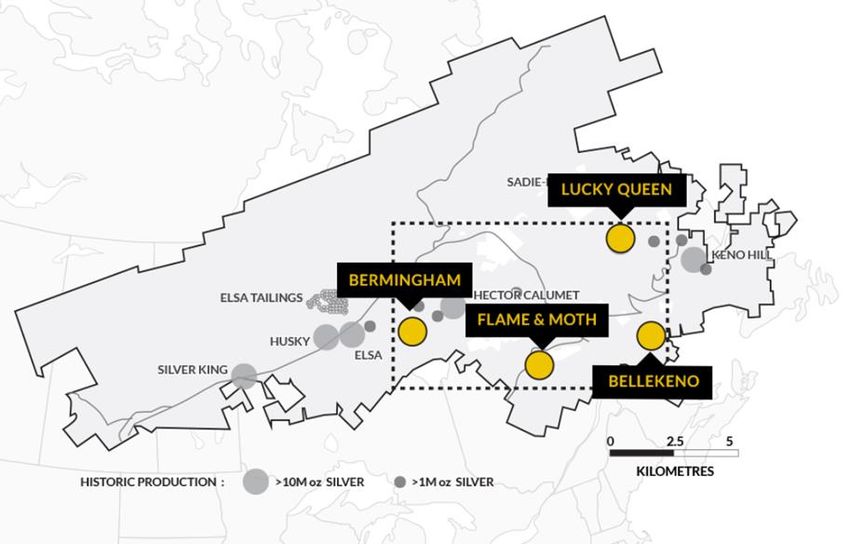
Keno Hill Average AISC – LOM
Using PFS Metal Prices1 and US$/CDN$ FX

                          AISC2 per Produced (Contained) Oz - PFS Prices and FX
    Cash Cost US$/oz Ag
        $14.00

        $12.00
                                                                                                                                                  $0.86

        $10.00
                                                                                                                               $3.60
                                                      $2.42
          $8.00                                                                                                                                           US$11.94
                                                                             ($4.92)

          $6.00                                                                                        $2.40

          $4.00              $7.58

          $2.00

             $-
                      Direct Operating               TCRCs            By-Product Credit           WPM Stream             Site G&A and Corporate G&A and
                            Costs                                                                                      Sustaining Capital Exploration

1Calculated using the following PFS Average Prices: Ag US$ 17.91/oz, Au US$ 1,325/oz, Pb US$ 1.00/lb, Zn US$ 1.22/lb. and US$/CDN$ FX of $0.76.
2AISC is a non-GAAP measure calculated on a produced (contained) basis net of by-products, as defined by the World Gold Council.
See slide 2 for PFS cautionary statement.

                                                                                                                                                               10
March 2019 PFS Flame & Moth LOM Plan
Oblique Longitudinal Section, Looking NW
Mill
Primary Ramp
402 m completed in 2018
Probable Mineral Reserve
Indicated Mineral Resource
Inferred Mineral Resource
Category Tonnes Ag (g/t) Au (g/t) Pb (%) Zn (%) Contained Ag (Oz)
Probable Mineral Reserve 704,211 672 0.5 2.7 5.7 15,213,490
Indicated Mineral Resource* 1,679,000 498 0.4 1.9 5.3 26,883,000
Inferred Mineral Resource 365,200 356 0.3 0.5 4.3 4,180,000
* Indicated Mineral Resource is inclusive of Probable Mineral Reserve.
See slide 2 for PFS cautionary statement. 11
See Appendix I for a full view of the Mineral Reserve and Mineral Resources Summary Table associated with the Keno Hill Silver District.March 2019 PFS Bermingham LOM Plan
Oblique Longitudinal Section, Looking N
Primary Ramp
550 m completed in 2018
Probable Mineral Reserve
BM Deep Target Area
Indicated Mineral Resource
Inferred Mineral Resource
Category Tonnes Ag (g/t) Au (g/t) Pb (%) Zn (%) Contained Ag (Oz)
Probable Mineral Reserve 362,343 972 0.1 2.6 1.3 11,323,635
Indicated Mineral Resource* 1,102,290 930 0.1 2.4 1.7 32,959,000
Inferred Mineral Resource 509,360 717 0.2 1.7 1.5 11,743,000
* Indicated Mineral Resource is inclusive of Probable Mineral Reserve.
See slide 2 for PFS cautionary statement. 12
See Appendix I for a full view of the Mineral Reserve and Mineral Resources Summary Table associated with the Keno Hill Silver District.Scaleability Remaining Indicated Mineral Resource by Deposit following extraction of Probable Mineral Reserves Bermingham Tonnes Ag (g/t) Ag (Oz/t) Contained Ag (Moz) Indicated Mineral Resource 738,000 835 26.8 19.8 Flame & Moth Tonnes Ag (g/t) Ag (Oz/t) Contained Ag (Moz) Indicated Mineral Resource 320,340 440 14.1 4.5 Lucky Queen Tonnes Ag (g/t) Ag (Oz/t) Contained Ag (Moz) Indicated Mineral Resource 60,423 867 27.9 1.7 Remaining mineral resources at CDN$ 400/tonne dollar-equivalent cut-off Lucky Queen, Onek and Flame & Moth Mineral Resources are reported at a value per tonne cut-off of CDN$400/t using the following metal prices and recoveries; Ag US$20.00/oz, recovery 96%; Pb US$0.95/lb, recovery 97%; Zn US$1.00/lb, recovery 88%; Au US$1,300/oz, recovery 72%. Foreign exchange rate of 0.8 US$/CDN$. Bermingham Mineral Resources are reported at a value per tonne cut-off of CDN$400/t using the following metal prices and recoveries; Ag US$20.80/oz, recovery 96%; Pb US$1.05/lb, recovery 97%; Zn US$1.20/lb, recovery 88%; Au US$1,450/oz, recovery 72%. Foreign exchange rate of 0.8 US$/CDN$. Mineral Resources that are not Mineral Reserves do not have demonstrated economic viability. Numbers rounded. 13
Processing and Metallurgy
Premium Lead Concentrate
                                                            Average LOM Mill Recoveries (Payable Metals)
                                                            % Into Pb-Ag concentrate
                                                            Ag                      91.0
                                                            Pb                      88.6
                                                            Au                      49.0
                                                            % Into Zn concentrate
                                                            Ag                      4.6
                                                            Zn                      73.6
                                              Flame and
                                              Moth Portal
                                                            Concentrate Production*
                                                            Pb-Ag concentrate
                                                            Dry Tonnes          52,772
                                                            Ag g/t              15,890
                                                            Pb%                 54.0
                                                            Zn-Ag concentrate
                                                            Dry Tonnes          65,436
                                                            Ag g/t              649
                                                            Zn%                 53.0

* Based on projected commercial production.
See slide 2 for PFS cautionary statement.                                                        14
PFS Project Execution Schedule
2019 2020
Tasks Q3 Q4 Q1 Q2 Q3 Q4
Phase 1
Surface De-risking Projects
Detailed Planning, Operational Readiness
Quartz Mining License Amendment
Water License Renewal
Phase 2
Surface/Mill Upgrades
Bellekeno Development/Production
Flame and Moth Development/Production
Bermingham Development/Production
Mill Commissioning/Ramp Up
Silver Production
Short Runway to Production, Low Capital Costs
See slide 2 for PFS cautionary statement. 15Keno Hill Exploration
District-Wide Indicated Silver Mineral Resource Growth
Indicated Ag Resource
Indicated
(Moz)Mineral Resource Estimate (M oz)
(underground
Underground + surface drilling)
+ Surface
90
2008-2018
80 • Average discovery cost less than $0.55/oz Ag
70
60
50
40
30
20
10
0
2009 2010 2011 2012 2013 2014/15 2016 2017/18
See slide 2 for PFS cautionary statement.
See Appendix I for a full view of the Mineral Reserve and Mineral Resources Summary Table associated with the Keno Hill Silver District.
162019 Exploration Success
Inca Vein – Longitudinal Section, looking NW
2019 intercepts
2018 intercepts
Topography 2009 intercepts
2020: 1,550 m wide spaced drilling
to confirm possibility of
generating >10Moz Ag
K-19-0756
K-19-0749 597 g/t Ag, 5.2% Pb,
832 g/t Ag, 0.7% Pb, 10.7% Zn over 5.5 m
6.0% Zn over 7.44 m true thickness
D09EE-07 true thickness
581 g/t Ag, 3.5% Pb,
15.5% Zn over 3.44 m
true thickness K-19-0749 150.7m
See news release dated December 4, 2019 entitled “Alexco Discovers New Zone of Silver Mineralization, 3.7 Kilometers Northeast of Bermingham Deposit, Composite Assays to 832 Grams Per 17
Tonne Silver over 7.4 Meters True Width”Bermingham Deposit Exploration
(Oblique Longitudinal Section, looking NW)
Etta Zone Arctic Zone Bear Zone Northeast Zone
Surface
Indicated Mineral Resource
1.10Mt @ 930g/t Ag Exploration target area
1,331 g/t Ag over
4.13 m true width
1,414 g/t Ag over
Inferred Mineral Resource 8.15 m true width
0.51Mt at 717g/t Ag
2,514 g/t Ag over
0.93 m true width
Bermingham 2019 program:
• 5,140 meters completed
• 9 completed drill holes 2020 planned vein intercept
2019 vein intercept
500 m
2018 deep vein intercept
See slide 2 for PFS cautionary statement.
See news release dated September 8, 2019 entitled “Alexco Intersects 8.1 Meters (true width) at Composite Grade of 1,414 Grams Per Tonne (45.5 oz/t) Silver at “Bermingham Deep” Target”.
See Appendix I for a full view of the Mineral Reserve and Resources Summary Table associated with the Keno Hill Silver District.Keno Hill Silver District – 2020 Exploration
Bermingham
Indicated Mineral Resource 33 Moz Ag Hector-Calumet
Produced 96 Moz Ag
• Complete ~11,500 meters (“m”), $3.5M drilling program
• ~3,250 m diamond drilling to target Bermingham Deep
• ~1,550 m diamond drilling to follow on 2019 success at Inca
• ~3,200 m diamond drilling for generative exploration in the District
• Airborne survey across remaining prospective ground in the District
• ~3,500 m RAB generative drilling at multiple targets in the District 19Sale of Alexco Environmental Group (“AEG”)
Transaction Highlights
• On February 14, 2020 Alexco strategically sold AEG to AEG Management with the
exception of Elsa Reclamation and Development Company (“ERDC”)
• Alexco retains ownership of “ERDC” and thus:
• Retains contract with Government of Canada for clean up of historical liabilities
at Keno Hill
• This represents +$100M in contractual backlog
• AEG Management paid total consideration of $13.35 M in cash to Alexco as follows:
• $12.1 M paid on closing
• $1.25 M promissory note to be paid on February 14, 2021 (1 year)
• Divestiture allows Alexco to focus exclusively on mining business
See Alexco’s news released dated February 18, 2020 entitled “Alexco Divests Environmental Business AEG”.
20Leverage
AXU High Beta to Silver Prices
Silver Explorers/Developers
2
1.8
1.6
1.4
1.2
1
0.8
0.6
0.4
0.2
0
MAG SIL BCM AXU
Ag as % of Revenue per most recent Technical Report
57.9 51.9 49.7 76.4 1
Ag Production Grade (g/t) per most recent Technical Report
282.0 411.0 50.03 804.5 1
1. Data for Silver Explorers/Developers group based on results of most recent technical report available for each company. Data for Alexco based on February 13, 2020 PFS (See page 2 for cautionary
language). Data for Silver Explorers/Developers group based on publicly available actual production results for each company as at January 15, 2020.
Beta to Silver calculated for the past 12 months as at January 15, 2020. Silver as a percentage of revenue and silver production grade based on most recently available public disclosure documents as
at January 15, 2020. Market data used in this presentation may be based on independent reports by market research firms, or other published independent sources. Some data is also based on
Alexco’s good faith estimates that are derived from its review of internal data and information. Although Alexco believes these sources are reliable, Alexco has not independently reviewed the
information and cannot guarantee its accuracy or completeness. 21Financial Position & Share Structure
TRADING SUMMARY NYSE American TSX TOP SHAREHOLDERS
(as at February 12, 2020)
90-day Av. Daily Vol 1,316,751 276,667 Merian Global Investors 3.0%
52-week range US$0.94 – $2.81 CDN$1.26 – $3.73 Private Investor 3.0%
Market Cap US$207 M CDN$273 M Wheaton Precious Metals 2.5%
SSI Wealth Management 1.9%
US$/Sh US Jan 1, 2019 to Date Volume
$3.00 6,100,000 Mirae Asset Global Investments 1.8%
$2.50 5,100,000
Insiders 5.1%
$2.00 4,100,000
$1.50 3,100,000
$1.00 2,100,000 CAPITAL STRUCTURE (as at Feb 12 2019)
$0.50 1,100,000
Issued & Outstanding 119.9 M
$- 100,000
Fully Diluted 131 M
FINANCIAL POSITION (1) (as at September 30, 2019)
ANALYST COVERAGE
Unrestricted Cash $10.6 M
Canaccord Genuity Kevin MacKenzie
Restricted Cash $2.8 M
Cantor Fitzgerald Mike Kozak
Working Capital $13.9 M
Cormark Securities Tyron Breytenbach
CREDIT FACILITY Roth Capital Partners Jake Sekelsky
US$15 M Indicative Term Sheet Available Scarsdale Equities Mike Niehueser
22
(1) See Alexco’s latest financial statements at https://www.alexcoresource.com/investors/financial-statements/Why Invest in Alexco
Significant Upside in a Rising Silver Environment
• Pure Silver play with +70% revenue from Silver
• Leverage – highest beta to Silver
• A de-risked, low capital and scaleable project with a
short runway to production
• Lots of exploration upside in historic mining district
• Favourable mining jurisdiction
On track to become Canada’s only
Primary Silver Producer in 2020
23Appendix I
Summary of Underground Mineral Reserves & Resources
MINERAL RESERVES
Contained Metal Contained Metal Contained Metal Contained Metal
Deposit3 Category Tonnes Ag (g/t) Pb (%) Zn (%) Au (g/t)
(000 oz Ag) (000 oz Au) (M Ibs Pb) (M Ibs Zn)
Bellekeno Proven - - - - -
Probable 40,109 843.1 11.79 6.31 - 1,087 - 10 6
Lucky Queen Proven - - - - - - - -
Probable 70,717 1,244.39 2.63 1.38 0.12 2,829 - 4 2
Flame and Moth Proven - - - - - - - -
Probable 704,211 671.95 2.71 5.73 0.49 15,214 11 42 89
Bermingham Proven - - - - - - - -
Probable 362,343 972.02 2.59 1.32 0.13 11,324 2 21 11
Total Proven - - - - - - - -
Probable 1,177,380 804.51 2.98 4.13 0.34 30,454 13 77 107
1. All mineral reserves for this table have the effective date of March 28, 2019 and are classified following the CIM Definition Standards for Mineral Resources and Mineral Reserves (May 2014), in accordance with the CIM Estimation of Mineral Resources and Mineral
Reserves Best Practice Guidelines and the guidelines of NI 43-101.
2. All numbers have been rounded to reflect the relative accuracy of the estimates.
3. The Bellekeno, Lucky Queen, Flame & Moth and Bermingham deposits are incorporated into the current mine plan supported by disclosure in the news release dated March 28, 2019 entitled “Alexco Announces Positive Pre-Feasibility Study for Expanded Silver
Production at Keno Hill Silver District” and the technical report filed on SEDAR dated February 13, 2020 with an effective date of March 28, 2019.
4. The disclosure regarding the summary of probable mineral reserves for Alexco’s mineral properties within the Keno Hill District has been reviewed and approved by Neil Chambers, P.Eng., Mine Superintendent and Qualified Person as defined by NI 43-101.
MINERAL RESOURCES
Category 1,2,3,7 Deposit Tonnes Ag (g/t) Au (g/t) Pb (%) Zn (%) Contained Ag (oz)
Bellekeno2,4&5 262,000 585 n/a 3.5% 5.3% 4,928,000
Lucky Queen2,4&6 132,300 1,167 0.2 2.4% 1.6% 4,964,000
Indicated Flame & Moth2,4&6 1,679,000 498 0.4 1.9% 5.3% 26,883,000
Onek4&6 700,200 191 0.6 1.2% 11.9% 4,300,000
Bermingham2,4&5 1,102,300 930 0.1 2.4% 1.7% 32,959,000
Total Indicated Sub-Surface Deposits 3,875,800 594 0.34 2.0% 5.3% 74,034,000
Elsa Historical Tailings Resource 7 2,490,000 119 0.1 1.0% 0.7% 9,527,000
Total Indicated All Deposits 6,365,800 408 0.3 1.5% 3.3% 83,561,000
Bellekeno4&5 243,000 428 n/a 4.1% 5.1% 3,344,000
Lucky Queen4&6 257,900 473 0.1 1.0% 0.8% 3,922,000
Inferred Flame & Moth4&6 365,200 356 0.3 0.5% 4.3% 4,180,000
Onek4&6 285,100 118 0.4 1.2% 8.3% 1,082,000
Bermingham4&5 509,400 717 0.2 1.7% 1.5% 11,743,000
Total Inferred 1,660,600 455 0.2 1.6% 3.7% 24,271,000
1. All mineral resources, except the Elsa Historical Tailings Resource, are classified following the CIM Definition Standards for Mineral Resources and Mineral Reserves (May 2014) of NI 43-101.
2. Indicated mineral resources are inclusive of mineral reserves estimates.
3. Mineral resources are not all mineral reserves and do not have demonstrated economic viability. All numbers have been rounded to reflect the relative accuracy of the estimates.
4. The mineral resource estimates comprising Bellekeno, Lucky Queen and Flame & Moth, Onek and Bermingham are supported by disclosure in the news release dated March 28, 2019 entitled “Alexco Announces Positive Pre-Feasibility Study for Expanded Silver
Production at Keno Hill Silver District” and the technical report filed on SEDAR dated February 14, 2020 with an effective date of March 28, 2019.
5. The mineral resource estimate for the Bermingham and Bellekeno deposits are based on mineral resource estimates having an effective date of March 28, 2019. The Bellekeno deposit has been depleted to reflect all mine production from the Bellekeno mine to date.
6. The mineral resource estimate for the Lucky Queen, Flame & Moth and Onek deposits have an effective date of January 3, 2017.
7. The mineral resource estimate for the Elsa Tailings has an effective date of April 22, 2010 and is supported by the technical report dated June 16, 2010 entitled “Mineral Resource Estimation, Elsa Tailings Project, Yukon, Canada”. The Elsa Historical Tailings Resource is
classified following the CIM Definition Standards for Mineral Resources and Mineral Reserves (December 2005) of NI 43-101.
24
8. The disclosure regarding the summary of estimated mineral resources for Alexco’s mineral properties within the Keno Hill District has been reviewed and approved by Dr. Gilles Arseneau, P.Geo (Lucky Queen, Flame & Moth, and Onek deposits), Cliff Revering, P.Eng
(Bermingham deposit, and David Farrow, P.Geo. PrSciNat (Bellekeno deposit), Qualified Persons as defined by NI 43-101.Appendix II
Wheaton Precious Metals (“WPM”) Keno Hill Amended Silver Stream
WPM Production WPM Payment 25% LOM Production STREAM
Payment US$/oz
As Applied to 2019 PFS
$14.00
Production Payment is VARIABLE
$12.00
Defined as % of Spot PRODUCTION
Ag Prices PAYMENT
$10.00
US$ 13/Oz Ag and 600 FLOOR PRICE
$8.00 g/t Ag AND GRADE
$6.00 US$ 25/Oz Ag and/or CEILING PRICE
1,400 g/t Ag AND GRADE
$4.00
$2.00
$0.00
$13 $14 $15 $16 $17 $18 $19 $20 $21 $22 $23 $24 $25
Ag Spot Price US$/oz
PEA
PFSAg
AgHead
HeadGrade
Grade804
805gpt
gpt Ag Head Grade 1100 gpt Ag Head Grade 600 gpt
See slide 2 for cautionary statement and News Release dated March 29, 2017 entitled “Alexco and Silver Wheaton Amend Silver Purchase Agreement and Alexco Announces Positive Preliminary.
Economic Assessment for Expanded Silver Production at Keno Hill.”
25Appendix III
Wheaton Precious Metals (WPM) Keno Hill Amended Silver Stream
CDN$ Millions Total PFS Gross Revenue
$800
$700
$600
$500
$400
$300
$200
$100
$-
$10 $11 $12 $13 $14 $15 $16 $17 $18 $19 $20 $21 $22 $23 $24 $25 $26 $27 $28 $29 $30
Ag US$ Spot Price Per Ounce
#REF!
25% WPM Payment #REF!
75% AXU (Spot Prices)
See slide 2 for cautionary statement and refer to News Release dated March 29, 2017 entitled “Alexco and Silver Wheaton Amend Silver Purchase Agreement and Alexco Announces Positive Preliminary
Economic Assessment for Expanded Silver Production at Keno Hill.”
26Appendix IV
2019 Pre-Feasibility Study Results
Right-sized Low Capex Robust @ Today’s Prices High Returns
• 1.18 M tonnes Initial capital costs of • Average LOM NSR • Pre-tax NPV5
probable mineral $23.2 M comprising: $554/t of ore $136.4 M
reserves @805g/t Ag • $17.9 M mine • Direct operating costs of • After-tax NPV5
• 8-year mine-life development, PP&E $321/t of ore $101.3 M
• Annualized Ag in • $5.3 M working • LOM AISC Ag of • Pre-tax IRR 84%
concentrate 4.0 Moz capital US$11.94/oz 1 • After-tax IRR 74%
• Average throughput
430 tpd
A de-risked project, with longer-term scaleability and growth opportunities
1Calculated using the following PFS Average Prices: Ag US$ 17.91/oz, Au US$ 1,325/oz, Pb US$ 1.00/lb, Zn US$ 1.22/lb. and US$/CDN$ FX of $0.76.
See slide 2 for PFS cautionary statement. 27Contact Us
Kettina Cordero
Director of Investor Relations
778-945-6577 – kcordero@alexcoresource.com
Suite 1225, Two Bentall Centre – 555 Burrard Street
Vancouver, BC V7X 1M9
www.alexcoresource.comYou can also read