Moving Mission Forward - 2021 Budget Highlights - District of ...
←
→
Page content transcription
If your browser does not render page correctly, please read the page content below
Give Us Your Feedback by November 22
Moving Mission Forward
2021 Budget Highlights

Budget Public Consultation
The District of Mission Council is developing the 2021 to 2025 Financial Plan and would like to hear from the community.

Starting in the summer of 2020 and over the course of the fall, Council and staff compiled and deliberated the draft Financial
Plan with a focus on the 2021 budget. These discussions were guided in part by the input gathered during the annual Citizen
Satisfaction Survey.

Learn more about the Financial Plan in this document and give your feedback in our survey at engage.mission.ca. Your
feedback will be reported back to Council during the final budget meeting on December. 2 and used to further align the budget
with community priorities before the 2021 to 2025 Financial Plan Bylaw is adopted in January 2021.

2021 - 2025 Financial Plan
Mission updates its five-year financial plan annually to ensure   General Capital Budget – for general municipal capital
its finances are managed responsibly and to reflect the           projects such as playground equipment and upgrades, road
priorities identified by Council and the community. Council is    and bridge repairs, facility construction and improvements,
currently considering the 2021 to 2025 Financial Plan. The        and life-cycle equipment replacement.
plan includes specific funding requirements for 2021, and     Utility Budgets – the operating and capital budgets for water,
projections for 2022-2025.                                    sewer, drainage, and solid waste. These expenses are funded
At a high level, the financial plan combines:                 through user-fees and levies and are included on your
General Operating Budget – the day-to-day operational municipal tax notice, unless your property is metered.
expenses, such as recreation, inspections and protective New Initiatives – These are new initiatives or service level
services. Any proposed changes to this budget allow the changes based on Council’s strategic plan, master plans, and
municipality to continue to provide the same services, at the through ongoing works to improve operations and services to
same levels.                                                  the community.

   Give your feedback on the 2021 Budget and 2021-2025 Financial Plan
   online at engage.mssion.ca or via hardcopy survey by calling
   Municipal Hall at 604-820-3772 or email us at budget@mission.ca.                          Have Your Say!
   The survey is open until Nov. 22. Find more at mission.ca/budget
2
Financial Plan — Operating
Operating Expenses and Revenues
Consolidated Expenditures Operating expenditures are used to pay for the day-to-day activities of the
various community programs and services, such as a Parks crews and their
Mission offers a broad range of municipal equipment or delivering clean, safe water to homes and businesses.
services funded from six operating funds.
For 2021, the Financial Plan consolidated Consolidated Operating Expenditures
expenditures total $82.2 million: $82.2 million
General Operating Fund, $56.2 million, Engineering &
General
Government
Public Works
Water Utility Fund, $7.2 million, 3% Library 2%
8%
Sewer Utility Fund, $5.7 million, Development Services Water Utility
9%
Solid Waste Fund, $6.4 million, 9%
Sewer Utility
Drainage Utility Fund, $2.7 million, Transfer to Reserves 7%
Forestry Enterprise, $4.0 million. 6%
Solid Waste
Administration 8%
8%
The blue coloured sections of the Drainage Utility
consolidated operating expenditures graph 3%
Recreation
represents general operating fund services Protective Services
9% Forestry Enterprise
where the primary funding source is 23% 5%
property taxes.
Protective Services is the largest component of the operating budget at 23%.
Police Services at $13.3 million, or 16% of the consolidated budget,
Fire/Rescue Services at $5.4 million, or 7% of the consolidated budget.
Consolidated Revenue The financial plan for 2021 has $82.2 million in expenditures and revenues,
to deliver the same level of service as 2020 plus the new initiatives
The District has three main funding proposed by Council.
sources to pay for all municipal services.
For 2021, the Financial Plan consolidated
revenues total $82.2 million: Consolidated Operating Revenue
Property Taxes, $39.2 million,
$82.2 million
User Fees & Services, $22.4 million, Utility Fees
Utility Fees & Levies, $20.6 million. & Levies
25%
Property taxes are the main revenue
source for the General Operating Fund
expenditures while utility fees and levies
are the main source of revenue for the User Fees
utility funds. Property & Services
Each year, user fees and charges are Taxes 27%
reviewed and updated. The goal is to have 48%
the user fund, the cost of providing a
particular service, to lessen the reliance
on property taxes.
Visit: engage.mssion.ca and complete3 the survey by Sunday, November 22, 2020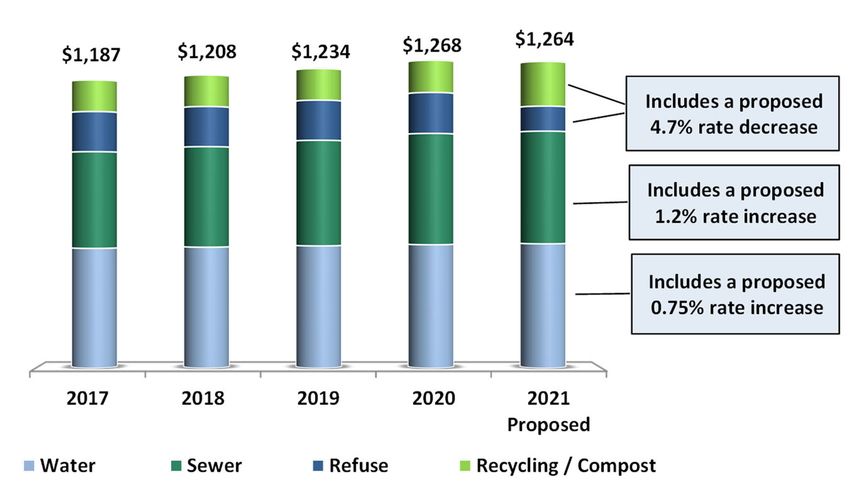
3
Financial Plan — Capital
Capital Projects Building our Community
The capital budget is for new or replacement infrastructure, such as facility
Council is committed to working with the
upgrades, replacing aging water and sewer pipes, or replacing a fire truck.
community to ensure resources are
Over the next five years, the District’s Capital Plan has over $85 million
available to fund services and to plan,
worth of capital projects slated as it continues to invest in infrastructure
manage and maintain public
such as transportation, facilities, water and sanitary sewer systems.
infrastructure assets.
$11 million of this plan is scheduled for capital projects in 2021. Condition
assessments on infrastructure, as part of the asset management program, Master plans for water, sewer, drainage
helps the District prioritize replacement capital projects within the long- and transportation will be completed in
term financial plan. 2021.
Capital projects for 2021 to 2025 Financial Plan include: The Design Operation and Closure Plan
General Fund capital projects total: $26.6 million including for the landfill will be completed in 2021.
Paving and sidewalks: $9.9 million
These master plans will provide for future
Intersection upgrades $4.1 million
capital projects.
Equipment purchases: $3.2 million
Traffic safety: $1 million 2021 to 2025 Capital
Water Utility: $40.3 million Traffic
Safety
Government Transfers
Sewer Utility: $13.2 million 1% Other
Drainage Utility: $3.2 million Equipment Projects In 2021, the District is projected to
Purchases 10% receive $2.68 million in grants from the
Solid Waste Utility: 4%
Provincial and Federal government.
$1.97 million
Water
Intersection
Upgrades
47%
$1.77 million will be used for capital
5% Paving & projects, with the balance of $910,000
Sidewalks
used to offset operating costs .
12%
Solid Waste
Sewer
2%
15%
Drainage
4%
Additional Capital Projects under Consideration
Council is considering adding $2,256,950 of new capital projects to the capital plan above. $1,403,950 are projects to address
several safety issues and protecting existing infrastructure issues arising from the aging facilities. These projects can be fund-
ed from existing reserves. In addition to these safety concerns, there are five community projects totaling $853,000. Four of
these could be funded from the Forestry reserve and one from the Community Amenity Contribution.
CAPITAL PROJECTS & POTENTIAL FUNDING AMOUNT CAPITAL PROJECTS & POTENTIAL FUNDING AMOUNT
Potential Cemetery Reserve Funding Potential Capital Reserve Funding
Cemetery upgrade and replace amenities $15,000 Ammonia Plant Condenser Water Treatment upgrade $29,950
Cemetery upgrade existing areas kiosks/signage $10,000 Centennial Park pathway repairs $100,000
Potential Community Amenity Contribution Funding Electrical upgrades at Fraser House $38,000
Pump Track $300,000 Electrical upgrades at Museum $25,000
Rotary Sports Park lighting upgrades (baseball) $222,000 Public Works Facility Washroom $35,000
Rotary Sports Park lighting upgrades (soccer fields) $444,000 Potential Insurance Reserve Funding
Potential Forestry Reserve Funding Sports field upgrades $50,000
Cade Barr School relocation $170,000 Potential Major Capital Reserve Funding
Devil's Lake Trail Loop $150,000 Leisure Centre Air Handling Unit #6 replacement $435,000
FRHP Flag Plaza renovations $125,000 Total $2,256,950
Mill Pond Trail continuation $108,000
Council is also considering approving a $745,000 capital project in the Water Utility.
604.820.3772 budget@mission.ca
4 engage.mssion.ca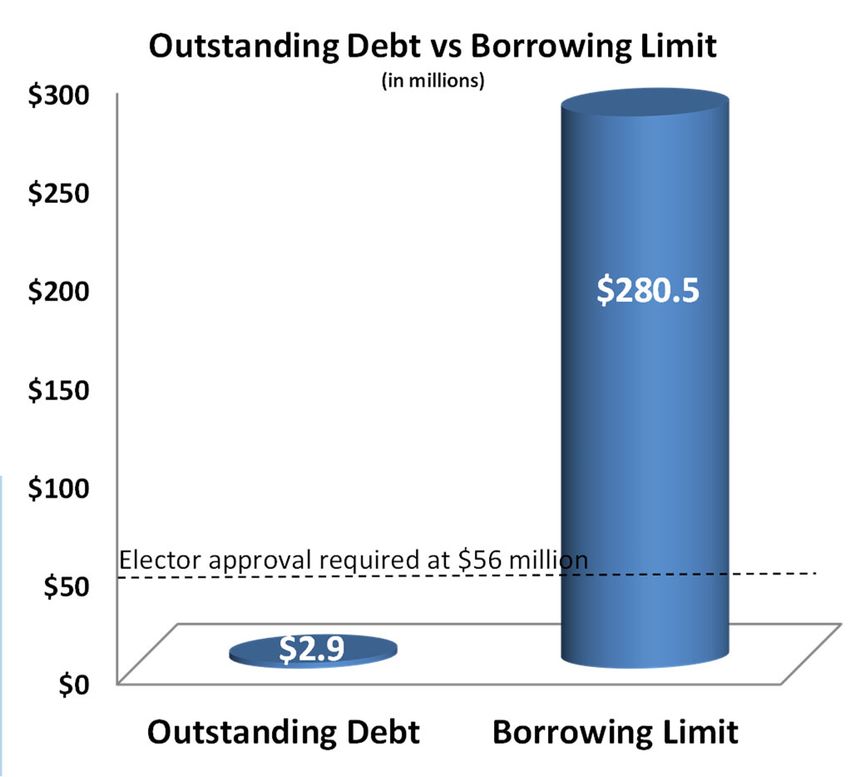
4
General Operating Fund
Proposed Budget Changes
Starting in the summer of 2020 and over the course of the fall, Council New initiatives and increased service levels
and staff compiled and deliberated the draft Financial Plan with a focus
total $899,091 This includes the balance of
on the 2021 budget. A line-by-line review was undertaken resulting in a
preliminary budget increase of $1.128 million. the additional firefighters and fire apparatus
and positions budgeted to start partway
Council was presented with service level spending packages worth
over $574,000 and are considering two for the Financial Plan. through 2020.
The proposed 3.6% increase to the general operating fund budget is To maintain current service levels, a net
$1,270,774. increase of $740,748 is required. This
includes a 1% estimate for CPI that is built into
Budget Potential many contracts.
Dollars Tax Impact
Development activity remains strong in
New Initiatives or Increased Service Level $899,091 2.55%
Mission generating new revenue projected at
Maintaining Existing Services 740,748 2.10%
$400,000.
Estimated taxes from New Construction ‐400,000 ‐1.14%
Additional Budget Projections ‐111,494 ‐0.31% Recent budget projections have resulted in a
Subtotal 1,128,345 3.19% reduction of $111,494 to the overall budget.
Spending packages presented to Council 574,508 1.63% Council is considering two service level
Council postponed spending packages ‐432,079 ‐1.23% spending packages worth $142,429 for 2021.
Subtotal ‐ Council considering 142,429 0.40%
The proposed changes total $1,270,774. This
Net Potential Changes $1,270,774 3.60%
increase represents an estimated increase of
. $75.81 to the property taxes of an average
assessed home of $692,455.
Key Budget Drivers
New Initiatives or Increase Service Levels Key Budget Drivers to Maintain Existing Services:
Additional career firefighters hired July, 2020. Vancouver consumer price indexing in operational
Increased training hours for Paid On-call firefighters. contracts.
Silverdale Development area planning engineer. The RCMP contract increased by 1% for 52 members and
the integrated teams.
Staffing positions phased in over two years.
BC Transit for the Central Fraser Valley Transit System
Clark Theatre additional grant funding.
includes the operational costs with new facility.
Marilyn Boswyk Centre opening in 2021.
Operating costs for snow clearing events has increased.
Maintenance costs of acquired property.
Operating costs for two new fire apparatus’ purchased in
Maintenance of existing facilities expansion. 2020.
Increased service levels to clean-up homelessness On the revenue side, traffic fine revenue grant projection
camps and hazardous waste. from the Provincial government has increased, and
Administrative fee collected from the utility funds increased.
Visit: engage.mssion.ca and complete
5 the survey by Sunday, November 22, 2020
5
General Operating Fund
Operating Service Level Spending Packages, under Consideration
Council is considering these service level spending packages for the 2021 to 2025 Financial Plan:
Parks, Recreation and Culture —
Clark Theatre for $50,000
Administrative Assistant for $92,429*
To provide administrative support to the department Funding request to develop a new operating
which will allow management staff to focus on time agreement with the School District to provide
sensitive projects, higher level duties and increasing community programming at the Clarke
overall efficiency for the District. Foundation Theatre.
* This cost covers labour, overhead, supplies and
equipment.
Municipal Services Funded by Taxation
Property taxation is the main source of revenue for the District’s General Operating Fund. Property tax notices, mailed out
each May, include taxes collected for municipal services along with taxes collected on behalf of various other taxing
authorities. Depending on where you live, your tax notice may also include charges for municipal utilities.
The District’s Financial Plan proposes collecting $39 million in property taxes of which $2 million are collected as grants in lieu
of taxes from the senior levels of government. A one percent increase in property taxes will generate $353,000 in additional
tax revenue in 2021.
In 2020, the average assessed home in Mission paid $2,106 in property taxes for municipal services.
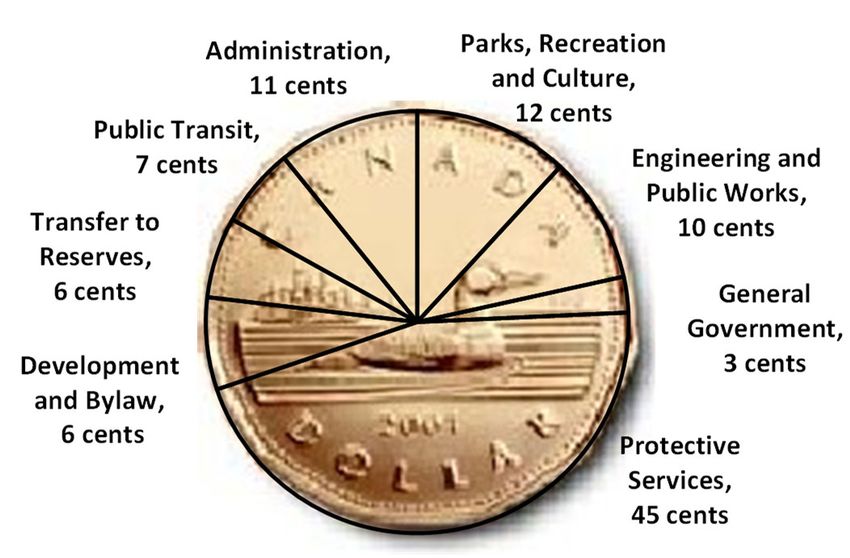
Property Tax Notice Breakdown for 2020
on the Average Assessed Home in Mission
Municipal Services Annual Monthly
Protective Services $959 $80
Engineering and Public Works $205 17
General Government $58 5
Parks, Recreation and Culture $249 21
Administration $228 19
Public Transit $149 12
Transfer to Reserves $128 11
Development and Bylaw $130 11
For every dollar spent on property taxes, 45 cents goes to
protective services (Police & Fire) and 6 cents is used for 2020 Municipal Taxes $2,106 $176
capital spending.
604.820.3772 budget@mission.ca
6 engage.mssion.ca6
Municipal Utilities
Water Utility Regional Utilities
The District owns and operates over 195 km of water mains in the local water Although the District solely
distribution system that serves over 11,000 customer accounts. operates the local water
Highlights of the 2021 water utility operating budget include: distribution system and local
sewer conveyance system, the
User fees are estimated at $6.8 million, 94% of all revenue collected.
District of Mission and the City of
Transferring of $3.2 million to reserves will support future capital upgrades.
Abbotsford are joint partners in
Additional $123,000 in revenue as new customers come on-line. the water supply and sewage
Lower interest rates projected for 2021 will reduce the revenue by $166,000. treatment systems, which benefit
Interest revenue is transferred to reserves which will be reduced equally. residents in both communities.
These services are cost shared
To keep pace with inflation and maintain healthy reserves for both the regional and based on each community’s
local water systems, Council is considering a 0.75% increase in water user fees. usage. Mission’s share for the
This will increase the annual flat rate fee by $3.84 for a total of $512.64 per year or regional utilities for 2020 were:
$42.72 per month.
Water 23.28%
Sewer 19.59%
Revenue Changes *
Water Utility Revenue
Increase to local water distribution revenue $ ‐123,298 $7.2 million
Decrease in projected interest revenue 166,108 Sale of
Investment Service &
Increase to regional water distribution revenue ‐561 Income Recoveries
4% 2%
Subtotal ‐ Revenue Decreases $ 42,249
Expense Changes
Increase to regional water distribution expenses $ 78,301 Water Utility Expenditures
Increase to local water distribution expenses 95,246 $7.2 million
Decrease transfer of interest revenue to reserves ‐166,108 User Fees
94%
Subtotal ‐ Expense Increase $ 7,439
Local
Services
Decrease to Transfer to Water Capital Reserve $ 49,688 Transfers to
Expenses
Reserves
44% 38%
Proposed spending package 46,013
Increased revenue if rates increased by 0.75% ‐49,688
Regional
Expenses
Reduction in transfer to Water Capital Reserve $ 46,013 18%
* Increases to revenue appear as negative values
Capital Capital Spending Package Water Utility Master Plan
Capital projects for the water utility Council is considering one new capital A Master Plan for the water utility is
total over $40.31 million over five years project for 2021 for $745,000 to purchase underway with completion expected in
with approximately $15 million Supervisory and Control Data 2021. This plan will impact the capital
assigned for the new water source Acquisitions (SCADA) upgrades. These budget with yet to be identified
through the regional water utility upgrades will decrease the likelihood of a projects and revised budget numbers.
starting in 2022. The District is SCADA failure and more costly reactive
continuing the watermain replacement repairs in the future., while providing Water delivery, $42.72 per month.
and upgrades to the local water system improved data collection and system
for $1 million per year until 2028. monitoring capabilities.
Visit: engage.mssion.ca and complete
7 the survey by Sunday, November 22, 20207
Municipal Utilities
Under Consideration Sewer Utility
Operating Service Level The District owns and operates over 155 km of sewer mains in the local sewer
Spending Package: conveyance system that serves over 8,000 customer accounts.
Highlights of the 2021 sewer utility budget include:
Asset Data Collector
$46,013 Water / $46,013 User fees are estimated at $5.2 million, 91% of all revenue collected.
Sewer Transferring of $1.8 million to reserves will support future capital upgrades.
Council is considering increasing Additional $116,000 in revenue as new customers come on-line .
this service level to perform and Lower interest rates projected for 2021 will reduce the revenue by $78,095.
document inspections on Interest revenue is transferred to reserves which will be reduced equally.
existing assets, focusing on risk
management issues and To keep pace with inflation and to build-up our reserves to support the JAMES
maintenance requirements of the Wastewater Treatment Plant (which includes a $46.8 million project for seismic
District’s water and sewer upgrades and flood proofing starting in 2030), Council is considering a 1.2%
systems. increase in Sewer User Fees.
The costs to increase this service This will increase the annual flat rate fee by $5.52 for a total of $463.92 per year or
are shared 50/50 between the $38.66 per month.
water and sewer utilities.
Sewer Utility Revenue Revenue Changes *
$5.7 million Increase to local sewer collection revenue $ ‐116,311
Sale of
Decrease in projected interest revenue 78,095
Regional Service Investment Decrease to regional sewer collection revenue 19,886
1% Income
Revenue
3%
Subtotal ‐ Revenue Increases $ ‐18,330
5%
Expense Changes
Decrease transfer of interest revenue to reserves $ ‐78,095
Decrease to regional sewer collection expenses ‐35,775
Increase to local sewer collection expenses 53,957
Subtotal ‐ Expense Decreases $ ‐59,913
User Fees
91% Increase to Transfer to Sewer Capital Reserve $ ‐78,243
Proposed spending package 46,013
Sewer Utility Expenditures Increased revenue if rates increased by 1.20% ‐60,600
$5.7 million
Increase in transfer to Sewer Capital Reserve $ ‐92,830
* Increases to revenue appear as negative values
Transfers to
Reserves
32% Local Capital Sewer Utility Master Plan
Services
Expenses Capital projects for the sewer utility total A Master Plan for the sewer utility is
46%
over $13.2 million over five years. The underway with completion expected in
Regional
District is continuing to assess and 2021. This plan will impact the capital
Expenses
22% replace the District’s aging sewer mains budget with yet to be identified projects
with an annual budget of $304,000. and revised budget numbers.
Sewer conveyancing, $38.66 per month.
604.820.3772 budget@mission.ca
8 engage.mssion.ca8
Municipal Utilities
Solid Waste
Mission owns the Landfill (Minnie’s Pit), the Mershon Street Recycling Depot Did You Know
and jointly owns the Abbotsford/Mission Recycling Depot and Sorting facility Since the bi-weekly schedule came into
(AMRD), located in Abbotsford. effect (April 2016), the curbside
Highlights of the 2021 solid waste management budget include: garbage diversion rate has increased
from 53% to 65%, meaning less
Total transfer to Refuse Reserve: $792,565 (an increase of $447,487),
garbage is being sent to the landfill.
Increased AMRD revenue & Recycle BC Incentive: $76,558,
Curbside Levy Revenue: $113,228 decrease due to fee reduction,
Decreased curbside pickup costs: $639,587, and 2020 Fees
Proposed Reduction
Fees $ %
Decreased AMRD expenses: $20,451.
Refuse Collection $168.60 $102.96 ‐$65.64 ‐38.9%
Recycling/Compost $132.72 $184.20 $51.48 38.8%
In 2020, a new curbside collection contract was approved Total $301.32 $287.16 ‐$14.16 ‐4.7%
with substantial budget savings. These savings along with
changes under Recycle BC results in a shift in the cost Curbside Rate Reduction
ratio between refuse activities and recycling/compost Savings from the curbside collection contract is being
activities. It was recommended that fees be structured to passed to the customer with a 4.7% reduction for refuse
more closely represent the cost ratios. and recycling/compost collection fees.
Revenue Changes * Solid Waste Revenue
Increase to AMRD & RecycleBC Incentive $ ‐76,558 $6.4 million
Increase to curbside pick‐up ‐52,659 General Administration
AMRD 1%
Decrease in projected interest revenue 2,757 13%
Decrease in landfill operations 9,774
Subtotal ‐ Revenue Increases $ ‐116,685 Curbside Pick‐
Landfill Up
Expense Changes Solid Waste Expenditures
Operations 52%
$6.4 million 34%
Decrease to curbside pick‐up $ ‐639,587
Decrease to AMRD expenditures ‐20,451 Enviromental Transfer to
Decrease to Environmental Stewardship ‐17,386 Stewardship Reserves
Curbside
4% 15%
Decrease transfer of interest revenue to reserves ‐2,757 Recycling
26%
Increase in landfill operations 78,021 Curbside
Refuse
Increase in administration overhead 105,471 14%
Regional
Recycling
Subtotal ‐ Expense Reductions $ ‐496,689 Landfill 11%
Operations
Increase to 2021 Transfer to Refuse Reserve $ ‐613,374
AMRD
30%
Decreased revenue if rates decreased by 4.7% 165,887
The District of Mission and the
Increase in transfer to Refuse Reserve $ ‐447,487
City of Abbotsford are joint
*Increases to revenue appear as negative values partners in the Abbotsford
Mission Recycling Depot in
Abbotsford, which benefits
Capital Master Plan residents in both communities.
Capital projects for the solid waste utility A Design Operation and Closure Plan for These services are cost shared
total over $1.97 million over five years with the landfill is underway with completion based on each community’s
approximately $1.2 million assigned for expected in 2021. This plan will impact the usage. Mission’s share for the
equipment and upgrades to the AMRD capital budget with yet to be identified AMRD in 2020 were:
facility. projects and revised budget numbers. Operating 18.47%
Curbside Collection, $23.93 per month. Capital 19.92%
Visit: engage.mssion.ca and complete
9 the survey by Sunday, November 22, 20209
Municipal Utilities
Summary of Flat Rate Utility Fees
Flat rate user fee are used to maintain the long-term
health of the regional and local utility operations and
to fund future capital projects. For 2021, there is a
net reduction of $4.80 for all four fees.
Change for 2021 Total User
Utility
% $ Fees
Water 0.75% $3.84 $512.64
Sewer 1.2% $5.52 $463.92
Refuse (4.7%) ($5.04) $102.96
Recycling/
(4.7%) ($9.12) $184.20
Compost
The monthly fee to provide all four services is $105.31.
Drainage Utility Capital
The District owns and operates over 156 km of storm water drainage systems Capital projects for the drainage utility
that serves all of Mission. total over $3.2 million over five years.
Highlights of the 2021 drainage utility operating budget include:
Drainage Utility Master Plan
Increased revenue of $19,400 from new development.
A Master Plan for the drainage utility is
Drainage levy of $2.4 million is 90% of all revenue collected. underway with completion expected in
Transferring of $815,000 to reserves will support future capital upgrades. 2021. This plan will impact the capital
budget with yet to be identified projects
Lower interest rates projected for 2021 will reduce the revenue by $5,158.
and revised budget numbers.
Interest revenue is transferred to reserves which will be reduced equally.
Drainage Utility Expenditures Drainage Levy
$2.7 million The drainage utility program, established in 2016, has
challenges developing a capital program for replacement and
Transfers to upgrading of the District’s storm water drainage systems. The
Reserves drainage budget includes an increase in the transfer to capital
31%
reserve of $125,000 which represents a 5.54% an increase to
Drainage
Operations the drainage levy. This would increase the averaged assessed
69%
home by $7.50.
Drainage Utility Revenue Budget Potential Dollar
$2.7 million Dollars Tax Impact Impact *
Diking Levy Maintain Existing Services $19,428 0.86% $1.16
4%
Estimated Taxes from New Construction ‐19,428 ‐0.86% ‐1.16
Other
Revenues
Subtotal 0 0.00% 0.00
6%
Transfer to Drainage Capital Reserve 250,000 11.08% 15.00
Drainage Levy Defer 50% of Capital Reserve transfer ‐125,000 ‐5.54% ‐7.50
90%
Net Potential Changes $125,000 5.54% $7.50
* Using average home value of $692,455 (2020)
604.820.3772 budget@mission.ca
10 engage.mssion.ca10
Reserves and Debt
Reserves
In 2021, the District is budgeting to transfer $14.4 million from operations TRANSFERS TO RESERVES
into both operating and capital reserves to help build balances to ensure
General Fund $6,789,000
funds are available for future capital and operating expenditures.
Water Utility 3,174,000
Capital reserve funds are being built so funding is available for all or partial
Sewer Utility 1,839,000
expenditures of several large projects starting over the next 20 years.
Solid Waste 952,000
Operating reserves are being built up to fund large periodic operating
expenditures such as the election that occurs every four years. Drainage Utility 826,000
Forestry Enterprise 833,000
Total Transfers $14,413,000
Several reserves are restricted by legislation regarding the capital or operating expenditures they can be used for.
Reserve Projections 2021 2022 2023 2024 2025
Community Works Gas Tax $2,206,485 $2,521,011 $3,146,253 $3,193,446 $3,241,348
Gaming 219,423 297,270 377,090 478,459 586,385
Operating Reserves 9,648,136 9,882,953 10,533,289 11,167,114 11,847,111
General Capital Reserves 15,901,855 17,757,605 20,774,721 23,120,113 26,393,071
Water Reserves 20,586,285 20,370,802 21,012,903 17,951,630 16,034,943
Sewer Reserves 13,847,564 14,366,976 13,834,396 12,184,723 9,565,674
Drainage Reserves 909,381 1,582,934 2,679,666 3,404,961 3,864,073
Solid Waste Reserves 2,873,478 3,468,625 4,190,415 4,890,673 4,742,682
Total Projections $66,192,608 $70,248,175 $76,548,733 $76,391,119 $76,275,286
Note: Projections do not include capital projects under consideration or restricted revenue reserves.
Debt
Mission has a “pay as you go” philosophy of saving ahead for funding
infrastructure and capital projects where ever possible. Interest cost of
debt financing (borrowing), particularly external debt financing, can add
significantly to the overall cost of a project.
For internal borrowing (where one reserve account “lends money” to
another), the borrowing reserve repays the lending reserve with
interest, avoiding interest payments to external parties.
Water, sewer, solid waste, and drainage utilities are all currently debt
free from external sources.
The District’s external borrowing limit is approximately $280.5 million,
based on legislated limits, current estimated interest rates, and
assuming 20 year terms on average. The District’s current outstanding
long-term debt will be $2.9 million as at December 31, 2021.
Keeping debt low allows flexibility for future large capital projects.
Visit: engage.mssion.ca and complete
11 the survey by Sunday, November 22, 202011
Municipal Enterprise
Forestry Enterprise
The District operates Tree Farm License #26 (TL26), which was awarded in 1958 as a strategy to support local mills,
build economic opportunities and fund community needs. TFL26 covers 10,900ha in size; in addition to a working
forestry operation that provides direct revenue to our Community, TFL26 also includes over 59km of Trails for all level of
walking and biking enjoyment.
Highlights of the 2021 Forestry Enterprise budget include:
Annualallowable cut has increased from 45,000 cubic meters to 60,000 cubic meters. Timber sales are expected
to increase by $640,000.
Transferring of $833,000 to reserves will support future capital upgrades and community projects.
Lowerinterest rates projected for 2021 will reduce the revenue by $25,800. Interest revenue is transferred to
reserves which will be reduced equally.
Recreational
The Municipal forest manages 21 trails totaling 25 km, that Under Consideration
were built and are maintained by the District of Mission Council is considering funding four community projects,
forestry department. The remaining 34 km of trails were worth $553,000 from the Forestry reserve ;
built by unknown individuals. A portion of these trails are
Cade Barr School relocation, $170,000
now managed under a partnership between the Ministry of
Devil’s Lake Trail Loop, $100,000
Forests, Lands, Natural Resource Operations, and Rural
Development and the Fraser Valley Mountain Biking Fraser River Heritage Park Flag Plaza, $125,000
Association. Mill Pond Trail continuation, $108,000.
Forestry Enterprise Revenue Revenue Changes *
$4 million Increase to Timber Sales $ ‐640,000
Decrease in projected interest revenue 25,866
Interest on
Sale of Services Subtotal ‐ Revenue Increases $ ‐614,134
Investments12
Moving MissionForward
Moving Mission Forward
2020 Municipal Budget Highlights
2021 Municipal Budget Highlights
Budget Summary Estimated 2021 Property Tax Notice
Council is looking for input from the public
prior to finalizing the budget. Council is
considering the following changes to the
users fees and property levies: 2020 2021
Based on the Average Assessed
Property Estimated Property
Property tax, increase of 3.6% Home in 2020 of $692,455
Tax Notice Tax Notice
Water user fees, increase of 0.75%
Municipal & Drainage Charges Values Values Changes
Sewer user fees, increase of 1.2%
Municipal Property Taxes $2,105.89 $2,181.70 $75.81
Drainage levy, increase of 5.54%
Drainage Levy 135.44 142.94 7.50
Curbside collection fees for refuse and
Subtotal: 2,241.33 2,324.64 83.31
recycling collections, decrease of 4.7% .
Flat Rate Municipal Utilities
When these rates are considered
Water User Fees 508.80 512.64 3.84
together, the average home in Mission of
$692,455, would see their property taxes Sewer User Fee 458.40 463.92 5.52
and utilities increase a total of $78.51 for Refuse Collection 2)
108.00 102.96 -5.04
municipal services only. This is an Recycling/Compost Collection 2)
193.32 184.20 -9.12
increase of 2.24% over 2020.
Subtotal: 1,268.52 1,263.72 -4.80
1)
Total Municipal & Utility Charges: $3,509.85 $3,588.36 $78.51
Estimated Impact
Property Tax Notice Increase over 2020
The estimated impact of a 2.24% increase
on various assessed value properties for Increase in Dollars: $78.51
municipal taxes and utilities only: Increase as a Percentage: 2.24%
1)
Assessed Tax & Utility The impacts of the Provincial Home Owner Grant is ignored in this example.
2)
Value Increase 2020 Revised to reflect changes in budget ratio between refuse & recycling.
$392,370 $45.66
$692,455 $78.51
$885,000 $99.59
Average assessed value townhouse = $392,370
Average assessed value home = $692,455
Share Your Thoughts
We invite you to take part in the budgeting process by sharing your thoughts. You can do this online at engage.mission.ca,
by email at budget@mission.ca, or by filling out the survey insert included in this document and returning it to Municipal Hall
by Sunday, November 22, 2020.
Council and staff are committed to an open and transparent budget process, and want to make sure residents and local
businesses and organizations have the opportunity to have their voices heard.
Your feedback is presented to Council and is a crucial part of the decision-making process for the budget and financial plan.
604.820.3772
604.820.3772 budget@mission.ca
budget@mission.ca engage.mssion.ca
mission.ca/budgetYou can also read