POWER THE CURIOUS COMPANY OVERVIEW MARCH 2019 - OCTOBER 2017 - SURVEYMONKEY INVESTOR RELATIONS
←
→
Page content transcription
If your browser does not render page correctly, please read the page content below

Power The Curious
  Company Overview
  March 2019

October 2017

CONFIDENTIAL AND ATTORNEY-CLIENT PRIVILEGED   1
Legal Disclaimer
This presentation contains forward-looking statements. All statements other than statements of historical fact contained in this presentation, including statements as to future results of
operations and financial position, planned products and services, business strategy and plans, objectives of management for future operations of SVMK Inc. and its subsidiaries
(“SurveyMonkey” or the “Company”), market size and growth opportunities, competitive position and technological and market trends, are forward-looking statements. In some cases, you
can identify forward-looking statements by terms such as “expect,” “plan,” “anticipate,” “intend,” “target,” “project,” “predicts,” “potential,” “explore” or “continues” or the negative of these
terms or other similar words. SurveyMonkey has based these forward-looking statements largely on its current expectations and assumptions and on information available as of the date of
this presentation. The Company assumes no obligation to update any forward-looking statements after the date of this presentation, except as required by law.

The forward-looking statements contained in this presentation are subject to known and unknown risks, uncertainties, assumptions and other factors that may cause actual results or
outcomes to be materially different from any future results or outcomes expressed or implied by the forward-looking statements. These risks, uncertainties, assumptions and other factors
are described in greater detail under the heading “Risk Factors” in the Company’s quarterly report on Form 10-K for the year ended December 31, 2018 filed with the Securities and
Exchange Commission on February 26, 2019 (which is available for free by visiting EDGAR on the SEC website at www.sec.gov) and include, but are not limited to, those related to the
Company’s business and financial performance, ability to attract and retain users, ability to develop new products and services and enhance existing products and services, ability to
execute on the Company’s business strategy, ability to compete effectively and ability to manage growth. Moreover, SurveyMonkey operates in a competitive and rapidly changing
environment, and new risks may emerge from time to time. It is not possible for the Company to predict all risks, nor can SurveyMonkey assess the impact of all factors on its business or
the extent to which any factor, or combination of factors, may cause actual results or outcomes to differ materially from those contained in any forward-looking statements the Company
may make.

In addition to the U.S. generally accepted accounting principles (“GAAP”) financials, this presentation includes certain non-GAAP financial measures, including core revenue, average
revenue per paying user (“ARPU”), and unlevered free cash flow. Non-GAAP financial measures have limitations as analytical tools and you should not consider them in isolation or as a
substitute for or superior to the most directly comparable financial measures prepared in accordance with U.S. GAAP. There are a number of limitations related to the use of non-GAAP
financial measures versus their nearest GAAP equivalents. First, core revenue and unlevered free cash flow are not substitutes for revenue and net cash provided by operating activities,
the most directly comparable GAAP financial measures. Additionally, ARPU is calculated based on core revenue, which is not a substitute for revenue, its most directly comparable GAAP
financial measure. Second, other companies, including companies in SurveyMonkey’s industry, may calculate non-GAAP financial measures differently or may use other measures to
evaluate their performance, all of which could reduce the usefulness of the Company’s non-GAAP financial measures as tools for comparison. SurveyMonkey urges you to review the
reconciliation of SurveyMonkey’s non-GAAP financial measures to the most directly comparable GAAP financial measure, and not to rely on any single financial measure to evaluate
SurveyMonkey’s business. A reconciliation of these measures to the most directly comparable GAAP measures is included at the end of this presentation.

This presentation also contains estimates and other statistical data made by independent parties and by the Company relating to market size and growth and other industry data. This data
involves a number of assumptions and limitations, and you are cautioned not to give undue weight to such estimates. The Company has not independently verified the statistical and other
industry data generated by independent parties and contained in this presentation and, accordingly, it cannot guarantee their accuracy or completeness. In addition, projections,
assumptions and estimates of its future performance and the future performance of the markets in which it competes are necessarily subject to a high degree of uncertainty and risk due to
a variety of factors. These and other factors could cause results or outcomes to differ materially from those expressed in the estimates made by the independent parties and by
SurveyMonkey.
                                                                                                                                                                                                     2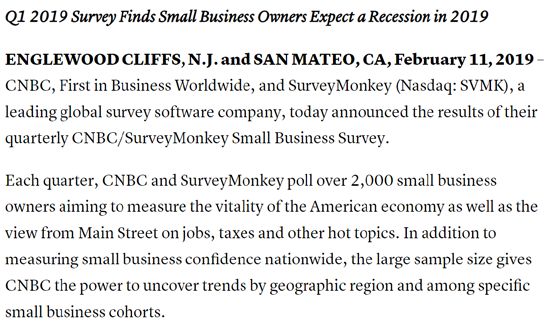
Our mission

    To power curious individuals and
organizations to measure, benchmark and
   act on the opinions that drive success

                                            3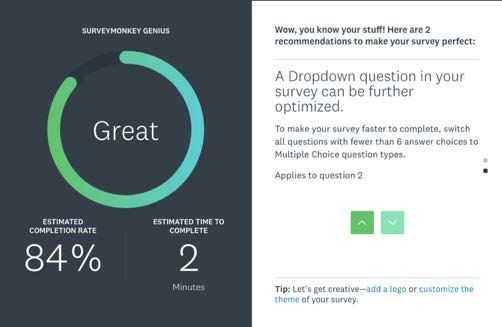
Why SurveyMonkey

                          Powerful   Data Fuels AI   Enterprise
  Brand     Massive                                               Culture
                          Business   and Machine       Grade
Awareness   Footprint                                             Matters
                           Model       Learning       Solution

                                                                            4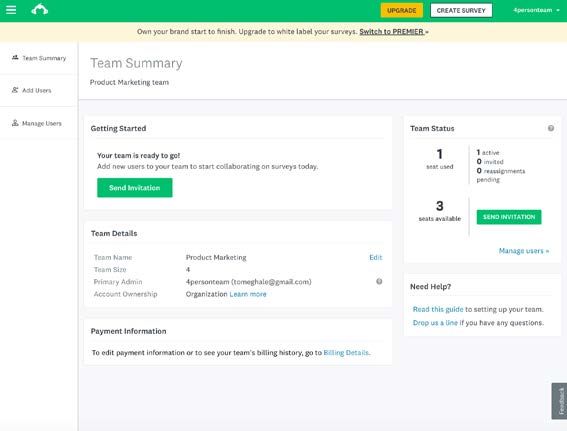
SurveyMonkey by the numbers

                     Active Users                                                                       Paying Users                                 Organizational Domains

                       17.5M+                                                                                 647K                                         345K+
                                                                                                   77% on annual plans

                                                                                                    Daily Questions                                      Daily Survey
               % Using for Work
                                                                                                      Answered                                           Respondents
                                                1

                         80%+                                                                                   20M                                         2.4M
Note: All amounts as of December 31, 2018, except as noted.
(1) Percentage of our paying users we believe are utilizing our products for business purposes; based on Internal survey conducted September 2016.

                                                                                                                                                                              5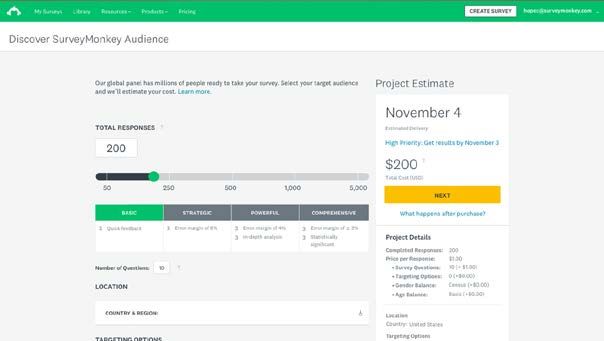
The nature of engagement between organizations and key
                constituents is changing
                                                                      Big Data
                                                                 Allows organizations to
                                                                     measure WHAT
             Increased customer                                      constituents do
                 expectations
Trends

                                         People Powered Data
            Importance of employee        Allows organizations
                 expectations             to understand WHY
                                          constituents do what
                                              they do and
                                             anticipate their
                                                 actions
         Consumerization of enterprise
                 software

                                                                                     6
Data insights are critical for a large percentage of the
                 working population
                                           Top-down                                                                                                                                                            Bottom-up

                                                                                                                                                                                                     INTERNATIONAL
                                                                                                                                                                                                                                                                      Represents ~50% of
                                                                                                                                                                                                                                                                      total global software
                                                                                                                                                                                                                                                                      market in 2018

         $6B
   Customer Experience
                                                                $7B       Global Talent
                                                                                                                                                                                                                   U.S
      Management                                                          Management                                                                                                                                                  61M
                                                                            Software                                                                                                                            U.S. KNOWLEDGE WORKERS

                                                                                                                                                                                                                                x $425
                                                                                                                                                                                                                                          ARPU1

                                                                                                                                                                                          ~$26B
                      $45B          Market Research
                                                                                                                                                                                                             PEOPLE POWERED DATA
                                                                                                                                                                                                             PLATFORM & SOLUTIONS

  Source: MarketsandMarkets estimates that approximately $6 billion was spent on customer experience management worldwide in 2017 (MarketsandMarkets, Customer Experience Management Market by Touch Point, Vertical, and Region – Global Forecast to 2022, November 2017); Technavio
  estimates the global talent management software spend in 2018 at approximately $7 billion (Technavio, Global Talent Management Software Market 2018-2022, June 2018); Based on ESOMAR’s Global Market Research 2017 report, the market research industry in 2016 was $45 billion
  (ESOMAR, Global Market Research 2017: An ESOMAR Industry Report in cooperation with BDO Accountants & Advisors, 2017); We estimate the U.S. market opportunity for our People Powered Data platform to be approximately $26 billion, and our worldwide opportunity to be significantly
  larger. We calculate our U.S. market opportunity by multiplying the total number of U.S. knowledge workers, defined as management, professional and related occupations according to the U.S. Bureau of Labor Statistics, by our annual average revenue per paying user. For the year ended
  December 31, 2018, 36% of our revenue was from customers outside of the United States. Further, Gartner estimates, in Gartner Market Databook, 2Q18 Update, 20 July 2018 (Gartner, Inc., Gartner Market Databook, 2Q18 Update: Spending on IT by Technology Segment and Country, 2016-
  2022, 20 July 2018), that the United States will represent approximately 50% of total global software spend in 2018 (calculations performed by SurveyMonkey). Based on this, we believe that our aggregate global opportunity is significantly larger than our U.S. market opportunity.
  (1)    Annualized ARPU for the three months ended December 31, 2018                                                                                                                                                                                                                           7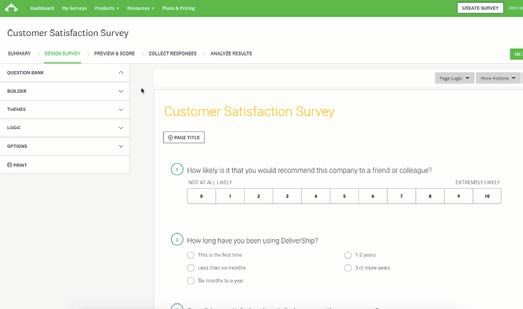
We deliver

  People Powered Data
  Actionable insights driven from people’s voices, ideas, and opinions

Measure                     Benchmark                             Act

                                                                         8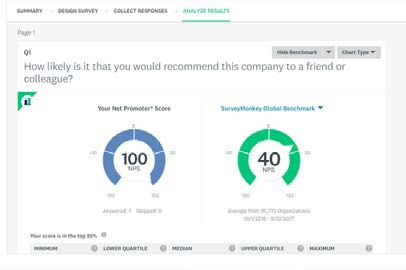
SurveyMonkey powers engagement with
       three key constituents
        CUSTOMER                MARKET               EMPLOYEE

       CSAT and NPS          Concept testing    Employee engagement

       Event planning        Pricing analysis       360 Reviews

                                                      Learning
         Lead forms           Market trends
                                                    assessments

                                                     Compliance
    Customer testimonials    Ad effectiveness
                                                      tracking

                                                Diversity and inclusion
     Patient satisfaction     Market sizing
                                                        tracking

    Lost customer analysis   Analyst research     Meeting feedback

                                                     Onboarding
      Product feedback        Brand tracking
                                                       forms

                                                                          9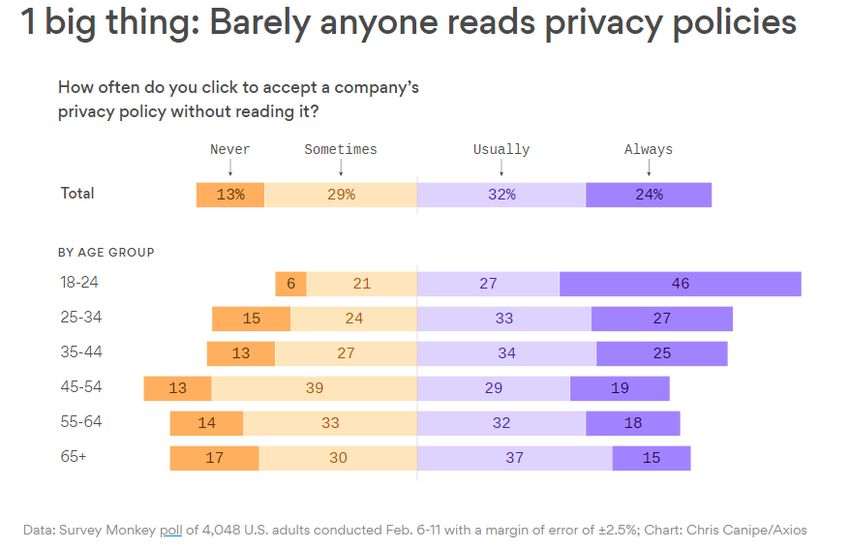
Easy to use, powerful, scalable
                               Get real-time feedback
                               from around the world

 Surveys: the easiest way to
                                                        Enabling teams to collaborate
collect People Powered Data

                                                                                        10
Land and expand: Our business is fueled by virality
Low-touch self-serve Sales-assisted
Create Reach Expand Accelerate
Upsell
Organizations to
Enterprises and Monetize
Active Users
~4x initial increase in
ARR1
Individual signs Sends survey to Respondents and Expand Usage and
up and creates respondents. Invites collaborators sign up Retention
a survey others to collaborate and create more
and share results surveys Cross-sell Solutions
5 use-case solutions
to increase ARPU
(1) Since the beginning of 2017, the annualized revenue from new sales of our SurveyMonkey Enterprise plan has represented an approximately 4x increase
over the total annualized revenue from the individual paid subscriptions from those organizational domains over the prior 12 month period Higher share of wallet and retention
11We have a portfolio of People Powered Data offerings
CUSTOMERS EMPLOYEES MARKET APPLICANTS
PURPOSE-BUILT SOLUTIONS
ENTERPRISE
SECURITY &
HIPAA / GDPR ADMINISTRATION COLLABORATION WORKGROUPS CUSTOM BRANDING CUSTOM LIBRARY
ENCRYPTION
SURVEY PLATFORM
ADVANCED
SURVEY AUTHORING PRO QUESTION TYPES ADVANCED LOGIC SURVEY EXPERIENCE KIOSK / MOBILE SDK MOBILE APPS
ANALYTICS
CONTACT
SURVEY TEMPLATES QUESTION BANK SURVEY COLLECTORS OFFLINE SURVEYS TEAMS PANEL
MANAGEMENT
GENIUS
QUESTION
PREVIEW & SCORE RECOMMENDATIONS ANSWER PREDICTION SENTIMENT SCORING TEXT ANALYSIS BENCHMARKS
PREDICTION
API
INTEGRATIONS
12Our technology integrates into the
customer’s systems of record
Marketing Productivity and Social and Security and
Analytics
and Sales Collaboration Communications Workflow
~17K Apps Created with our APIs
13Data is a competitive moat
Surveys Data
2.4M survey respondents 20M questions
per day answered per day
SurveyMonkey
Genius
Machine learning powered
assistance helps customers
get to better insights faster
Customer 360
Leveraging Our Data to Drive
Customer Success and
Increase Revenue
Operational
leverage Insights
Predictions, Recommendations, 190 countries and territories
Benchmarks 16 languages
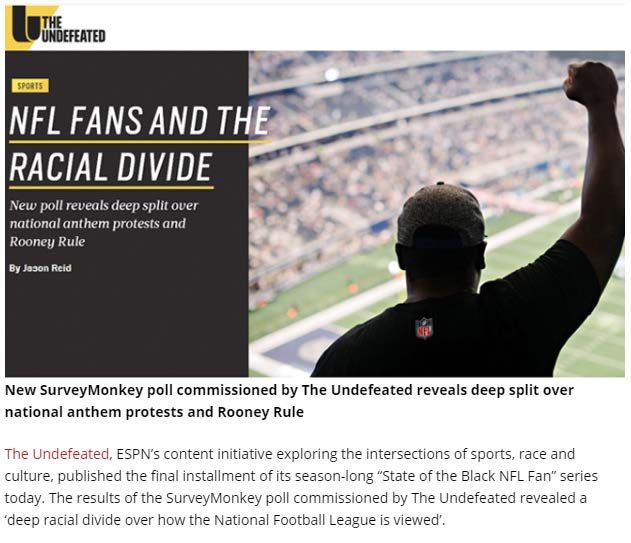
14SurveyMonkey enjoys 79% brand awareness
Our brand is enhanced via news partnerships…
…providing critical insights on salient and timely issues
15
Source: Brand awareness in our largest markets based on a poll we conducted in June 2017 using a third-party software platform.We are committed to three primary growth drivers
1 2 3
Selling directly to the Accelerating growth in Expanding in key
enterprise self-serve via Teams international markets
• Embrace and leverage our massive user base • Designed for small groups of users to • Targeted investments in key Western European
to move up-market and establish enterprise- collaborate and collect feedback in a secure markets via marketing, cloud datacenter, and
level relationships environment and ensure one user per account enterprise sales team
• 12% of revenue from enterprise sales channel1 • Teams plans purchased in over 50 countries, • 36% of revenue from outside the US1
and 3.6K enterprise sales customers2 97 of Fortune 500 companies, and 27 of
Fortune 100 companies2
Notes:
(1) Revenue for the year-ended December 31, 2018.
(2) As of December 31, 2018.
(3) Since the beginning of 2017, the annualized revenue from new sales of our SurveyMonkey Enterprise plan has represented an approximately 4x increase over the total annualized revenue from the individual paid subscriptions from those organizational
domains over the prior 12 month period.
16Financial highlights
Healthy Highly Visible Land and Attractive Strong
Growth Business Model Expand Margins Retention
19% 90%+ 4x 18% 100%+
Revenue growth Subscription Initial increase in Unlevered Dollar-based net
revenue annualized revenue free cash flow retention for
from enterprise upsell1 margin2 organizations3
Note: All amounts for Q4’18 except as noted.
(1) Since the beginning of 2017, the annualized revenue from the initial new sale of our SurveyMonkey Enterprise plan has represented an approximately 4x increase over the total annualized revenue from the individual paid subscriptions from those
organizational domains over the prior 12 month period.
(2) Unlevered free cash flow calculated as net cash provided by operating activities less purchases of property and equipment (net) and capitalized internal-use software, plus interest paid on long-term debt, and adjustments for certain non-recurring items;
see appendix for reconciliation to the corresponding GAAP amount.
(3) We calculate organizational dollar-based net retention rate as of the end of a period by starting with the annualized revenue from the cohort of all domain-based customers as of the 12 months prior to the end of such period, or the Prior Period Annualized
Organizational Revenue. We then calculate the annualized revenue from these same customers as of the end of the current period, or the Current Period Annualized Organizational Revenue. We then divide Current Period Annualized Organizational
Revenue by Prior Period Annualized Organizational Revenue to calculate our organizational dollar-based net retention rate.
17We are driving healthy revenue growth…
Revenue1 ($M) Paying Users (K) 77%
Annual
$254.3
Core revenue
647
Non-self serve Audience $218.8
$214.0
76%
Annual 621
616
610
606
$57.0 $67.9
19% 11% 19% 5% 2% 3% 3% 7%
YoY YoY YoY YoY YoY YoY YoY YoY
Q4'17 Q4'18 FY'17 FY'18 Q4'17 Q1'18 Q2'18 Q3'18 Q4'18
Average Revenue Per User2 Enterprise Sales Customers
$425 3,566
$418 3,226
$410 2,838 2,990
2,758
$390
$375
2.3% 3.0% 3.5%
8% 12% 18% 15% 13% 29%
YoY YoY YoY
3.0% YoY3.5% YoY YoY YoY YoY YoY
YoY YoY
Q4'17 Q1'18 Q2'18 Q3'18 Q4'18 Q4'17 Q1'18 Q2'18 Q3'18 Q4'18
Notes:
(1) YoY growth for FY’17 and FY’18 reflects Core revenue growth. Core revenue is revenue excluding the non-self-serve portion of SurveyMonkey Audience; see appendix for reconciliation to the corresponding GAAP amount.
(2) We define Average Revenue per User (ARPU) as core revenue divided by the average number of paying users during the period. For interim periods, we use annualized core revenue which is calculated by dividing the core revenue for the period by the number of days in that period
and multiplying this value by 365 days. We calculate the average number of paying users by adding the number of paying users as of the end of the prior period to the number of paying users as of the end of the current period, and then dividing by two. 18…with robust cash flow
Cash Flow ($M)
Operating cash flow
$45.0 $45.4 $45.9
Unlevered free cash flow
$37.5
18%
$14.1
$11.4 $11.9
$9.2
25% 16% 17% 18% 21% 17% 18% 18%
Margin Margin Margin Margin Margin Margin Margin Margin
Q4'17 Q4'18 FY'17 FY'18
Note: Unlevered free cash flow calculated as net cash provided by operating activities less purchases of property and
equipment (net) and capitalized internal-use software, plus interest paid on long-term debt, and adjustments for certain non-
recurring items; see appendix for reconciliation to the corresponding GAAP amount.
19Appendix
20Explanation of Non-GAAP Measures
In this presentation, in addition to GAAP financial results, SVMK has included core revenue and unlevered free cash flow which are non-GAAP financial measures. Our definition for
these non-GAAP measures is provided below, however a limitation of non-GAAP financial measures is that they do not have uniform definitions. Accordingly, our definitions for these
non-GAAP measures used will likely differ from similarly titled non-GAAP measures used by other companies, thereby limiting their usefulness as tools of comparison.
We use these non-GAAP measures to compare and evaluate our operating results across periods in order to manage our business, for purposes of determining executive and senior
management incentive compensation, and for budgeting and developing our strategic operating plans. We believe that these non-GAAP measures provide useful information about
our operating results, enhance the overall understanding of our past financial performance and future prospects, and allow for greater transparency with respect to key metrics used
by our management in evaluating our financial performance and for operational decision making, but they are not meant to be considered in isolation or as a substitute for
comparable GAAP measures and should be read only in conjunction with our consolidated financial statements prepared in accordance with GAAP.
Core revenue: We define core revenue as revenue from our survey platform, form-based application and purpose-built solutions, excluding the non-self-serve portion of
SurveyMonkey Audience, which we generally ceased offering at the end of the second quarter of 2017. We consider core revenue to be an important measure because it excludes
revenue from an offering that we generally no longer provide, and so provides a better understanding of our current business and provides comparability of our results of operations
over time. Core revenue has limitations as an analytical tool, and it should not be considered in isolation or as a substitute for analysis of other GAAP financial measures, such as
revenue. Some of the limitations of core revenue are that it does not reflect all of our revenue in the periods presented and that our results of operations for the periods presented
reflect expenses that we incurred to generate revenue that is excluded from core revenue.
Unlevered free cash flow: Unlevered free cash flow is a liquidity measure used by management in evaluating the cash generated by our operations after purchases of property and
equipment and capitalized internal-use software but prior to the impact of our capital structure, the timing of cash payments for certain acquisition and debt related transactions and
employer payroll taxes on Performance RSUs. The usefulness of unlevered free cash flow as an analytical tool is limited because it excludes certain items which are settled in cash,
does not represent residual cash flow available for discretionary expenses, does not reflect our future contractual commitments, and is calculated differently by other companies in
our industry. Accordingly, it should not be considered in isolation or as a substitute for analysis of other GAAP financial measures, such as net cash provided by operating activities.
21Non-GAAP reconciliations
Three Months Ended Dec 31, Year Ended Dec 31,
($000s) 2018 2017 2018 2017
Revenue $ 67,932 $ 57,012 $ 254,324 $ 218,773
Non-self-serve SurveyMonkey Audience revenue - - - (4,789)
Core revenue $ 67,932 $ 57,012 $ 254,324 $ 213,984
Net cash provided by operating activities $ 11,390 $ 14,101 $ 45,372 $ 45,026
Purchases of property and equipment, net (1) (1,170) (6,251) (9,981) (24,128)
Capitalized internal-use software (3,195) (3,548) (12,052) (15,319)
Interest paid for term debt 4,021 4,913 20,466 19,864
Deferred acquisition related payment - - - 7,700
Third-party financing fees related to credit facility refinancing 879 - 879 4,314
(2)
Employer payroll taxes on Performance RSUs - - 1,183 -
Unlevered free cash flow $ 11,925 $ 9,215 $ 45,867 $ 37,457
Notes:
(1) Includes reimbursement of tenant improvement allowances under our lease financing obligation of $79,000 for the three months ended December 31, 2017 and $8.4 million for the year ended December 31, 2017.
(2) Employer payroll tax expense related to the achievement of the liquidity event-related performance condition in connection with our initial public offering for certain restricted stock units that met their service-based vesting condition
as of the end of Q3 2018.
22You can also read