Royal Mail plc Half Year 2017 18 Results - 16 November 2017

Page created by Brett Wheeler
 
CONTINUE READING
Royal Mail plc Half Year 2017 18 Results - 16 November 2017
Royal Mail plc
Half Year 2017‐18 Results

16 November 2017
Royal Mail plc Half Year 2017 18 Results - 16 November 2017
Disclaimer
This presentation contains various statements and graphic representations (together, ‘forward‐looking statements’) that
reflect management's current views and projections with respect to future events and financial and operational
performance. The words ‘target’, ‘objective’, ‘growing’, ‘scope’, ‘platform’, ‘future’, ‘forecast’, ‘expected’, ‘estimated’,
‘accelerating’, ‘expanding’, ‘continuing’, ‘potential’, ‘sustainable’ and similar expressions or variations on such expressions
identify certain of these forward‐looking statements.

Others can be identified from the context in which the statements or graphic representations are made. These
forward‐looking statements, as well as those included in any other material discussed as part of this presentation, involve
known and unknown risks, uncertainties, assumptions, estimates and other factors, which may be beyond Royal Mail
Group's control and which may cause actual results or performance to differ materially from those expressed or implied
from such forward‐looking statements.

All statements (including forward‐looking statements) contained herein are made as of the date of this presentation and
Royal Mail Group disclaims any obligation to update any forward‐looking statements, whether as a result of new
information, future events or results or otherwise. There can be no assurance that forward‐looking statements will prove
to be accurate, as actual results and future events could differ materially from those anticipated in such statements.
Accordingly, readers should not place undue reliance on forward‐looking statements due to the inherent uncertainty
therein.

This presentation does not contain or constitute an invitation, inducement or offer to underwrite, subscribe for, or
otherwise acquire or dispose of any securities or financial instruments or any advice or recommendation with respect to
such securities or other financial instruments.
Royal Mail plc Half Year 2017 18 Results - 16 November 2017
Moya Greene
Chief Executive Officer
Royal Mail plc Half Year 2017 18 Results - 16 November 2017
H1 2017‐18 Results overview
                                               Good UK performance, continued strong GLS performance

                                                                                                                                                                              Underlying
                                                                                                                                                                               change

                                            Revenue                                                                                                            £4,829m           2%
    Royal Mail plc                          Adjusted operating profit before transformation costs                                                               £323m            7%

                                            In‐year trading cash flow                                                                                           £125m            £9m

                                            Interim dividend per share                                                                                             7.7p          4%

                                            Revenue                                                                                                                              Flat
    UKPIL
                                            Adjusted operating profit before transformation costs                                                                                7%

                                            Revenue                                                                                                                              9%

                                            Operating profit                                                                                                                     8%

    Full year outcome dependent on Christmas trading and potential impact of industrial relations environment

3      Note: Adjusted results exclude specific items and the pension charge to cash difference adjustment. Underlying change is calculated after adjusting for working days
       in UKPIL, foreign exchange movements, acquisitions, and other one‐off items that distort the Group’s underlying performance
Royal Mail plc Half Year 2017 18 Results - 16 November 2017
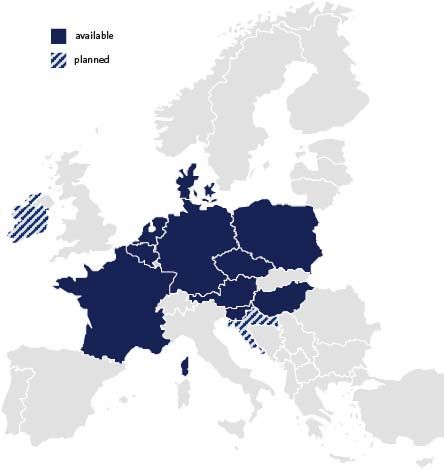
Creating a more resilient company focused on cash generation

                             Growing GLS

                       Leading position in the UK

                  Investment in growth and innovation

                     Strategic focus on UKPIL costs

                      Sustainable cash generation

                      Progressive dividend policy

4
Royal Mail plc Half Year 2017 18 Results - 16 November 2017
Growing GLS
                   H1 2017‐18 Performance                                                   Strategy

                                                             • Establishing strong footprint in local markets
                 Continued strong performance                • Further growth in existing markets as well as geographic expansion
                                                             • Focus on B2B with selective B2C growth
                                                             • Group strategic goals framework for national strategies
    £m                        H1 2017‐18        H1 2016‐17
                                                             • National strategies to:
                                                                    — increase revenues and EBIT
    Revenue                     1,205              942
                                                                    — address specific country requirements
                                                                    — ensure customer proximity
    Operating profit             90                73        • Underpinned by technology

    Operating profit margin     7.5%              7.7%                                 GLS group strategy

                                                                                  Individual country strategies
• Underlying revenue growth of 9%
    – driven by strong revenue growth in Italy, Denmark
      and Poland
• 19% revenue growth including acquisitions

                                                                                     Stable IT infrastructure

5
Royal Mail plc Half Year 2017 18 Results - 16 November 2017
Growing GLS ‐ scale up and grow strategy
                                   Scale up existing businesses in core markets to strengthen market positions
                                    Grow through acquisitions to capture higher growth segments outside EU

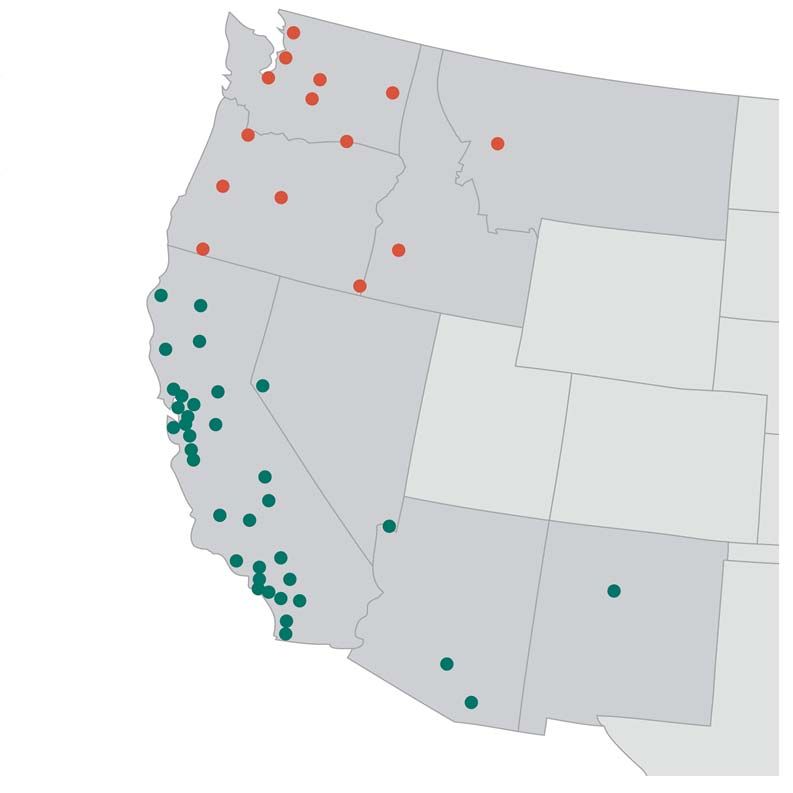
                               GLS Italy                                  GLS Spain                                       USA

        GLS ENTERPRISE        OTHER FRANCHISEES         GLS Spain sites   ASM sites               GSO sites     Postal Express sites

         Acquired franchisees in last two years

                                                     • Acquired express parcels company ASM      • Acquired regional carriers GSO (2016)
        • Expanding network by acquiring               in June 2016                                and Postal Express (April 2017)
          selective franchisees                      • Created Spain‘s second largest domestic   • Creates an overnight parcel service with
                                                       parcel network                              full US West Coast coverage

6   6
Growing GLS ‐ selective B2C growth
                                                European roll‐out of B2C services

              FlexDeliveryService                          ShopReturnService                              ShopDeliveryService
    Available                                  Available                                        Available

    Planned                                                                                     Planned

                                                                                                                    7

                                                                                                                        300       1.200

• Allows recipients to choose when/where   • Allows recipients to drop off returns at GLS   • Consignors can send parcels directly to GLS
  to take delivery of items                  ParcelShops of their choice                      ParcelShops/partner parcel shops
• Available in 19 countries                • Available cross‐border in 7 countries          • Recipients can select parcel shop during
                                                                                              order process

7
Leading position in UK ‐ Parcels
                               Royal Mail Tracked products1 growth                                  H1 2017‐18 Performance

              200
                                                                                    • Total parcel volumes up 6%
                                                                               H1
              180                                                             38%   • Total parcel revenue up 5%
                                                                                    • Account volumes (ex. Amazon) up 4%
              160                                                            36%
                                                                                          — successfully targeting faster growing sectors and
              140
                                                                                            winning volumes
                                                                                    • Royal Mail Tracked 24®/48® and Tracked Returns®
              120                                                                     volume growth outpacing market
Volumes (m)

                                                                       43%                — H1 2017‐18 c.90m items; c.38% growth
              100
                                                                                    • International cross‐border initiative contributed c.2 ppts
               80
                                                                                      volume/c.1 ppt revenue growth
                                                                 16%
                                                                                    • Import (excluding cross‐border initiative) and export
               60                                          42%                        volumes improved

                                            19%
                                                                                    • Parcelforce volumes up 1%
               40
                               32%

               20

                0                                                                      Domestic & international initiatives driving growth
                            2011‐12 2012‐13 2013‐14 2014‐15 2015‐16 2016‐17

                1
  8                 Tracked 24®/48® and Tracked Returns®
Leading position in UK ‐ Parcels
                                                               Growth in online shopping1                                                                                What customers want
                                                                                                                            Overall retail
                                                                                                                             CAGR 2%
                                                                                                                                                                       Larger account customers
                             400               13%               15%               17%                18%               19%
                                                                                                                                                   • Later acceptance times             • In‐flight redirections
                             350                                                                                                  E‐retail
                                                                                                                                 CAGR 7%           • Predicted delivery times           • Reliable service quality
                             300
                                                                                                                                                                           Marketplace sellers
Overall retail value (£bn)

                             250
                                                                                                                                                   • Low prices                         • Simple online shipping
                             200                                                                                                                   • Tracking                           • Reliable service quality

                             150                                                                                                                                           Individual senders

                             100                                                                                                                   • Value for money                    • Convenient access points
                                                                                                                                                   • Reliable service quality
                                 50

                                                                                                                                                                           Receiving customers
                                  0
                                              2014               2016             2018e             2020e              2022e                       • Control of deliveries:
                                                              E‐retail as % of
                                                                                         Overall
                                                                                         Store   Retail
                                                                                               retail          E‐retail                                       — tracking
                                                              overall retail
                                                                                                                                                              — delivery timeslots
                                                                                                                                                              — in‐flight redirection

                             9        1
                                          Source: Global Data (Verdict) E‐retail in the UK 2017‐2022, projected value e‐retail growth vs. overall retail, 2016‐2022
Leading position in UK ‐ Letters
                         Maximising the value of letters                                                                H1 2017‐18 Performance

                               Protecting mail volumes
                                                                                                        • Resilient performance despite business uncertainty
                                                                                                        • Addressed letter volumes down 5% (ex. political parties’
                                    • Introduced incentives for                                           election mailings)
                                      incremental advertising
                                      mail                                                              • Total letter revenue down 3%
                                                                                                              — better than expected revenue from 2017
                                                                                                                General Election mailings
                                Maximise profitability
                                                                                                        • Marketing mail1 revenue of £534m, down 2%
                                                                                                        • Unaddressed volumes up 8%
                                    • Enhanced revenue protection
                                      measures                                                          • Addressed letter volume decline expected to be at
                                    • Targeted pricing initiatives to drive                               higher end of ‐4% to ‐6% range in 2017‐18 if current
                                      incremental volume/profit                                           levels of business uncertainty persist

                         Optimise customer experience

                                    • Commencing Mailmark® roll‐
                                      out to unsorted mail

10   1
         Includes redirections, Address Management Unit, and addressed & unaddressed advertising mail
Investment in growth and innovation
                                  Meeting customer expectations for convenience, flexibility and quality

                                                                     Leveraging technology

                                                       Apr 2017                                    Sep 2017
                                      Apr 2017          Leading                                    Launched
                                      Delivery                             Aug 2017                                     Oct 2017        Oct 2017
          Apr 2017                                   e‐commerce              NOTHS                Parcelforce           Launched     Started piloting
         Labels to Go               confirmation    web platforms                               1‐hour delivery
                                    available for                       integrates with                                Parcelforce      estimated
          launched                                 integrated with        Click & Drop              timeslot             app for      delivery times
                                     majority of     Click & Drop                               notification and
                                  barcoded parcels                                                                      receiving
                                                                                                 My Parcel Live        customers

  Mar 2017                                                     Aug 2017                Sep 2017                Sep 2017                     More PDA
                            Apr 2017
Core network                                                    Started                RMSS PDA             3 more parcel                  functionality
                           Credit card
 PDA rollout                                                   deploying           rollout complete        sorting machines
                        payments taken
  complete                                                 electric vehicles                                   deployed
                          in Customer
                         Service Points                       in network
                                                                                                                                                             Further
                                                                                                                                                           extension of
                                                                                                                                                           LATs within
                                                                                                                                                             network

                                                               Operational improvements

11
Strategic focus on UKPIL costs
                                                       Maintain target to deliver c.£190m costs avoided in 2017‐18

                                Good cost performance in H1; challenges in H2 due to industrial relations environment

            Collections                              Processing                                  Logistics                                Delivery             Central functions

                                                                      2013‐14                         2014‐15                         2015‐16        2016‐17           Target

     Gross core network hours                                           (2.9%)                         (2.3%)                         (2.0%)         (1.9%)

     Workload                                                           (1.3%)                          0.1%                           0.4%           0.7%

     Productivity1                                                       1.7%                           2.5%                           2.4%           2.7%            2.0‐3.0%

                                                  Maintain target to avoid c.£600m of annualised costs by 2017‐182

12     1   Collections, processing and delivery in core network only 2 Cumulative over financial years 2015‐16, 2016‐17 and 2017‐18
Stuart Simpson
Chief Finance Officer
H1 2017‐18 Financial summary
                                                      Adjusted   Adjusted Underlying                                                                                          H1 2017‐18
 £m                                                                                                                         £m
                                                     H1 2017‐18 H1 2016‐17 change                                                                                         Reported   Adjusted
 Revenue                                                 4,829                  4,583                   2%                  Operating profit
                                                                                                                                                                            89         323
                                                                                                                            before transformation costs
 Operating profit
                                                           323                   320                    7%                  Profit before tax                               77         250
 before transformation costs
 Transformation costs                                      (63)                  (58)                                       Profit after tax                                168        198

 Operating profit                                                                                                           Earnings per share (basic)                     17.1p      20.1p
                                                           260                   262
 after transformation costs
 Operating profit margin
                                                          5.4%                  5.7%                +30bps                  • IAS 19 pension charge to cash adjustment
 after transformation costs
                                                                                                                              £234m (H1 2016‐17: £114m)
 Profit before tax                                         250                   252
                                                                                                                                       — estimated at c.£450m for full year
 Earnings per share (basic)                              20.1p                  19.2p                 +0.9p
                                                                                                                            • Reported results impacted by increase in
 In‐year trading cash flow                                 125                   116                                          pension service cost, specific items and tax
                                                                                                                              credit arising from pension accounting
 Net debt                                                (382)                  (452)
                                                                                                                            • Interim dividend based on formula, one third of
 Interim dividend per share                               7.7p                   7.4p                   4%                    prior year full year dividend

14    Note: Adjusted results exclude specific items and are after the pension charge to cash difference adjustment. Underlying change is calculated after adjusting for
      working days in UKPIL, foreign exchange movements, acquisitions, and other one‐off items that distort the Group’s underlying performance
Underlying movement in operating profit                                                                                                                                     7%
 £m
 350
                                            19                                                                                                                              22
                                                                      10                        7                         3
 300

                  320                                                                                                                                                                     323
 250                                                                                                                                                                       [XXX]

 200
            H1 2016‐17                   Working              Apprenticeship                 FX                     Impact of                H1 2016‐17                Underlying     H1 2017‐18
             Adjusted                     days                    Levy                 (GLS and UKPIL)             acquisitions              Underlying               performance      Adjusted
          operating profit                                                                                                                                                          operating profit
              before                                                                                                                                                                    before
          transformation                                                                                                                                                            transformation
               costs                                                                                                                                                                     costs

• (£19m) impact in UKPIL due to c.1 less working day (H1 2017‐18: 152 working days; H1 2016‐17: 152.8 working days)
     — estimated impact c.(£15m) in FY 2017‐18 due to c.1 less working day
• Estimated c.£20m full year impact of Apprenticeship Levy
• Net £7m positive impact on Group due to weaker Sterling
     — average rate £1 = €1.14 (H1 2016‐17: £1 = €1.23)
     — £78m positive revenue impact offset by £71m negative cost impact, mostly due to GLS
• £3m contribution from recent GLS acquisitions
• 7% increase in adjusted operating profit before transformation costs

15     Note: Adjusted results exclude specific items and are after the pension charge to cash difference adjustment. Underlying change is calculated after adjusting for
       working days in UKPIL, foreign exchange movements, acquisitions, and other one‐off items that distort the Group’s underlying performance
UKPIL results
                                                                                                                   Adjusted                               Adjusted            Underlying
     £m
                                                                                                                  H1 2017‐18                             H1 2016‐17            change

     Revenue                                                                                                          3,624                                  3,641               Flat

     Operating costs                                                                                                (3,391)                                (3,394)              (1%)

     Operating profit before transformation costs                                                                       233                                   247                7%

     Transformation costs                                                                                              (63)                                   (58)

     Operating profit after transformation costs                                                                        170                                   189                6%

     Operating profit margin after transformation costs                                                               4.7%                                   5.2%              +30bps

     £m                                              H1 2017‐18                     H1 2016‐17                         • Transformation costs reflect activities under cost avoidance
                                                                                                                         programme
     Voluntary redundancy                                  (31)                          (26)                                     — increase in VR reflects managerial headcount
                                                                                                                                    reduction
     Project costs                                         (32)                          (32)
                                                                                                                       • Ongoing transformation costs expected to be c.£130‐150m p.a.
     Total transformation costs                            (63)                          (58)                            dependent on absorbable rate of change

16        Note: Adjusted results exclude specific items and are after the pension charge to cash difference adjustment. Underlying change is calculated after adjusting for
          working days, foreign exchange movements, acquisitions and other one‐off items that distort the underlying performance
UKPIL revenue                                                                                                                                                                 (3%)
                                                                                                                5%
  £m
3,800                                                                                                                                                   29                         4                           97
                                                                                                                             95
                                               19                         5                        26
3,600

                                                                                                  (1%)                       6%                                     2%                                    (5%)
3,400
                                                                                                                                                     3,696                      3,721
                  3,641                      3,622                     3,627                     3,601                     3,601                                                                          3,624       3,624
3,200                                                                                                                                                  Flat

3,000
              H1 2016‐17                   Working                       FX              Parcel price and                  Parcel             Letter price and                 Other¹                 Addressed     H1 2017‐18
                                            days                                               mix                        volume                    mix                                             letter volume

  Parcels – Revenue £1,596m, Volumes 563m                                                                                         Letters – Revenue £2,028m, Volumes2 5,610m
  • Excluding new cross‐border initiative – volumes up c.4%, revenue up                                                           • Addressed letter volume decline of 5%
    c.4%
                                                                                                                                             — lapping weak Q2 in prior period
               — mix offsets pricing impacts
                                                                                                                                  • Marketing mail3 revenue down 2%
  • Account volumes (ex. Amazon) continue to grow, up 4%
                                                                                                                                             — rate of decline moderating, lapping higher rate of decline in
  • Strong growth in letter‐boxable parcels from Amazon                                                                                        prior period
  • International traffic                                                                                                         • Lower AUR unaddressed letter volumes up 8%
         — growth in import volumes (including cross‐border)                                                                                 — reflecting initiatives in this segment
         — improved contract export volumes
  • Parcelforce continued improvement in volume trend, up 1%

        Note: Underlying change is calculated after adjusting for working days, foreign exchange movements, acquisitions and other one‐off items that distort the Group’s underlying performance. For
 17     volumes, underlying movements are adjusted for working days, acquisitions and exclude political parties’ election mailings in letter volumes 1 Includes elections, philatelic, unaddressed and other
        non‐volume related items 2 Total addressed letter volumes including elections 3 Includes redirections, Address Management Unit, and addressed & unaddressed advertising mail
UKPIL operating costs
                                                             Operating costs before transformation costs down 1%

   £m                                                                                                           People costs flat
3,450
                                                                                  18
                                                                                                                • Assumption for pay award as not yet agreed
                                 10               5
3,400                                                                                                                 — H2 2017‐18 will reflect status of wage negotiations
3,350
                                                                                                                          with any true up/down as required
                                                                                 (1%)
                                                                                                                • Offset by:
3,300          3,394                                                                             3,391                — productivity improvement
3,250                                                                                                                 — managerial headcount reduction
3,200
            H1 2016‐17 Apprenticeship             FX         H1 2016‐17 Net underlying H1 2017‐18
             Adjusted      Levy                              Underlying performance     Adjusted
                                                                                                                Non‐people costs down 2%
                                                                                                                • Terminal dues up £5m due to Sterling weakness (D&C)
                                                 Adjusted           Adjusted            Underlying              • Fleet and fuel cost savings (D&C)
 £m                                             H1 2017‐18         H1 2016‐17            change
                                                                                                                • £20m increase in depreciation & amortisation (infrastructure)
 People costs                                      2,362               2,351                 Flat                     — includes £5m one‐off accelerated depreciation of
 Non‐people costs                                  1,029               1,043                 (2%)                         certain IT/other assets
                                                                                                                      — depreciation & amortisation expected to be c.£35m
 Distribution & conveyance costs                       361              370                  (4%)
                                                                                                                          higher for 2017‐18
 Infrastructure costs                                  365              360                  1%
                                                                                                                • Benefits from Romec integration, IT transformation
 Other operating costs                                 303              313                  (3%)
                                                                                                                  and lower property spend (infrastructure)
                                                                                                                • Lower marketing and discretionary spend (other)
 Operating costs                                   3,391               3,394                 (1%)
                                                                                                                • Savings on certain supplier contracts (other)

18      Note: Adjusted results exclude specific items and the pension charge to cash difference adjustment. Underlying change is calculated after adjusting for foreign
        exchange movements, acquisitions and other one‐off items that distort the Group’s underlying performance
UKPIL H2 2017‐18 performance
                                              Significant headwinds remain in H2 2017‐18

£m

                                   `

            233                   233

         H1 2017‐18           Costs avoided      Commercial pressures   People cost pressures   Non‐people cost pressures           H2 2017‐18
  Adjusted operating profit                                                                                                  Adjusted operating profit
 before tranformation costs                                                                                                 before tranformation costs

• Costs avoided                                                         • People cost pressures
      — on track to deliver c.£190m costs avoided but                        — outcome of pay negotiations
          skewed to H1 due to timing of projects                             — impact of managers pay award from September
      — potential impact of industrial relations
          environment on pace of change
• Commercial pressures                                                  • Non‐people cost pressures
     — potential customer reaction to industrial                             — cost of sales weighted to H2 due to Christmas
       relations environment                                                 — costs associated with parcel initiatives and
     — continuing business uncertainty                                          increased tracked/volumetrics

19
GLS results
                                                             H1                     H1                Underlying               • Performance largely driven by good
 £m                                                                                                                              volume growth – domestic and
                                                           2017‐18                2016‐17              change
                                                                                                                                 international
 Revenue                                                     1,205                   942                    9%
                                                                                                                                         — timing of holidays across Europe
 Operating costs                                            (1,115)                 (869)                   9%                             reduced underlying volumes and
                                                                                                                                           revenue movements by c.3ppts
 Operating profit                                               90                    73                    8%
                                                                                                                               • Margin impacted by increased people
 Operating profit margin                                      7.5%                  7.7%                 (10bps)                 and distribution & conveyance costs

 Volumes (m)                                                   276                   233                    9%                 • ASM exceeded performance
                                                                                                                                 expectations since acquisition
 Average £1 = €                                               1.14                   1.23                  (7%)                • Reported Sterling results positively
                                                                                                                                 impacted by 7% weakening of Sterling
                                                             H1                     H1                                           vs. Euro
     €m
                                                           2017‐18                2016‐17
 Revenue                                                     1,371                  1,155

 Operating costs                                            (1,269)                (1,066)

 Operating profit                                              102                    89

      Note: Movements in revenue, volume and costs are on an underlying basis. Underlying change is calculated after adjusting for ASM, GSO and Postal Express
20
      acquisitions (21m volumes; £89m revenue; £86m costs; £3m operating profit) and foreign exchange movements (£73m revenue; £66m costs; £7m operating profit)
GLS revenue
     £m
1,400                                                                                                                                                      9%

                                                                                                                                                                         97
1,200
                                                                                    73                                                        4
                                                       89
1,000                                                                                                                                       Flat                         9%

                                                                                                                                                                                      1,205
                                                                                                                                             [X]                        1,108
     800
                         942                          942

     600
                    H1 2016‐17                   Acquisitions                      FX                      Underlying                      Price                       Volume       H1 2017‐18
                                                                                                                                          and mix

• Underlying revenue up 9%                                                                                      • Germany up 5%, driven by international volumes and improved
               — timing of holidays across Europe adversely impacted                                              domestic pricing
                 volumes/revenue by c.3ppts                                                                     • Continued strong growth in Italy, up 18% mainly due to strong
                                                                                                                  B2C volume growth
• Headline revenue up 19% in Euros including acquisitions
                                                                                                                          — growth rate expected to slow going forward
• Germany, Italy and France account for 60% of GLS Group revenue,
  reflecting impact of acquisitions                                                                             • France growth slowed, up 1%, due to impact of working days
                                                                                                                  and lower export volumes
• Largest customer represents c.3% of GLS Group revenue
                                                                                                                          — break‐even unlikely in short‐term

           Note: Movements in revenue, volumes and costs are on an underlying basis. Underlying change is calculated after adjusting for ASM, GSO and Postal Express acquisitions
21
           and foreign exchange movements
GLS costs
                                                                H1                     H1                 Underlying               People costs up 10% due to:
 £m
                                                              2017‐18                2016‐17               change                            —      semi‐variable costs       c.6%
                                                                                                                                                    linked to volume
 People costs                                                    293                     209                    10%
                                                                                                                                             —      pay inflation             c.4%
 Distribution &
                                                                 725                     575                    11%
 conveyance costs                                                                                                                  Non‐people costs up 9%

 Infrastructure costs                                              71                     57                     6%                • Distribution & conveyance costs up
                                                                                                                                     11% due to higher volumes and increased
                                                                                                                                     sub‐contractor costs
 Other operating costs                                             26                     28                  (24%)
                                                                                                                                             —      €2.5m impact of new German
 Operating costs                                                1,115                    869                     9%                                 minimum wage from January
                                                                                                                                                    2017
                                                                                                                                             —      estimated 12 month impact €5m

                                                                                                                                   • Infrastructure costs up 6% due to one‐off
                                                                                                                                     provision release for IT‐related costs in
                                                                                                                                     prior period

                                                                                                                                   • Other operating costs down by 24%
                                                                                                                                     driven by one‐off provision release this
                                                                                                                                     year and costs associated with geographic
                                                                                                                                     expansion activities last year

      Note: Movements in revenue, volume and costs are on an underlying basis. Underlying change is calculated after adjusting for ASM, GSO and Postal Express acquisitions
22
      (£86m) and foreign exchange movements (£66m)
Group in‐year trading cash flow
                                                                   • Higher adjusted EBITDA before transformation
                                                 H1        H1        costs
 £m
                                               2017‐18   2016‐17
                                                                   • Trading working capital
Reported EBITDA before transformation costs     255       352
                                                                          — no outflow for pay award

Pension charge to cash difference adjustment    234       114             — timing of international settlements

                                                                   • Investment on track ‐ total net cash
Adjusted EBITDA before transformation costs     489       466        investment target for 2017‐18 of c.£450m

Trading working capital movements               (130)     (127)                                     H1        H1
                                                                     £m
                                                                                                  2017‐18   2016‐17
Share‐based awards (SAYE/LTIP/DSBP) charge       1         6
                                                                     Transformation opex           (59)      (60)

Total investment                                (198)     (201)      Replacement capex             (53)      (61)
                                                                     Growth capex                  (86)      (80)
Income tax paid                                 (24)      (16)       Total investment              (198)     (201)
                                                                     Operational asset
Net finance costs paid                          (13)      (12)                                      29          7
                                                                     disposals

In‐year trading cash flow                       125       116        Net investment                (169)     (194)

                                                                   • Higher cash tax due to GLS

23
Uses of cash/net debt
                                                                                         £44m

 £m
                                                                       £115m
(500)

(400)                                                                                                                                          154
                              125
(300)
                                                19               8                29                               4               5
                                                                                                   8
(200)                                                                                                                                                          (382)
             (338)
(100)

   0
          Net debt at    In‐year trading   Other working     Operating       Operational      Acquisition of London property      FX       Dividends paid    Net debt at
         26 March 2017     cash inflow        capital      specific items   asset disposals     business        cash flows     movements                    24 September
                                            movements                                           interests                                                       2017

    • Free cash flow of £115m
    • Other working capital movements include stamps used but purchased in previous periods, GLS client cash held and other deferred revenue
    • Operating specific items are largely additional employer National Insurance contributions on Employee Free Share sales and Romec business
      integration costs
    • Operational asset disposals largely relate to the £24m overage payment from the sale of Rathbone Place in 2011
    • Acquisition of business interests relates to the purchase of Postal Express by GLS
    • London property cash flows ‐ £9.5m deposit received on exchange of contracts for sale of Mount Pleasant plots net of £14m re‐investment
    • Foreign exchange movements reflect impact of translation on Euro bond, GLS cash, lease creditors and other loans
    • Net debt increased by £44m from year end

    24
Property
     Site              Acres                            Key features                                            Status
 Nine Elms             13.9              • Outline planning consent for 1,950         • Two plots sold for £101m conditional on obtaining
                                           residential units                            detailed planning consent
                                         • Core infrastructure works underway on             — due to timing on obtaining planning consent,
                                           site                                                proceeds now expected in 2018‐19
                                                                                             — c.£30m to be re‐invested in infrastructure
                                                                                               associated with sold plots
                                                                                      • Five plots continue to be marketed
                                                                                      • Delivery Office transferred to new site in Aug 2017
                                                                                      • Further investment required (infrastructure, park) for
                                                                                        remaining plots when sold
 Mount                8.6 acres          • Full planning permission in place for up   • 6.25 acres sold for £193.5m in Aug 2017 – of which
 Pleasant            covered by            to c.680 residential units                   £9.5m deposit received; remaining £180.5m cash to be
                  planning consent       • Separation works now commenced               paid in staged payments over 2017‐18 to 2020‐21 and
                   (of which 6.25                                                       final lump sum payments in 2024
                     acres sold)                                                      • Separation and enabling works expected to cost c.£100m

                               2014‐15        2015‐16      2016‐17      H1 2017‐18     2017‐18

 Total proceeds                 111              ‐            ‐             10         Sales proceeds received (Nine Elms in 2018‐19)
 Total investment               (11)            (23)         (34)          (14)        Further investment
 Net cash position              100             (23)         (34)           (4)

 Cumulative                     100             77           43             39

25
Royal Mail Pension Plan (RMPP) update
                                         IAS 19 Accounting                             Actuarial1     • Liabilities projected to accrue to March
£m                                                                                                      2018 have been hedged in advance against
                                        24 September 2017                         30 September 2017
                                                                                                        movements in interest and inflation rates
Assets                                              9,380                               9,303
                                                                                                      • RMPP will close to future accrual after 31
                                                                                                        March 2018
Liabilities                                        (5,982)                             (8,533)
                                                                                                      • Plan now expected to close with small
Surplus                                             3,398                               770             surplus1
                                                                                                      • Remaining employer contributions up to
IFRIC 14 adjustment                                (1,111)                                              31 March 2018 to be held in pension
                                                                                                        escrow investments
Post IFRIC 14 surplus                               2,287                                             • Accounting impact of closing scheme
                                                                                                            — reduction in deferred tax liability
                                                                                                            — P&L tax credit in period
                                                                                                            — IFRIC 14 adjustment to surplus
                                                                                                      • Discussion with Unions over future
                                                                                                        benefits post March 2018 continue

26   ¹ Based on roll forward of RMPP March 2015 triennial valuation assumptions
Moya Greene
Chief Executive Officer
Outlook
                                    Good H1 performance

     Medium‐term addressed letter volume decline of 4‐6% p.a. ‐ outlook unchanged but closely
                  monitoring impact of business uncertainty on letter volumes

                         UK parcels market remains highly competitive

                   UKPIL cost avoidance programme on track, skewed to H1

           GLS underlying revenue growth for FY 2017‐18 broadly in line with H1 2017‐18

                                      Headwinds in H2
                               Continuing business uncertainty
                        Potential impact of industrial relations environment

28
29
You can also read