2021 half year results presentation - 18 August 2021 - Balfour Beatty
←
→
Page content transcription
If your browser does not render page correctly, please read the page content below
2021 half year results
presentation

18 August 2021

Image: London Underground Track Renewals
Leo Quinn
Group Chief Executive

Image: Automated People Mover, Los Angeles International Airport (LAX)
Headlines

    High quality order book underpinned by strong infrastructure markets

    Expert capability for sustainable infrastructure growth supported by Group-wide Sustainability Strategy

    £1.1 billion Investments portfolio with growing US P3 pipeline

    Support Services transformation delivering outperformance

    UK Construction: infrastructure building momentum; exiting central London residential property market

                              [ Consistent, strong cash performance ]
2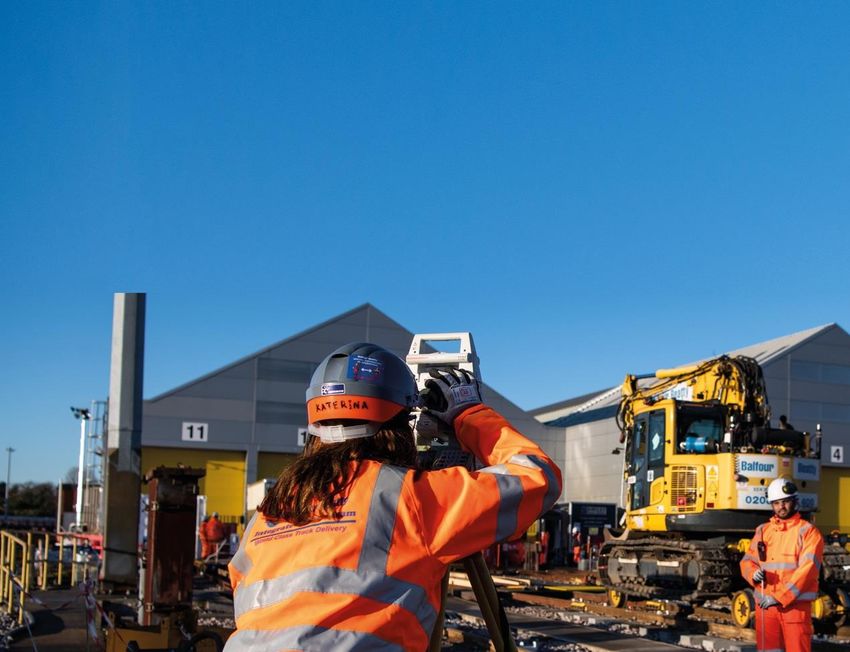
Group net cash
            £800m
                                                                                    £527m*   £611m*

            £600m                                                      £325m*

                                                         £194m*
            £400m                           £42m*
Net cash

                               £(46)m*
            £200m

              £0m

           £(200)m

           £(400)m
                                2016         2017          2018         2019          2020   HY 2021
*Average    monthly net cash

                                [ Strong cash generation underpins shareholder returns ]
3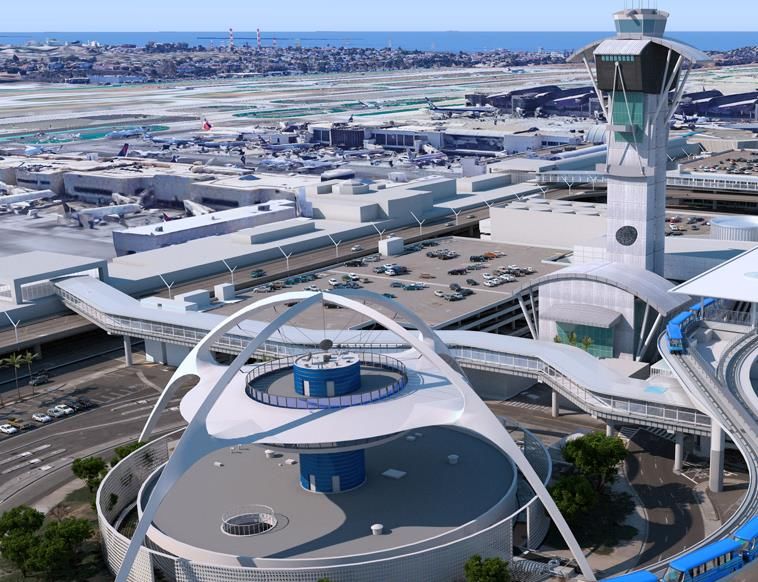
Build to Last transformation
Average net cash/(debt)                                                                                               Earnings-based businesses profit/(loss) from operations*
£m                                                                                                                    £m

         (16)                             290                                       611                                         (180)                                63                                       60

    HY 2015                              HY 2019                                       HY 2021                             HY 2015                               HY 2019                                  HY 2021

Other net operating expenses*                                                                                         UK voluntary attrition: moving annual average
£m                                                                                                                    %

          209                                                 134                                      105
                                                                                                                             15%                                              11%                                     10%

            HY 2015^                                        HY 2019^                              HY 2021                       HY 2015                                       HY 2019                            HY 2021∞
*   from continuing operations, before non-underlying items | ^ HY 2015 and HY 2019 other net operating expenses are calculated on a Constant Exchange Rate (CER) basis | ∞excluding Gas and Water employees following exit from sector

                                      [ Operational platform for sustainable future performance ]
4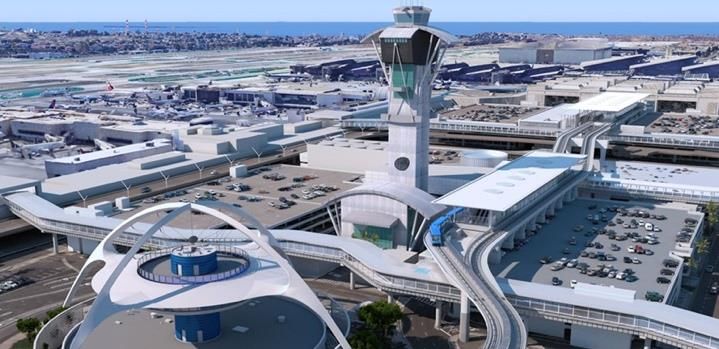
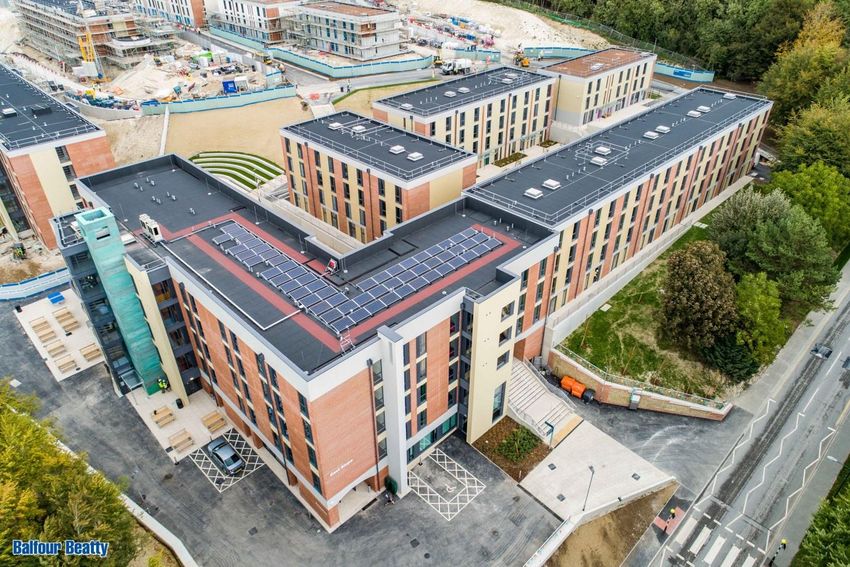
Phil Harrison
Chief Financial Officer

Image: University of Sussex, East Slope Student Accommodation
Headline numbers
£m (unless otherwise stated)                                                        HY 2021     HY 2020      HY 2019
Revenue*                                                                               4,154         4,115     3,881
Profit / (loss) from operations*                                                         60           (14)        72
Pre-tax profit / (loss)*                                                                 55           (24)        64
Profit / (loss) for the period*                                                          51           (18)        54
Basic earnings / (loss) per share*                                                      7.7p      (2.5)p        7.6p
Dividends per share                                                                     3.0p             -      2.1p

                                                                                    HY 2021     FY 2020      HY 2020
Order book*                                                                          £16.1bn    £16.4bn      £17.5bn
Directors’ valuation of Investments portfolio                                        £1.08bn    £1.09bn      £1.13bn
Period end net cash≠                                                                    625           581        563
Average net cash≠                                                                       611           527        507
* before   non-underlying items
≠ excluding   infrastructure investments (non-recourse) net borrowings

                                            [ Balance sheet strength to make the right decisions ]
6
Underlying profit from operations
£m                                                                      HY 2021*   HY 2020*   HY 2019*
     UK Construction                                                        (23)       (23)        17
     US Construction                                                         20          6         19
     Gammon                                                                    9         6          9
Construction Services                                                          6       (11)        45
Support Services                                                             54         10         18
Earnings-based businesses                                                    60         (1)        63
Infrastructure Investments
     Pre-disposals operating profit                                            8         3          9
     Gain on disposals                                                         7          -        16
Corporate activities                                                        (15)       (16)       (16)
Total                                                                        60        (14)        72
* before   non-underlying items

                                      [ Significant recovery in profitability ]
7
Construction Services
£m                                        HY 2021*               HY 2020*               HY 2019*

                                  Revenue       PFO      Revenue       PFO      Revenue       PFO
                                                                                                       Good performance at US
UK                                 1,262        (23)       986         (23)      1,014         17      Construction and Gammon – 2021
US                                 1,697         20       1,911             6    1,727         19      PFO at, or above, 2019
                                                                                                       Key UK infrastructure projects
Gammon                              377              9     468              6     380              9
                                                                                                       (HS2, Hinkley, Highways) continue
Total                              3,336             6    3,365        (11)      3,121         45      to perform well
*   before non-underlying items                                                                        90% of UK Construction revenue
                                                                                                       from public sector and regulated
                                                                                                       industry clients
                                                                                                       UK Construction negatively
                                                                                                       impacted by private sector property
                                                                                                       projects in central London

                                                [ Focused on public sector infrastructure ]
8
Support Services
£m                                      HY 2021*   HY 2020*   HY 2019*

Revenue
                                                                           Support Services characterised by
       Utilities                            258        258        276      profitable recurring revenues
                                                                           underpinned by long-term
       Transportation                       297        218        227      contracts
Total                                       555        476        503      Power, road and rail maintenance
                                                                           contracts all performing strongly
                                                                           Outperformance is a result of:
Profit from          operations*             54         10         18      ̶ end of contract gains
*   before non-underlying items
                                                                           ̶ exit from gas and water sector

                                                                           Robust order book and positive
                                                                           market outlook leads to raising of
                                                                           margin target range from
                                                                           3-5% to 6-8%

                                   [ Raised Support Services margin targets ]
9
Infrastructure Investments
£m HY 2021* HY 2020* HY 2019*
Pre-disposals operating profit* 8 3 9
Re-commenced disposals
Gain on disposals* 7 - 16 from portfolio:
Investments profit* 15 3 25 ̶ sold Canadian hospital project
for £20 million in June
Subordinated debt interest receivable ^ 3 9 13
̶ sold bundle of UK PPP assets
Infrastructure concessions’ net interest (3) (2) (3) for £48 million subsequent to
period end
Investments pre-tax profit* 15 10 35
*
Demand for high-quality
before non-underlying items
^ includes £9m impairment to subordinated debt receivable in HY 2021
infrastructure assets expected to
exceed supply
Continue to seek resolution on US
DoJ military housing investigation
[ High demand for quality infrastructure assets ]
10Directors’ valuation of Investments portfolio
£8m £41m
£(32)m £(20)m £(4)m
£1,086m £1,079m
FY 2020 Equity Distributions Sales Unwind of Other* HY 2021
invested received proceeds discount
* other includes gains on sale £3m, new project wins £2m, movements in operational performance £(2)m and foreign exchange £(7 )m
[ Directors’ valuation stable at £1.1 billion ]
11Cash flow waterfall
£123m
£12m
£64m £20m £7m
£(29)m
£(32)m £(16)m
£(97)m £(8)m
£581m £625m
FY 2020 Operating Working Pension Lease Dividends Capital Share Disposal Equity Other HY 2021
cash flows capital cash deficit payments from JVAs expenditure buybacks proceeds invested
flows payments*
* includes £1m of regular funding
[ Consistent, strong cash performance ]
12Capital allocation framework
Continued Active Strong Sustainable Additional
investment in realisation of but efficient ordinary dividend cash returns
organic growth the Investments balance (40% payout via share
opportunities portfolio sheet ratio^) buybacks
Investments meet Disposals timed to Platform Increasing earnings Broadly based on
Group hurdle rates optimise value to make long-term to drive dividend surplus cash from
decisions growth Investments
disposals and
operating cash flows
^ underlying profit after tax excluding gain on disposals of Investments assets
[ Significant capacity for attractive shareholder returns ]
13Shareholder returns
Profitable managed Multi-year share
Sustainable dividend buyback programme
growth
2021 PFO from earnings-based 40% ordinary dividend £150 million share buyback
businesses in line with 2019 pay-out ratio^ programme commenced in 2021
Raising Support Services PFO 2021 interim dividend 43% higher Purchased £99 million of shares
margin target from 3-5% to 6-8% than pre-pandemic (HY 2019) in the first half of the year
Increased Group PFO Sustainable dividend expected to Re-commenced Investments sales
expectations for 2022 grow with underlying profit (c. £70 million year to date)
^ underlying profit after tax excluding gain on disposals of Investments assets
[ Attractive cash generation and returns ]
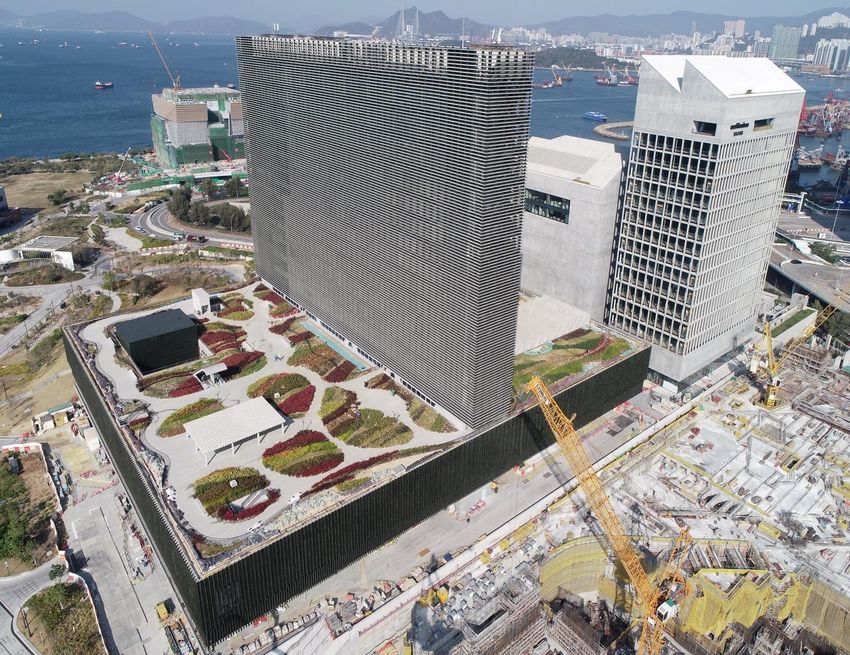
14Leo Quinn Group Chief Executive Image: M+ Museum, West Kowloon, Hong Kong
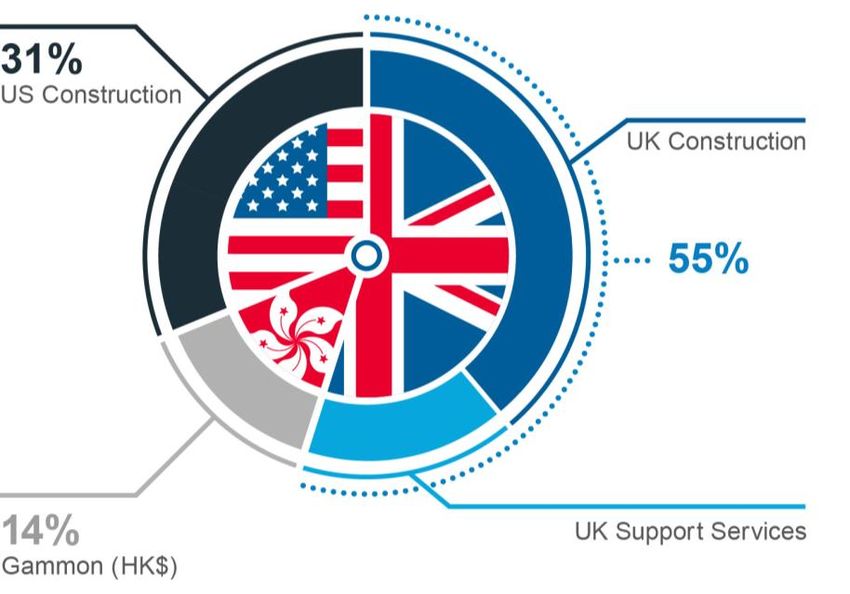
Diversified Group
£16.1bn order book                           £1.1bn* Investments portfolio

                                             *   Directors’ valuation

              [ Geographically and operationally diversified portfolio ]
16
Higher quality, lower risk order book
UK Construction Support Services US Construction Gammon
£6.2bn £2.6bn £5.0bn £2.3bn
⚫ Public & regulated (90%) ⚫ Public & regulated (100%) ⚫ Public & regulated (56%) ⚫ Public & regulated (77%)
⚫ Private sector ⚫ Private sector ⚫ Private sector ⚫ Private sector
Balfour Beatty well placed to benefit Construction Management Fee
from Construction Playbook model significantly reduces price risk
[ Public and regulated clients represent around 80% of order book ]
17Growing markets map to Group capabilities
US Construction UK Construction Gammon
(Hong Kong)
$450bn Public sector construction (US$) £30bn Infrastructure construction (GBP) $110bn Public sector construction (HK$)
$410bn
$370bn £25bn $90bn
$330bn £20bn $70bn
$290bn
$250bn £15bn $50bn
2010 2013 2016 2019 2022 2025 2010 2013 2016 2019 2022 2025 2010 2013 2016 2019 2022 2025
Make economy more resilient, clean and just Driving recovery and rebuilding of economy Enhance quality of life
Clean transportation infrastructure Levelling up Green transport; energy efficiency in buildings
Resilience to the changing climate Decarbonising the economy Decarbonisation technology
Public private investment Supporting private investment in infrastructure Public private partnerships
Biden’s US$1tn Infrastructure Johnson’s £640bn National Lam’s Climate Action
Investment and Jobs Act Infrastructure Strategy Plan 2030+
Sources: Oxford Economics, US Census Bureau Sources: Construction Products Association, Experian Source: Construction Industry Council
[ Infrastructure growth in chosen markets ]
18Building New Futures
Group-wide Sustainability Strategy CO2 emissions (tonnes per £m revenue)
Environment Materials Communities
2040
Ambitions
Beyond Net
Zero Carbon
Generate
Zero Waste
Positively Impact
More than
1 Million People 45
35 25 19
Achieve 40% reduction £3bn
2030 science-based carbon in waste social value
Targets reduction target generated generated
FY 2015 FY 2018 FY 2020
Sustainability in action 2021 achievements
HS2: Retrofit exhaust technology to reduce emissions Signatory of UN Race To Zero campaign
University of Strathclyde: Repurposed existing building frame,
Launch of UK addendum to Group-wide Sustainability Strategy
leading to a 67% saving in embodied carbon
Scottish Hydro Electric Transmission: Delivering sustainable Included in FT Europe’s Climate Leaders 2021 list
wind power to the national grid
Over 750 sustainability ideas from My Contribution campaign
Hinkley Point C: Enabling secure, low carbon electricity to
around six million homes
[ Expert capability to deliver a net zero world ]
19Support Services
Power Rail Maintenance Road Maintenance Gas & Water
Proposed RIIO2 (2021-26) Rail infrastructure Local authority road
spend: spend: maintenance:
£53bn £2.5bn of additional
£30bn investment in
CP6+TfW (2019-24) funding over the next
energy networks
five years
Eight year framework
Potential £10bn+ £700m of outsourced
£38bn contracts coming to Onerous terms and conditions
investment for green CP5 (2014-19) market in next four
energy projects years Unfavourable working capital
Non-core business
Source: Ofgem Source: Network Rail and TfW Source Department of Transport
Joint Power and Rail Eleclink project: testing complete
[ Profitable recurring revenues underpinned by long-term contracts ]
20UK Construction
Central London
Major Projects Highways Regional residential
£2bn SCAPE
£100bn High Speed 2 Civil Engineering
framework
£27bn
Write-downs on a small number
RIS2 (2020-25) Crown Commercial
£23bn New nuclear of private sector property projects
Service (e.g. COVID- caused by lengthening schedules
power station
19 mega lab)
Initially COVID-19 shutdown
£15bn
RIS1 (2015-20) Subsequent performance issues
£3.7bn Health
£4bn London Stress on client funding
Infrastructure Plan: 40
super sewer
new NHS hospitals Supply chain under pressure
[ Strategic portfolio choices to strengthen future earnings ]
21US Construction
Buildings Civils Market size
Roads: $20bn of funding in next
Education: $13bn available for +4.8% p.a.
10 years for development of
new build schools in California
transportation projects in Texas $323bn
(2024)
Leisure and entertainment: Rail: $27bn mass transit
progressively recovering from expansion programme
the pandemic in Georgia $268bn
(2020)
Infrastructure: Around $550bn
Federal: resurgence of market of new funding from
bipartisan bill
Balfour Beatty’s chosen states
Source: Dodge March 2021
Combined Buildings and Civils capabilities: LAX Airport APM
[ Operations continue to recover from the pandemic ]
22Infrastructure Investments
US P3 market Projects and opportunities
Transportation: Student accommodation:
Increasing use of P3 LAX Airport Vanderbilt University
Bipartisan Infrastructure Act recognises
need for private investment
̶ $100m for P3 feasibility studies
̶ allocation of Private Activity
Bonds increasing to $30bn
Municipals: Municipals: Broward County and City of Fort
Clackamas County Courthouse Lauderdale Joint Government Centre Campus
Expert capability to finance, develop,
build and operate
LAX Automated People Mover (APM)
and student accommodation projects
demonstrate expertise
[ Strong positive trajectory for Investments business ]
23Gammon
Buildings Civils Market size
Aviation: HK$20bn contracts at
Healthcare: HK$500bn to
construct new hospitals by 2036
Hong Kong Third Runway System +4.0% p.a.
– T2 expansion and APM
HK$162bn
(2024)
Housing: Target to build 430,000 Roads: Central Kowloon route –
new homes by 2029 Kai Tak West and M&E
HK$139bn
(2020)
Data centres: Continued Rail: HK$70bn investment in new
expansion of the digital railway lines and stations
economy
Source: Construction Industry Council;
Buildings and Civils new construction
[ 2021 PFO back to pre-pandemic level ]
24Strong outlook
Significant recovery in profitability
Strategic portfolio choices to strengthen future earnings
Infrastructure growth in chosen markets
Expert capability to deliver a net zero world
Strong positive trajectory for Investments business
[ Driving attractive cash generation and returns ]
25Appendix
Forward-looking statements
This presentation, including information included or incorporated by reference in it, may include statements that are or may be forward-looking
statements, beliefs or opinions, including statements with respect to Balfour Beatty’s business, financial condition and results of operations. All
statements other than statements of historical facts included in this document may be forward-looking statements. These forward-looking statements can
be identified by the use of forward-looking terminology, including the terms “believes”, “estimates”, “projects”, “plans”, “anticipates”, “targets”, “aims”,
“continues”, “expects”, “intends”, “hopes”, “may”, “will”, “would”, “could” or “should” or, in each case, their negative or other various or comparable
terminology. These statements are made by Balfour Beatty in good faith based on the information available to it at the date of the 2021 half year results
announcement and reflect the beliefs and expectations of Balfour Beatty. By their nature, forward-looking statements involve known and unknown risks
and uncertainties because they relate to events and depend on circumstances that may or may not occur in the future.

A number of factors could cause actual results and developments to differ materially from those expressed or implied by the forward-looking statements,
including, without limitation, developments in the global economy, changes in UK and US government policies, spending and procurement
methodologies, failure in Balfour Beatty's health, safety or environmental policies and the Principal Risks as set out in the Company’s Annual Report and
Accounts 2020.

No representation or warranty is made that any of these statements or forecasts will come to pass or that any forecast results will be achieved, and
projections are not guarantees of future performance. Forward-looking statements speak only as at the date of the 2021 half year results announcement
and Balfour Beatty and its advisers expressly disclaim any obligations or undertaking to release any update of, or revisions to, any forward-looking
statements in this presentation. No statement in this presentation is intended to be, or intended to be construed as, a profit forecast or profit estimate or to
be interpreted to mean that Balfour Beatty plc’s earnings per share for the current or future financial years will necessarily match or exceed the historical
earnings per share for Balfour Beatty plc. As a result, you are cautioned not to place any undue reliance on such forward-looking statements.

27
Order book compared with HY 2020
                                                                                                           Total HY 2021 £16.1bn
                                                                                                           Total HY 2020 £17.5bn

                                       £5.1bn £4.9bn                                                           £5.2bn
                                                                                                                          £4.6bn
     £3.8bn £3.7bn
                                                                           £3.4bn
                                                                                       £2.9bn

     HY 2020   HY 2021                  HY 2020     HY 2021                HY 2020     HY
                                                                                       HY 2021
                                                                                          2021                 HY 2020     HY 2021

       0-6 months                        6-18 months                        18-30 months                         30+ months
          Construction Services - UK      Construction
                                   UK Construction
                                          US           Services
                                                      US
                                              Construction      - US
                                                          Construction   Construction
                                                                         Gammon       Services
                                                                                       Support -Services
                                                                                                 Gammon      Support Services

28
UK Construction order book
4%
17% 12% Contract type Relative risk
Fixed price R
I
Target cost S
50% £2.7bn 46% K
£6.2bn Cost reimbursable
71%
HY 2018 HY 2021
29Group balance sheet £m HY 2021 FY 2020 HY 2020 Goodwill and intangible assets 1,109 1,123 1,184 Working capital (1,023) (887) (833) Net cash (excluding infrastructure concessions) 625 581 563 Investments in joint ventures and associates 541 554 605 PPP financial assets 149 155 159 Infrastructure concessions – non-recourse net debt (318) (317) (314) Net retirement benefit assets 166 89 326 Net lease liabilities (5) (4) (7) Net deferred tax liabilities (18) (24) (15) Other assets and liabilities 94 75 (57) Net assets 1,320 1,345 1,611 30
Cash flow
£m                                                                       HY 2021    HY 2020    £m                                                       HY 2021    HY 2020
Operating cash flows                                                          64         22    Working capital flows^
Working capital inflow                                                       123         74    Inventories                                                   11         (1)
Pension deficit       payments≠                                              (29)        (8)   Net contract assets                                          113        101
Cash from operations                                                         158         88    Trade and other receivables                                    6        (53)
Lease payments (inc. interest paid)                                          (32)       (29)   Trade and other payables                                      (5)         6
Dividends from joint ventures & associates                                    12         13    Provisions                                                    (2)        21
Capital expenditure                                                          (16)       (17)   Working capital inflow^                                      123         74
Purchase of ordinary shares                                                  (97)          -   ^   excluding impact of foreign exchange and disposals

Infrastructure Investments
     Disposal proceeds                                                        20           -
     New investments                                                          (8)       (21)
Other                                                                          7         17
Net cash movement                                                             44         51
Opening net        cash*                                                     581        512
Closing net cash*                                                            625        563

Average net cash*                                                            611        507
*   excluding infrastructure investments (non-recourse) net borrowings
≠   includes £1 million (HY 2020: £2 million) of regular funding

31
Working capital – Group
£0m 0
Jun 15 Jun 16 Jun 17 Jun 18 Jun 19 Jun 20 Jun 21
Jun 21
£(200)m
(4)%
£(400)m
£(600)m (8)%
£(800)m
(10.7)% (12)%
£(1,000)m
(11.9)%
(13.2)% (13.1)% (13.6)%
£(1,200)m (13.9)% (14.2)% (16)%
Period end working capital Period end working capital as % revenue
Debtor days* 28 30 37 37 34 34 26
Creditor days* 53 52 53 55 49 48 35
from continuing operations including non-underlying items
* debtor days include current trade receivables; creditor days include current trade and other payables, excluding accruals
32Working capital – Construction Services
£0m 0
Jun 15 Jun 16 Jun 17 Jun 18 Jun 19 Jun 20 Jun 21
Jun 21
£(200)m (4)%
£(400)m
(8)%
£(600)m
(12)%
£(800)m (11.1)%
(11.9)%
£(1,000)m (14.2)% (14.2)% (16)%
(15.4)%
(16.8)%
£(1,200)m (18.2)% (20)%
Period end working capital Period end working capital as % revenue
from continuing operations including non-underlying items
33Non-underlying items £m HY 2021 HY 2020 Impairment and amortisation Amortisation of acquired intangibles (2) (2) Other Grant income repaid in relation to UK Job Retention Scheme (19) − Release of accrual relating to sale of Parsons Brinckerhoff 1 − Tax Non-underlying recognition of deferred tax assets in the UK 2 36 Tax on grant income in relation to UK Job Retention Scheme 4 - Impact of tax rate change on deferred tax assets previously recognised through non-underlying 15 3 Tax on other items above - 1 Total non-underlying items 1 38 34
Net finance costs
£m                                                           HY 2021   HY 2020
Subordinated debt interest receivable                  12
Interest on PPP financial assets                       4
Interest on non-recourse borrowings                    (7)         9         7
Net finance income – pension schemes                               1         1
Other interest receivable                              5
Other interest payable                                 (3)         2       (1)
US private placement                                             (5)       (6)
Preference shares                                                  -       (8)
Interest on lease liabilities                                    (3)       (3)
Impairment of loans to joint ventures and associates             (9)         −
Net finance costs                                                (5)      (10)

35
Pensions – balance sheet movement

                                                                                 £48m
                                                                   £29m
                                                                                            £166m
                                                 £133m
                                                         £89m
                                   £32m   £54m

     £(128)m   £(146)m   £(231)m

      2014      2015      2016     2017   2018    2019   2020    Employer         Net       HY 2021
                                                                contributions   actuarial
                                                                                gains &
                                                                                 other

36
Borrowing repayment profile
£200m
£160m
£120m
£80m £151m
£40m
£36m
£0m
2021 2022 2023 2024 2025
US Private Placement notes
The Group has a £375m committed bank facility extending through to 2023, which was undrawn at 2 July 2021
37Financial history
450% £12bn Build to Last £400m
Increase in £10bn
revenue at peak £300m
£8bn
45 £6bn £200m
Acquisitions £4bn
£100m
£2bn
£94m £0bn £0m
Average ordinary dividend -£2bn
(2011-2014)
£(100)m
-£4bn Primarily due to
COVID-19
-£6bn £(200)m
£15m 2000 2002 2004 2006 2008 2010 2012 2014 2016 2018 2020
Average ordinary dividend
(2015-2020) Revenue (LHS) Profit from operations (RHS) Ordinary dividend (RHS)
38You can also read