Investor Presentation & Company Overview
February 2020
←
→
Page content transcription
If your browser does not render page correctly, please read the page content below

Investor Presentation & Company Overview February 2020

Cautionary Statements
This presentation contains forward-looking statements that are subject to known and unknown risks and uncertainties, many of which are beyond our control. All statements other than statements of historical
fact included in this presentation are forward-looking statements. Forward-looking statements appearing throughout this presentation include, without limitation, statements regarding our intentions, beliefs,
assumptions or current expectations concerning, among other things, financial position; results of operations; cash flows; prospects; growth strategies or expectations; customer retention; the outcome (by
judgment or settlement) and costs of legal, administrative or regulatory proceedings, investigations or inspections, including, without limitation, collective, representative or any other litigation; and the impact of
prevailing economic conditions. You can identify forward-looking statements by the fact that they do not relate strictly to historical or current facts. These statements may include words such as “believes,”
“expects,” “may,” “will,” “shall,” “should,” “would,” “could,” “seeks,” “aims,” “projects,” “is optimistic,” “intends,” “plans,” “estimates,” “anticipates” and other comparable terms. We caution you that forward-looking
statements are not guarantees of future performance or outcomes and that actual performance and outcomes, including, without limitation, our actual results of operations, financial condition and liquidity, and
the development of the market in which we operate, may differ materially from those made in or suggested by the forward-looking statements contained in this presentation. In addition, even if our results of
operations, financial condition and cash flows, and the development of the market in which we operate, are consistent with the forward-looking statements contained in this presentation, those results or
developments may not be indicative of results or developments in subsequent periods. A number of important factors, including, without limitation, the risks and uncertainties discussed under the captions “Risk
Factors” and “Management’s Discussion and Analysis of Financial Condition and Results of Operations” in our Annual Report on Form 10-K and the Quarterly Report on Form 10-Q filed with the U.S. Securities
and Exchange Commission, could cause actual results and outcomes to differ materially from those reflected in the forward-looking statements. Because of these risks, we caution that you should not place
undue reliance on any of our forward-looking statements. New risks and uncertainties arise from time to time, and it is impossible for us to predict those events or how they may affect us. Further, any forward-
looking statement speaks only as of the date on which it is made. We undertake no obligation to revise the forward-looking statements in this presentation after the date of this presentation.
Market data and industry information used throughout this presentation are based on management’s knowledge of the industry and the good faith estimates of management. We also relied, to the extent
available, upon management’s review of independent industry surveys, forecasts and publications and other publicly available information prepared by a number of third party sources. All of the market data
and industry information used in this presentation involves a number of assumptions and limitations which we believe to be reasonable, and you are cautioned not to give undue weight to such estimates.
Although we believe that these sources are reliable, we cannot guarantee the accuracy or completeness of this information, and we have not independently verified this information. While we believe the
estimated market position, market opportunity and market size information included in this presentation are generally reliable, such information, which is derived in part from management’s estimates and
beliefs, is inherently uncertain and imprecise. Projections, assumptions and estimates of our future performance and the future performance of the industry in which we operate are subject to a high degree of
uncertainty and risk due to a variety of factors, including those described above. These and other factors could cause results to differ materially from those expressed in our estimates and beliefs and in the
estimates prepared by independent parties.
We present Adjusted EBITDA, Adjusted EBITDA margin (Adjusted EBITDA over Net Sales), Net debt (total debt less cash and cash equivalents), Adjusted Net Income Per Share, and Leverage ratio (net debt
or total debt less cash and cash equivalents, over Adjusted EBITDA on trailing twelve month (“TTM”) basis) to help us describe our operating and financial performance. Adjusted EBITDA, Adjusted EBITDA
margin, Net debt (total debt less cash and cash equivalents), Adjusted Net Income Per Share, and Leverage ratio are non-GAAP financial measures commonly used in our industry and have certain limitations
and should not be construed as alternatives to net income, net sales and other income data measures (as determined in accordance with generally accepted accounting principles in the United States, or
GAAP), or as better indicators of operating performance. Adjusted EBITDA, Adjusted EBITDA margin, Net debt, Adjusted Net Income Per Share, and Leverage ratio, as defined by us may not be comparable
to similar non-GAAP measures presented by other issuers. Our presentation of such measures should not be construed as an inference that our future results will be unaffected by unusual or non-recurring
items. See the appendix to this presentation for a reconciliation of Adjusted EBITDA to net income, Adjusted EBITDA Margin, Adjusted Net Income Per Share to Net Income Per Share, net debt to total debt,
and Leverage Ratio.
Fiscal Periods - The Company has a fiscal year that ends on September 30th. It is the Company's practice to establish quarterly closings using a 4-5-4 calendar. The Company's fiscal quarters end on the last
Friday in December, March and June.
Any information contained in the following slides that has been previously publicly presented by Atkore speaks as of the date that it was originally presented, as indicated. Atkore is not updating or affirming any
of such information as of today’s date. The provision of this information shall not imply that the information has not changed since it was originally presented.

                                                                                                                                                                                                                      2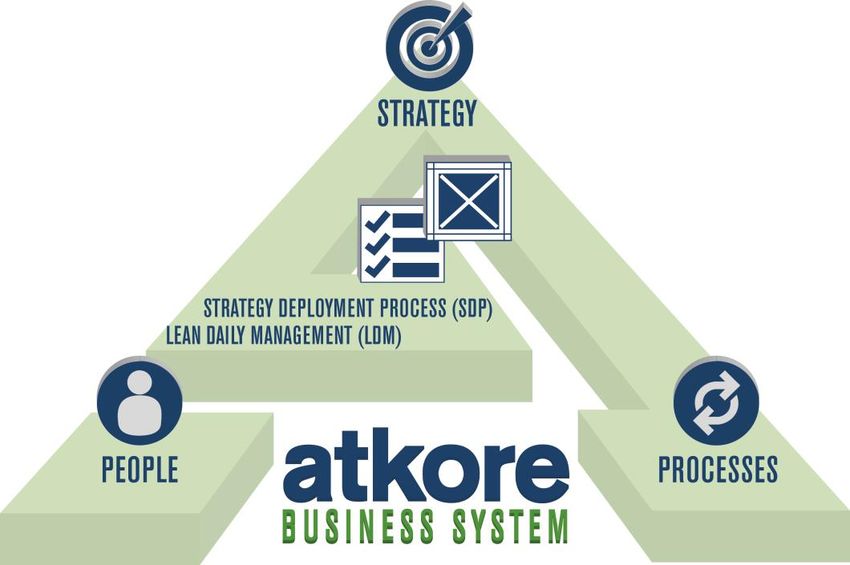
Electrical industry leader with strong financial performance

■ #1 or #2 market positions in most of our product categories      Net sales breakdown
                                                                        By reportable segment                                        By end market
■ Offer must-stock products to distribution and OEM customers         Mechanical
  via single integrated platform                                      Products &                                                                               U.S.
                                                                       Solutions                                          Other                            Construction -
                                                                                                                                                               New
■ Established reputation as an industry leader in quality,               25%                                               6%
                                                                                                                                                               53%
  availability, delivery, value and innovation

■ Organized into two complementary segments: Electrical                                                                   Int'l
                                                                                                                          12%
  Raceway and Mechanical Products & Solutions (“MP&S”)                                                                                                          U.S.
                                                                                                                 Electrical                                 Construction -
■ U.S.-centric player with large addressable market and close                                                    Raceway          OEM                          R&R
                                                                                                                   75%            14%                           15%
  adjacent opportunities
                                                                                                            FY 2019 net sales: $1.9B

 Financial performance (Adjusted EBITDA)                           Addressable market opportunity
($M)
                           +18% CAGR                                   Electrical Raceway                             Mechanical Products & Solutions
                                                324          332

                                                                                                                                         ~$4

                                                                                                  Billion
                                     272                                         ~$85

                                                                                                                                                 Billion
              235        228                                          U.S. electrical                                         U.S. mechanical
                                                                      products market                                         products &
                                                                                                                              solutions market
       164
                                                                                $14

                                                                                        Billion
                                                                           Electrical
                                                                           raceway
                                                                           market

                                                                                                                                        $0.5B
                                                                                    $1.4B

  FY2015     FY2016     FY2017     FY2018     FY2019     TTM Dec
                                                           2019

                                                                                                                                                                       3
Performance driven by the Atkore Business System

                               Strategy Fundamental:
                               ■   Market Insights
                               ■   Portfolio Management
                               ■   Innovation/New Product Development
                               ■   Value Propositions
                               ■   Strategic Pricing
                               ■   Active Account and Channel Management

People Fundamental:                                                        Processes Fundamental:
■   Engagement and Alignment                                               ■ Continuous Improvement
■   Communication                                                            Methodologies
■   Talent Acquisition                                                     ■ Visual Workplace and Lean Daily
                                                                             Management
■   Performance Management
                                                                           ■ Built in Quality
■   Leadership Development
                                                                           ■ Information and Material Flow
■   Aligned Compensation
                                                                           ■ Equipment Availability and
■   Recognition
                                                                             Reliability
                                                                           ■ Commercial Processes

                                                                                                           4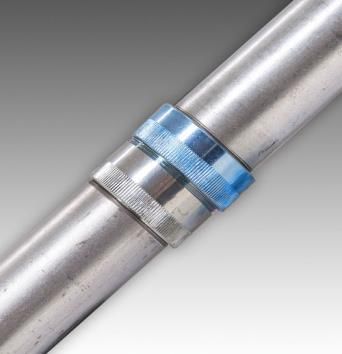
We manufacture products that are all around you every day

  Wire Basket
  Cable Tray                                       Armored Cable

     Cable                                       Electrical Raceway
    Tray and                                     Fittings: Conduit &
     Ladder                                             Cable

     Electrical                                    Metal Electrical
   Prefabrication                                     Conduit

     Metal                                       Specialty Electrical
   Framing &                                     Conduit: Stainless
    Fittings                                    Steel, PVC-Coated &
                                                      Aluminum

                                              Flexible Electrical Conduit
   PVC Trunking
                                               and Liquidtight Conduit

 PVC Electrical                                   Industrial Flexible
Conduit & Fittings                                Electrical Conduit

                                                                            5
Broad and growing portfolio provides value to customers

Value proposition                                 Blue chip customer base

                                                     Global
                                                   Electrical
                                                  Distributors

                                                  Independent
                                                    Electrical
                                                  Distributors

■ Brands and reputation                            Industrial
                                                  Distributors
■ Product breadth                                  & Big Box
                                                     Retail
■ Bundling, co-loading and value-add advantages

■ Quality, availability, delivery and service

                                                                            6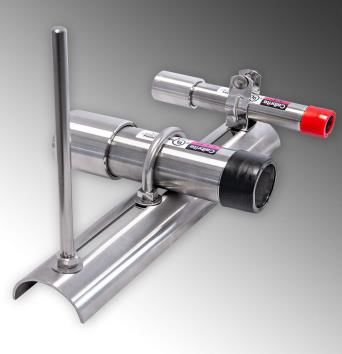
Brand reputations built over decades of service to customers

  Key brands   # of Years in Use                      Market Categories & Brand Detail

                                   Pre-wired armored and metal clad cables, flexible wiring systems,
                  >90 years        flexible metal, non-metallic, and flexible metallic liquid tight conduits
                                   and fittings.

                                   Electrical metallic tubing, PVC rigid conduit, mechanical tube as well
                   60 years
                                   as a broad portfolio of other supporting products and accessories.

                                   PVC conduit, fittings, elbows, special radius sweeps and plumbing
                  >25 years
                                   products.

                                   Premier brand of barbed tape for the protection of critical infrastructure
                   40 years        such as correctional facilities, commercial facilities, and military
                                   applications.

                                   Original metal framing system featuring a unique weldless connection.
                                   Unistrut has evolved to include a comprehensive engineered building
                  >90 years
                                   and support system featuring a robust line of channels, fittings,
                                   fasteners, and accessories.

                                                                                                                7
Strong brands and leading market positions anchor portfolio
Leading market positions in each of our major lines of business
Rank Market share1
Steel
Conduit #2 ~35%
Electrical
Raceway
PVC Conduit #1 ~35%
Armored
Cable
#2 ~33%
Products & Solutions
In-line
Galvanized
Mechanical
#1 ~80%
Mechanical
Tube
Metal
Framing and ~20%
Related
#2
Fittings
1 Management estimates based on market data and industry knowledge. Market share is based on U.S.
Adjusted net sales relative to the estimated U.S. addressable market size.
8Driving growth through innovation and portfolio expansion
Product innovation and organic growth examples
Super Kwik-Couple (SKC) Raintight Conduit BriteRail
Product of the Year Category Winner: Product of the Year Category Winner:
Conduit, Raceways & Wireways Fasteners, Hangers & Accessories
■ Industry’s Best All-in-One conduit ■ Innovative design in conduit
solution support systems for sanitary
■ Fastest installation times and wash-down environments
■ Eliminates the need for field ■ Custom dome-shape design
threading eliminates any flat surface
■ Coupling design allows for easy where debris or bacteria can
installation in compact areas form and water to pool
Barbed Tape & Other Security Solutions Other Examples
Broad Product Portfolio for the Protection of ■ Commercialized over 35 new products in the last
Critical Infrastructure 24 months
■ Industry leading brands and ■ Continue to drive high single digit revenue
products growth in focused product categories
■ Global distribution capabilities ■ Expanding digital offerings and tools for our
■ New patent pending products products such as BIM Models (Building
provide enhanced protection Information Modelling) which help design
against unauthorized access professionals during the planning process
9M&A strategy supporting and enhancing organic growth
Portfolio changes – 2012 to 2019
Added over $400 million in profitable proforma revenue
+ Built PVC business – acquired Heritage Plastics, Ridgeline Pipe
Manufacturing and American Pipe & Plastics
+ Enhanced size and scale in PVC and Metal Conduit – acquired
Mergers & Calpipe and Rocky Mountain Colby Pipe
Acquisitions + Increased product offering and footprint in cable management –
acquired Marco, Vergokan, and U.S. Tray
+ Expanded conduit and fittings portfolio – acquired SCI and
Flexicon
Exited over $400 million in breakeven proforma revenue
‒ Ceased operations for fence and sprinkler businesses
Divestitures ‒ Sold Flexhead and high strength steel facility in Pennsylvania
‒ Closed manufacturing locations in Brazil and France
10Disciplined capital approach drives value for stockholders
Disciplined approach to capital deployment
Manage Reinvest in the Mergers & Return Cash to
Leverage Business Acquisitions Stockholders
▪ Target ~2x times for ▪ Maintain and grow ▪ Structured ▪ $50M in stock buyback
Net Debt to the business with approach; focused authorization remaining as
TTM Adjusted EBITDA smart investments on bolt-on targets of December 27, 2019
Select uses of cash – FY2017 to Q1 FY2020
▪ Generated $529M in cash flow from operating activities during the period
▪ Issued $925M in long-term debt
▪ Balanced $1.56B in spending across debt repayment, capital projects, bolt-on acquisitions and stock buybacks
Long-Term Debt Repaid Capex M&A Stock Repurchases
$716M $108M $285M $450M $1.56B
11Strong business foundation supports future investment
Investment highlights
▪ The Atkore Business System is the foundation of our operating
performance
▪ Strong brands and leading market positions in key product
categories that are all around you every day
▪ Track record of solid financial and operating results
▪ Disciplined approach to capital deployment with a demonstrated
history of M&A success
▪ Continuing to expand and grow the company through execution
of our strategic priorities
12First Quarter 2020 Earnings Presentation As presented on February 4, 2020
Q1 2020 Highlights and Financial Summary

Delivered Net Income of $35M                                                                         Q1       Q1       Y/Y
                                                           ($’s in millions)                        2020     2019      Change

Increased Adjusted EBITDA by 11%, or
$7.7M in year over year improvement                        Net Sales                                $447.4   $452.0    (1.0%)

                                                           Operating Income                          $52.5   $45.7     15.0%
Reduced Net Debt/TTM Adjusted
EBITDA to 2.1x                                             Net Income                                $34.8   $26.9     29.1%

                                                           Adjusted EBITDA(1)                        $77.7   $70.0     11.0%
Operating Cash Flow of $52M; Free
Cash Flow(1) of $42M, up 27% versus                        Adjusted EBITDA
                                                                                                     17.4%   15.5%    +190 bps
prior year                                                 Margin(2)
                                                           Net Income per
                                                                                                     $0.71   $0.54     31.5%
                                                           Share (Diluted)

                                                           Adjusted Net Income
                                                                                                     $0.94   $0.74     27.0%
                                                           per Share(1) (Diluted)

                           (1)   See non-GAAP reconciliation in appendix
                           (2)   Adjusted EBITDA Margin is Adjusted EBITDA as a percentage of Net sales
                                                                                                                                14
Consolidated Atkore Q1 2020 Bridges
Q1 Net Sales Bridge Net Sales Growth
Volume/Mix +3.1%
$14
$452M $12 $447M Price (6.6%)
$1
$30
Acquisitions/Divestitures +2.7%
FX/Other (0.2%)
Total (1.0%)
2019 Volume/Mix Price M&A FX/Other 2020
Q1 Adjusted EBITDA Bridge Highlights
$2 $0 $78M ▪ 3% volume growth with contributions from
$6 $1
$1
both segments
$70M
▪ Adjusted EBITDA gains driven by profitable
volume growth and operational improvement
initiatives
2019 Volume/Mix Price M&A Productivity/ FX/Other 2020
vs. Cost Investment/
Inflation
15Electrical Raceway Q1 Highlights
Volume growth of 2% led by PVC products
Q1 Q1 Y/Y
2020 2019 Change
($’s in millions)
Launched three new product lines of diecast Net Sales $341.4 $343.4 (0.6%)
fittings
Adjusted EBITDA $70.2 $68.5 2.5%
Continue to see above market growth from our Adjusted EBITDA
20.6% 19.9% +70 bps
Margin
focused product categories
Q1 Net Sales Bridge
Adjusted EBITDA margins increased 70 bps to $7
$343M $12
20.6% $341M
$2
$19
2019 Volume/Mix Price M&A FX/Other 2020
16Mechanical Products & Solutions Q1 Highlights
Strong volume growth of ~7% led by continued
Q1 Q1 Y/Y
ramp of large renewable projects and solid 2020 2019 Change
($’s in millions)
execution across the portfolio
Net Sales $106.7 $108.8 (2.0%)
Adjusted EBITDA margins increased 560 bps Adjusted EBITDA $16.7 $10.9 53.0%
up to 15.6% Adjusted EBITDA
15.6% 10.0% +560 bps
Margin
Focused on expanding product offerings as well
Q1 Net Sales Bridge
as selling value-add solutions to customers
$7
$109M $2 $107M
$0
$11
2019 Volume/Mix Price M&A FX/Other 2020
17Key Balance Sheet and Cash Flow Metrics
Metrics Leverage Ratio(2)
($’s in millions) 12/27/2019
Cash and cash equivalents $164.1
Reduced by 0.8x
2.9 2.9
Total Debt $845.2
2.8
Net Debt $681.1
2.6
YTD Net cash from operating activities $52.2
YTD Capital expenditures $9.8
2.2
YTD Free cash flow(1) $42.4
2.1
TTM Adjusted EBITDA(2) $332.1
Leverage Ratio(1) Q4 2018 Q1 2019 Q2 2019 Q3 2019 Q4 2019 Q1 2020
Total debt / TTM Adjusted EBITDA(2) 2.5
Reduced leverage ratio by 0.8x
Net debt / TTM Adjusted EBITDA(2) 2.1 versus prior year
(1) Free Cash Flow defined as Net cash from operating activities less capital expenditures.
(2) Leverage ratio and TTM Adjusted EBITDA reconciliations for all periods above can be found either in the appendix, or in Exhibit 99.1 to form 8-K filed on
February 4, 2020, November 22, 2019, August 8, 2019, May 7, 2019, February 6, 2019, or November 28, 2018. 18Financial Outlook Summary
Changes to
Q2 2020 FY 2020
FY 2020
Electrical Raceway Volume +1 to 2% -
Segment Adjusted EBITDA* $72 - $77M $308 - $318M +$5M / +$5M
Volume +1 to 3% -
Mechanical Products &
Solutions Segment Adjusted EBITDA* $15 - $19M $70 - $75M -
Adjusted EBITDA* $80 - $85M $340 - $350M +$5M / +$5M
Adjusted EPS* $0.90 - $0.95 $3.95 - $4.05 +$0.15 / +$0.15
Consolidated Atkore
Interest Expense $11 - $12M $43 - $47M -
Tax Rate ~25% ~25% -
Capital
$12 - $14M $40 - $45M -
Expenditures
Diluted Shares** ~48 ~48 (1)
* Reconciliation of the forward-looking full-year 2020 outlook for Adjusted EBITDA and Adjusted EPS is not being provided as the Company does not currently have sufficient data
to accurately estimate the variables and individual adjustments for such reconciliation. 19
** Represents weighted-average shares outstanding in millions used in calculation of Adjusted EPS outlook.Appendix
Segment Information

                                                                    Three months ended
                                               December 27, 2019                              December 28, 2018

                                                                   Adjusted                                         Adjusted
                                                     Adjusted      EBITDA                           Adjusted        EBITDA
(in thousands)                        Net sales      EBITDA        Margin            Net sales      EBITDA          Margin
Electrical Raceway                $      341,376 $       70,193       20.6 % $          343,406 $       68,489         19.9 %
Mechanical Products & Solutions          106,660         16,654       15.6 %            108,813         10,887         10.0 %
Eliminations                                 (588)                                          (191)
   Consolidated operations        $      447,448                                $       452,028

                                                                     Fiscal year ended
                                              September 30, 2019                               September 30, 2018
                                                                   Adjusted                                         Adjusted
                                                   Adjusted        EBITDA                           Adjusted        EBITDA
(in thousands)                      Net sales      EBITDA          Margin             Net sales     EBITDA          Margin
Electrical Raceway                $   1,443,493 $      292,585         20.3 %       $   1,366,611 $    255,260         18.7 %
MP&S                                     474,260 $      70,040         14.8 %             470,153 $     51,339         10.9 %
Eliminations                              (1,215)                                          (1,625)
   Consolidated operations        $   1,916,538                                     $   1,835,139

                                                                                                                            21
Adjusted Earnings Per Share Reconciliation
Consolidated Atkore International Group Inc.
Three months ended
December 27, December 28,
(in thousands, except per share data) 2019 2018
Net income $ 34,790 $ 26,949
Stock-based compensation 3,123 2,982
Intangible asset amortization 8,113 8,214
Other (a) 2,836 206
Pre-tax adjustments to net income 14,072 11,402
Tax effect (3,518) (2,793)
Adjusted net income $ 45,344 $ 35,558
Weighted-Average Diluted Common Shares Outstanding 47,999 48,283
Net income per diluted share $ 0.71 $ 0.54
Adjusted net income per diluted share $ 0.94 $ 0.74
(a) Represents other items, such as inventory reserves and adjustments, realized or unrealized gain (loss) on foreign currency transactions and release
of certain indemnified uncertain tax positions.
22Net Income to Adjusted EBITDA Reconciliation
Consolidated Atkore International Group Inc.
Three Months Ended Fiscal Year Ended
December December September September September September September
(in thousands) 27, 2019 28, 2018 30, 2019 30, 2018 30, 2017 30, 2016 30, 2015
Net income $ 34,790 $ 26,949 $ 139,051 $ 136,645 $ 84,639 $ 58,796 $ (4,955)
Income tax expense (benefit) 7,340 8,154 45,618 29,707 41,486 27,985 (2,916)
Depreciation and amortization 18,730 18,021 72,347 66,890 54,727 55,017 59,465
Interest expense, net 10,620 12,160 50,473 40,694 26,598 41,798 44,809
Loss (gain) on extinguishment of debt — — — — 9,805 (1,661) —
Restructuring & impairments 220 1,387 3,804 1,849 1,256 4,096 32,703
Net periodic pension benefit cost — — — — — 441 578
Stock-based compensation 3,123 2,982 11,798 14,664 12,788 21,127 13,523
Gain on purchase of a business — — (7,384) — — — —
Gain on sale of a business — — — (27,575) — — —
Gain on sale of a joint venture — — — — (5,774) — —
ABF product liability impact — — — — — 850 (216)
Consulting fees — — — — — 15,425 3,500
Certain legal matters — — — (4,833) 7,551 1,382 —
Transaction costs 51 164 1,200 9,314 4,779 7,832 6,039
Impact of Fence and Sprinkler exit — — — — — 811 (2,885)
Other (a) 2,836 206 7,501 4,194 (10,247) 1,103 14,305
Adjusted EBITDA $ 77,710 $ 70,023 $ 324,408 $ 271,549 $ 227,608 $ 235,002 $ 163,950
(a) Represents other items, such as inventory reserves and adjustments, release of indemnified uncertain tax positions and the impact of foreign exchange gains or losses.
23Trailing Twelve Month Adjusted EBITDA Reconciliation
Consolidated Atkore International Group Inc.
TTM Three months ended
December 27, December 27, September 30,
(in thousands) 2019 2019 2019 June 28, 2019 March 29, 2019
Net income $ 146,892 $ 34,790 $ 45,997 $ 36,550 $ 29,555
Interest expense, net 48,933 10,620 $ 12,196 12,789 13,328
Income tax expense 44,804 7,340 $ 16,105 11,106 10,253
Depreciation and amortization 73,056 18,730 $ 18,286 17,760 18,280
Restructuring charges 2,637 220 $ 623 709 1,085
Stock-based compensation 11,939 3,123 $ 2,862 4,120 1,834
Transaction costs 1,087 51 $ 837 76 123
Gain on purchase of a business (7,384) — $ (7,384) — —
Other(a) 10,131 2,836 $ (712) 5,371 2,636
Adjusted EBITDA $ 332,095 $ 77,710 $ 88,810 $ 88,481 $ 77,094
(a) Represents other items, such as inventory reserves and adjustments, realized or unrealized gain (loss) on foreign currency transactions and
release of certain indemnified uncertain tax positions.
24Net Debt to Total Debt and Leverage Ratio
Consolidated Atkore International Group Inc.
December September March 29, December 28, September
($ in thousands) 27, 2019 30, 2019 June 28, 2019 2019 2018 30, 2018
Short-term debt and current
maturities of long-term debt $ — $ — $ — $ — $ 26,561 $ 26,561
Long-term debt 845,243 845,317 884,503 884,095 878,094 877,686
Total debt 845,243 845,317 884,503 884,095 904,655 904,247
Less cash and cash equivalents 164,135 $ 123,415 100,734 51,498 75,919 $ 126,662
Net debt $ 681,108 $ 721,902 $ 783,769 $ 832,597 $ 828,736 $ 777,585
TTM Adjusted EBITDA (a) $ 332,095 $ 324,408 $ 306,656 $ 294,839 $ 283,086 $ 271,549
Total debt/TTM Adjusted
EBITDA 2.5 x 2.6 x 2.9 x 3.0 x 3.2 x 3.3 x
Net debt/TTM Adjusted EBITDA 2.1 x 2.2 x 2.6 x 2.8 x 2.9 x 2.9 x
(a) TTM Adjusted EBITDA is equal to the sum of Adjusted EBITDA for the trailing four quarter period. The reconciliation of Adjusted EBITDA for the quarter ended June 28, 2019
can be found in Exhibit 99.1 to form 8-K filed August 7, 2019 and is incorporated by reference herein. The reconciliation of Adjusted EBITDA for the quarter ended March 29, 2019
can be found in Exhibit 99.1 to form 8-K filed May 7, 2019 and is incorporated by reference herein. The reconciliation of Adjusted EBITDA for the quarter ended December 28,
2018 can be found in Exhibit 99.1 to form 8-K filed February 6, 2019 and is incorporated by reference herein. The reconciliation of Adjusted EBITDA for the years ended
September 30, 2019 and September 30, 2018 can be found in Exhibit 99.1 to form 8-K filed November 22, 2019 and is incorporated by reference herein.
25Free Cash Flow Reconciliation
Consolidated Atkore International Group Inc.
Three months ended
(in thousands) December 27, 2019 December 28, 2018
Net cash provided by operating activities $ 52,173 $ 40,277
Capital Expenditures (9,809) (6,875)
Free Cash Flow $ 42,364 $ 33,402
26You can also read