January 7, 2021 - Bed Bath & Beyond
←
→
Page content transcription
If your browser does not render page correctly, please read the page content below
January 7, 2021

BED BATH & BEYOND

This presentation contains forward-looking statements, including, but not limited to, the Company’s progress and anticipated progress towards its long-term
objectives, the status of its future liquidity and financial condition, and its outlook for the Company’s fiscal 2020 fourth quarter and for its 2021 fiscal year. Many of these
forward-looking statements can be identified by use of words such as may, will, expect, anticipate, approximate, estimate, assume, continue, model, project, plan, goal,
preliminary and similar words and phrases, although the absence of those words does not necessarily mean that statements are not forward-looking. The Company’s
actual results and future financial condition may differ materially from those expressed in any such forward-looking statements as a result of many factors. Such factors
include, without limitation: general economic conditions including the housing market, a challenging overall macroeconomic environment and related changes in the
retailing environment; risks associated with COVID-19 and the governmental responses to it, including its impacts across the Company’s businesses on demand and
operations, as well as on the operations of the Company’s suppliers and other business partners, and the effectiveness of the Company’s actions taken in response to
these risks; consumer preferences, spending habits and adoption of new technologies; demographics and other macroeconomic factors that may impact the level of
spending for the types of merchandise sold by the Company; civil disturbances and terrorist acts; unusual weather patterns and natural disasters; competition from
existing and potential competitors across all channels; pricing pressures; liquidity; the ability to achieve anticipated cost savings, and to not exceed anticipated costs,
associated with organizational changes and investments, including the Company’s strategic restructuring program and store network optimization strategies; the ability
to attract and retain qualified employees in all areas of the organization; the cost of labor, merchandise and other costs and expenses; potential supply chain disruption
due to trade restrictions, and other factors such as natural disasters, pandemics, including the COVID-19 pandemic, political instability, labor disturbances, product
recalls, financial or operational instability of suppliers or carriers, and other items; the ability to find suitable locations at acceptable occupancy costs and other terms to
support the Company’s plans for new stores; the ability to establish and profitably maintain the appropriate mix of digital and physical presence in the markets it serves;
the ability to assess and implement technologies in support of the Company’s development of its omnichannel capabilities; the ability to effectively and timely adjust the
Company’s plans in the face of the rapidly changing retail and economic environment, including in response to the COVID-19 pandemic; uncertainty in financial markets;
volatility in the price of the Company’s common stock and its effect, and the effect of other factors, including the COVID-19 pandemic, on the Company’s capital
allocation strategy; risks associated with the ability to achieve a successful outcome for its business concepts and to otherwise achieve its business strategies; the
impact of intangible asset and other impairments; disruptions to the Company’s information technology systems including but not limited to security breaches of
systems protecting consumer and employee information or other types of cybercrimes or cybersecurity attacks; reputational risk arising from challenges to the
Company’s or a third party product or service supplier’s compliance with various laws, regulations or standards, including those related to labor, health, safety, privacy or
the environment; reputational risk arising from third-party merchandise or service vendor performance in direct home delivery or assembly of product for customers;
changes to statutory, regulatory and legal requirements, including without limitation proposed changes affecting international trade; changes to, or new, tax laws or
interpretation of existing tax laws; new, or developments in existing, litigation, claims or assessments; changes to, or new, accounting standards; foreign currency
exchange rate fluctuations. Except as required by law, the Company does not undertake any obligation to update its forward-looking statements.

 BED BATH & BEYOND                                                                                                                                                                 2

Mark Tritton                     Gustavo Arnal
                    President & CEO                  CFO & Treasurer

                     Rafeh Masood                    John Hartmann
                    John Hartmann
                     EVP &President,
                    COO;   Chief Digital Officer
                                     buybuy   BABY   COO; President, buybuy Baby

BED BATH & BEYOND                                                                  3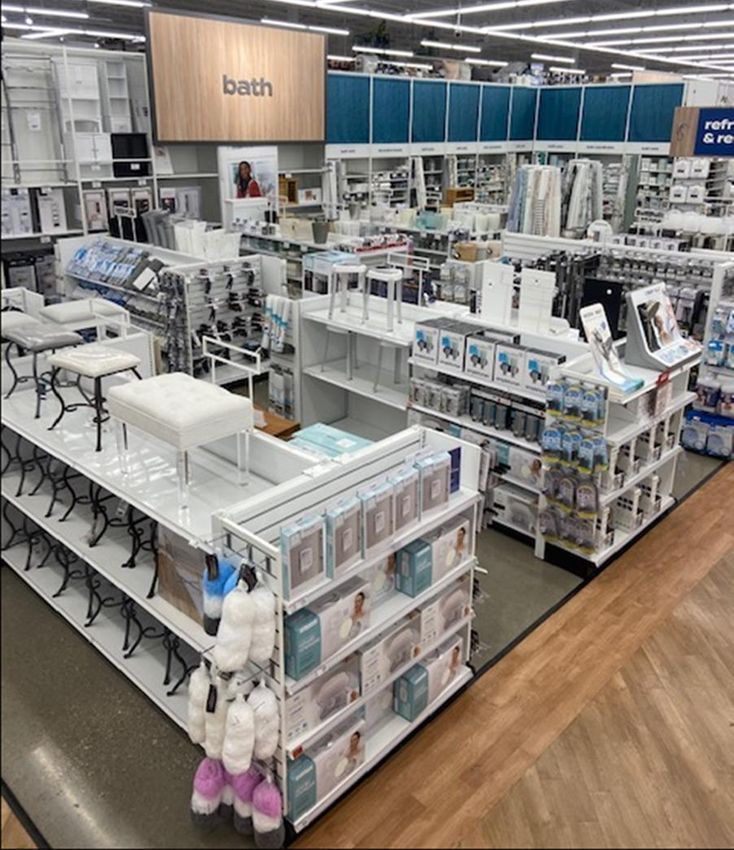
1) Q3 Performance Highlights & Transformation Update
                    2) Financial Outlook
                    3) Digital & Commercial Update
                    4) Operations Update

BED BATH & BEYOND                                                          4
BED BATH & BEYOND 5

Q3 PERFORMANCE HIGHLIGHTS & TRANSFORMATION UPDATE

      “The consistent execution of our growth strategy is unlocking improved financial performance and we delivered a
                              second consecutive quarter of comparable sales and profit growth” – CEO Mark Tritton

                          Consistently                                                                                                                                                            Unlocking
                                                                                                               Strengthening
                          Executing on                                                                                                                                                            Shareholder
                                                                                                               Balance Sheet
                          Strategy                                                                                                                                                                Value Creation

✓ 2nd Consecutive Quarter of Strong                                                 ✓ Positive cash flow generation                                                 ✓ Enhancing FY 2021 EBITDA outlook
  Comparable Sales Growth                                                                     •      $244mn cash flow2                                                with a range
      • +5% Core Bed Bath & Beyond banner1                                                                                                                                     •      $500mn to $525mn
        (BBB) Comp sales growth; +2% Total                                          ✓ Stronger balance sheet with
                                                                                                                                                                    ✓ Reiterating a larger and accelerated
        Enterprise Comp sales growth;                                                 significant gross debt reduction
                                                                                              •      $0.5bn Gross Debt3 reduction
                                                                                                                                                                      share repurchase program
      • +94% Core BBB digital comp growth;
        +77% Total Enterprise digital comp growth                                                                                                                              •       Share Repurchase Program:
                                                                                                                                                                                       up to $825mn from up to $675mn
      • Market share gains in destination Bed                                       ✓ Cash and liquidity levels increase                                                       •       ASRs 1+2: $375mn expected to be
        category, with improving trends in Bath and                                   further                                                                                          completed by the end of FY20 Q4
        Kitchen categories                                                                    •       $1.5bn Cash & Investments;                                                       (2/27/21)
✓ Gross Margin Expansion                                                                              $2.2bn Total Liquidity4

      • +310bps to 35.4% Adj. Gross Margin vs LY
                                                                                                                                                                 Note: ASR-1($225mn): 4.5mn shares delivered in FY20 Q3; Remainder
✓ EBITDA Increases                                                                                                                                                     expected to be delivered by 1/28/21.
                                                                                                                                                                       ASR-2 ($150mn): Expected to be initiated and completed in FY20 Q4.
      • +168% Adj. EBITDA vs LY to $121mn
  BED BATH & BEYOND (1)   Bed Bath & Beyond is among the Company’s four core banners which also include                  (3) Gross Debt includes bond debt, revolver/ABL borrowing, and operating and finance lease liabilities.            6
                          buybuy BABY, Harmon Face Values and Decorist.                                                  (4) Total Liquidity includes cash & investments and availability from asset-backed lending credit facility.
                    (2)   Cash Flow includes cash flow from operations + cash from investing activities, net of CAPEX.
Q3 PERFORMANCE HIGHLIGHTS & TRANSFORMATION UPDATE

                                          Second Consecutive Quarter of Comp Sales Growth

        Total Enterprise                                                            Total Enterprise
            Comp                           Core BBB                                  Digital Comp      Core BBB
                                            Banner                                                      Banner
                                            Comp                                                        Digital
                    +2%                      +5%                                         +77%           Comp
                    vs LY                                                                vs LY
                                              vs LY                                                    +94%
                                                                                                        vs LY

                                        Consistent Gross Margin Expansion / EBITDA Growth
                                             Adj. Gross Margin            Adj. EBITDA
                                                      35.4%
                                                                                $121mn
                                                              +310bps                    +168%
                                                                 vs                        vs
                                             32.3%              LY      $45mn              LY

                                              FY19    FY20              FY19     FY20
                                               Q3      Q3                Q3       Q3

BED BATH & BEYOND                                                                                                 7
Q3 PERFORMANCE HIGHLIGHTS & TRANSFORMATION UPDATE

                                                                                     Positive Cash Flow Generation
                                                                                      Cash Flow1                       Cash & Investments

                                                                                          $244mn                                     $1.5bn

                                                              Balance Sheet Strengthened / Return to Shareholders
                                         Inventory                                 Gross Debt                                                                              Share Repurchase
                                         Reduction                                 Reduction 2                                       Strong                                    Increase
                                                                                     ($0.5bn)                                         Total
                                              (30%)                                   vs Q2                                                                                            From
                                                                                                                                    Liquidity 3
                                                vs                                                                                                                                     $675
                                                LY                                   ($1.0bn)                                        $2.2bn                                             to
                                                                                      vs Q1                                                                                           $825mn

                  (1)   Cash flow generation includes cash flow from operations ($44mn) and cash flow from investing driven by proceeds from non-core banners and real estate monetization, net of capital expenditures ($200mn).
BED BATH & BEYOND (2)   Gross Debt includes bond debt, revolver/ABL borrowing, and operating and finance lease liabilities.                                                                                                         8
                  (3)   Total Liquidity includes cash & investments and availability from asset-backed lending credit facility.
Q3 PERFORMANCE HIGHLIGHTS & TRANSFORMATION UPDATE

 Consistent Comparable                                 Margin Expansion                           Positive Cash Flow                               Fast-Paced                                              Stronger
     Sales Growth                                      & EBITDA Growth                               Generation                                  Transformation                                        Capital Structure

✓5% Comp Sales growth in core                      ✓310bps increase in                          ✓$244mn in positive                  ✓5 non-core banners sold and ✓~$1bn total reduction in
  Bed Bath & Beyond banner; +2%                        Adj. Gross Margin vs LY,                     cash flow1 vs negative            >$600mn in proceeds in       Gross Debt3 : ~$0.5bn
  total enterprise growth; 2nd                         led by optimized                             cash flow LY, including              FY20: One Kings Lane, PMall,                            reduction in operating and
  consecutive quarter of Comp                          product promo/                               monetization of                      Christmas Tree Shops, Harbor                            finance lease liabilities
  Sales growth                                         coupon mgt and                               non-core banners                     Linen, and Cost Plus World                              related to banner
                                                       product mix                                                                       Market2                                                 divestitures and store
✓94% digital Comp Sales                                                                         ✓$0.8bn (30%)                                                                                    closures in Q3; ~$0.5bn
  growth in Bed Bath & Beyond                      ✓$41mn reduction in                              lower Inventory vs Q3            ✓~120 BBB store closures                                    reduction in debt from bond
  banner; 77% total enterprise                         SG&A expense from                            LY, driven in part by                planned in FY20 as part of store                        tender offers in Q2
  growth; digital drives                               cost optimization                            banner divestitures                  network optimization plans
  quarterly sales performance                          efforts                                      and store fleet                      to close ~200 BBB stores by                         ✓$0.3bn strong Net Cash
                                                                                                    optimization                         the end of FY21; will result in                         surplus position:$1.5bn in
✓36% of total Digital Sales                        ✓168% increase in Adj.                                                                significant reshape of sales base                       Cash and Equivalents less
  fulfilled by stores, including 16%                   EBITDA vs LY to                                                                   and store footprint                                     $1.2bn in bonds
  from BOPIS; new omni-always                          $121mn, led by
  capabilities gaining traction                        Gross Margin                                                                  ✓$500 to $525mn enhanced ✓$2.2bn in Total Liquidity4;
                                                       expansion                                                                         FY21 EBITDA range, driven by                            ~2x higher than bond debt
✓5% reduction in Q3 Net Sales                                                                                                            portfolio transformation and
  due to transformation activity                                                                                                         significant reshape of P&L
  including planned divestures
  and store fleet optimization

                     (1)   Cash Flow includes cash flow from operations + cash from investing activities, net of CAPEX.   (3) Gross Debt includes bonds, revolver/ABL borrowing, and operating and finance lease liabilities
 BED BATH & BEYOND   (2)   Announced definitive agreement to sell CPWM FY20 Q4.                                           (4) Total Liquidity includes cash & investments and availability from asset-backed lending credit facility.   9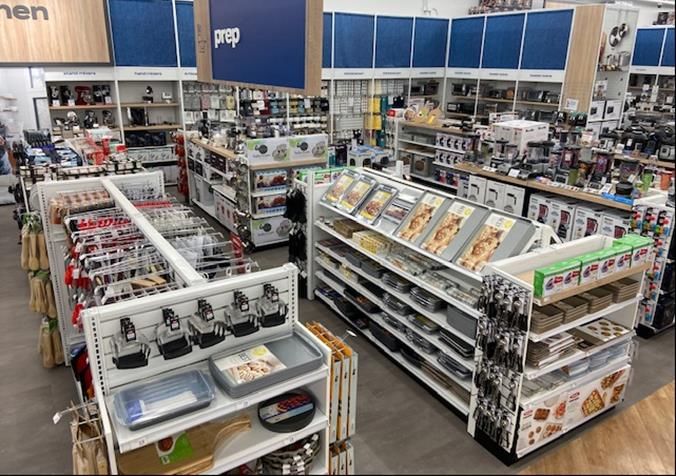
Q3 PERFORMANCE HIGHLIGHTS & TRANSFORMATION UPDATE

                                                                                                                                            Three Months Ended
• Comparable Sales increase, led by 5% growth in core Bed Bath & Beyond                                                                  FY2019 Q3      FY2020 Q3                                  Diff
  banner1 (BBB); total enterprise comp +2% growth                                      Total Enterprise Comp Sales                                                                                 2%
                                                                                                                                  1
                                                                                             Core BBB Banner Comp Sales                                                                            5%
• Digital drives Q3 performance, with strong total enterprise growth +77%;             Net Sales                                          $2,759mn              $2,618mn                          -5%
  core BBB digital growth +94%
                                                                                       Gross Margin2                                        32.3%                  35.4%                         310bps
• Net sales change of -5% as planned, due to significant portfolio
  transformation, including non-core banner divestitures and store closing
  activity related to network optimization initiative                                  SG&A                                                $932mn                $891mn                          $41mn
                                                                                                   2
                                                                                       EBITDA                                               $45mn                $121mn                           168%
                                                                                                          2
• Adj. Gross Margin increases 310bps, driven primarily by:                             EPS - Diluted                                        ($0.38)               $0.08                          $0.46
   ‐ Optimization of promotion & markdowns
   ‐ Favorable product mix                                                             Cash Flow Generation3                                                     $244mn
   ‐ Leverage of distribution and fulfillment costs                                                                   4
                                                                                       Gross Debt Reduction                                                      ($0.5bn)
   ‐ Partially offset by higher digital channel mix, including higher shipping costs
                                                                                       Total Liquidity5                                                           $2.2bn
• SG&A expense decreases ($41mn), from lower payroll & related expenses and
  lower advertising expenses                                                           (1)    Bed Bath & Beyond is among the Company’s four core banners which also include buybuy BABY,
                                                                                              Harmon Face Values and Decorist.
• Adj. EBITDA increased 168%, primarily due to higher gross margin                     (2)    Adjusted
                                                                                       (3)    Cash flow generation includes cash flow from operations ($44mn) and cash flow from investing, net
                                                                                              of capital expenditures ($200mn).
• Positive cash flow generation3 of $244mn including monetization of non-core          (4)    Gross Debt includes bonds, revolver/ABL borrowings and operating and finance lease liabilities.
                                                                                       (5)    Total Liquidity includes cash & investments and availability from asset-backed lending credit facility.
  banner assets
• Gross Debt4reduction and strengthened balance sheet
   ‐ ~($0.5bn) reduction in operating and finance lease liabilities from
        divestitures and store closures
   ‐ $1.5bn of cash & investments and $2.2bn of total liquidity5

BED BATH & BEYOND                                                                                                                                                                                       10
Q3 PERFORMANCE HIGHLIGHTS & TRANSFORMATION UPDATE
Quarterly sales trends
• Positive comparable sales growth led by strong digital comp
sales in both core Bed Bath & Beyond banner1 (BBB) and total Q3
enterprise, offsetting sales decline in stores Total Enterprise Comps 2%
• Sales momentum continued in Q3 and holiday season, in spite BBB Comps 5%
of COVID-related headwinds reflected broadly across retail Digital Comps 77%
landscape in lower foot traffic trends and shipping capacity BBB Digital Comps 94%
constraints
Percentage of digital sales
• Percentage of digital sales increased to 31% versus 19% in increased
FY 2019 Q3
FY19 Q3 FY20 Q3
19%
81%
Q3 - Stores Penetration
Digital Penetration
(1) Bed Bath & Beyond is among the Company’s four core banners which also include buybuy BABY, Harmon Face Values and Decorist.
BED BATH & BEYOND 11Q3 PERFORMANCE HIGHLIGHTS & TRANSFORMATION UPDATE
• Core Bed Bath & Beyond banner1 (BBB) delivered solid comp sales
growth of 5%, led by strong digital growth and higher sales in Top 5
destination categories
• BBB digital comp sales grew 94%; store comp sales declined 14%
• +11% comp sales growth of Top 5 destination categories (combined),
representing 2/3 of core Bed Bath & Beyond banner sales
• Market share gains in destination Bed category, with improving trends
in Bath and Kitchen categories (NPD data October/November 2020)
Top 5 Destination Categories Comp Sales Growth % of Net Sales
Home Organization 16% 6%
Kitchen Food Prep 13% 21%
Bedding 10% 19%
Bath 8% 10%
Indoor Décor 7% 9%
Total Comp Sales Growth (combined) 11% 65%
(1) Bed Bath & Beyond is among the Company’s four core banners which also include buybuy BABY, Harmon Face Values and Decorist.
BED BATH & BEYOND 12Q3 PERFORMANCE HIGHLIGHTS & TRANSFORMATION UPDATE
US Bed Bath & Beyond results were in-line or stronger than broader US retail market
US Retail Market Performance US Bed Bath & Beyond
Reported by 3rd Party Data Providers Comparable Sales Performance4
In-Store Traffic Online Spending In-Store Traffic Online Spending
(2)
Black Friday -52% (1) +22%
vs LY vs LY Total Comp
5-day
-24% vs +69% vs Sales Demand5
holiday period
(2) LY LY +double-digit%
Cyber Monday +15% Thanksgiving to
vs LY
Cyber Monday
vs LY
(1)
6-week -34-36% 6-week Total Comp
-23% vs +95% vs Sales
holiday period vs LY holiday period
LY
Nov. 15 – Dec. 27 Nov. 16 – Dec. 27 LY +low-single digit%
vs LY
8-week Total Retail Sales
holiday period +2% (3)
Nov. 1 – Dec.
25
vs LY
(1) According Sensormatic Solutions data. (4) Based on preliminary unaudited results.
BED BATH & BEYOND (2) According to Adobe Analytics data. (5) Bed Bath & Beyond comp sales demand includes orders placed and not yet fulfilled. 13
(3) According to Mastercard Spending Pulse report.Q3 PERFORMANCE HIGHLIGHTS & TRANSFORMATION UPDATE
• Adj. Gross Margin increases 310bps to 35.4% vs 32.3% LY, FY19 Q3vs FY20 Q3 – gross margin bridge
driven primarily by:
210bps
‐ Optimization of promotion & markdowns
‐ Favorable product mix
‐ Leverage of distribution and fulfillment costs
‐ Partially offset by higher digital channel mix, including higher 120bps
shipping costs
180bps
35.4%
(200bps)
32.3%
310bps
Leverage of Channel Mix /
FY19 Q3 Promotion & Product Distribution/ FY20 Q3
Adj. Gross Markdowns/ DTC Shipping Adj. Gross
Mix Fulfillment Expense
Margin Coupon Mgt Costs Margin
BED BATH & BEYOND 14Q3 PERFORMANCE HIGHLIGHTS & TRANSFORMATION UPDATE
Q3 actions maintained strong cash position:
FY20 Q2 vs FY20 Q3 – total liquidity
Solid cash flow generation of $244mn
• Cash flow from operations of $44mn from earnings and
$200mn
working capital improvement $2.2bn
$44mn
$2.2bn
• Cash flow from investing of $200mn includes net proceeds
$0.7bn
from non-core asset sales (Christmas Tree Shops, Harbor $0.7bn ($227mn)
Linen and DC in Florence, NJ), net of $38mn of CAPEX $0.3bn
spending
Strong total liquidity $1.2bn $0.9bn
$1.5bn $244mn $1.5bn
• Maintained $1.5bn cash & investments balance, even after Positive Cash Flow
$225mn ASR
FY20 Q3 vs FY19 Q3 – positive cash flow generation
($mns) FY2020 Q3
Cash Flow from Operating Activities $44 Post FY20 Q2 Cash Flow from Cash Flow from Cash Flow from FY20 Q3
Total Liquidity
1 Total Liquidity Operations Investing 1 Financing 2
Cash Flow from Investing Activities $200
Cash Flow Generation $244
Cash and Investments ABL ASR
2
Cash Flow from Financing Activities ($227)
BED BATH & BEYOND (1) Cash Flow from Investing includes $238mn related to sale of non-core assets (CTS, HL, DC/Florence), net of $38mn of CAPEX; CPWM definitive agreement announced FY20 Q4. 15
(2) Cash Flow from Financing includes $225mn related to ASR initiated in Oct. 2020.Q3 PERFORMANCE HIGHLIGHTS & TRANSFORMATION UPDATE
$0.2bn
$0.2bn
FY20 Q2 vs FY20 Q3 – gross debt
$0.2bn
• Actions taken to reduce gross debt1 balance by ~$1bn: $0.2bn
‐ Reduction in operating and finance lease liabilities by $3.6bn
~$0.5bn in Q3 (non-core banner divestitures and store $3.1bn
closures)
($0.5bn)
‐ Reduction in debt by ~$0.5bn in Q2 (bond tender offers, $2.4bn $1.9bn $2.2bn
revolver/ABL borrowings) $1.9bn $0.7bn
$1.5bn
• Positive net cash position with $1.5bn cash balance, less $1.2bn $0.3bn
$1.2bn in bond debt $1.2bn $1.2bn $1.5bn
• Strong total liquidity2 position of $2.2bn
Operating FY20 Q3
FY20 Q2 FY20 Q3 FY20 Q3 FY20 Q3
& Finance FY20 Q3 Gross Debt
Gross Debt1 Gross Debt Net Cash Total
Lease Cash Balance ex
Balance Balance Balance Liquidity
Liabilities Balance Op/Fin
Leases
$1.5bn
Senior Notes Operating & Finance Cash & Investments ABL
Lease Liabilities
(1) Gross Debt includes bonds, revolver/ABL borrowing, and operating lease liability.
BED BATH & BEYOND (2) Total Liquidity includes cash & investments and availability from asset-backed lending credit facility. 16Q3 PERFORMANCE HIGHLIGHTS & TRANSFORMATION UPDATE
significant portfolio transformation during fiscal 2020
what we said 6 mos. ago
Expect to unlock between $350 to $450mn through asset sales
what we have achieved
Non-core banner
$600mn+ monetization 5 Banners
(and Florence, NJ divested1
warehouse)
where we are today
Focused on
4 core portfolio
(1) Cost Plus World Market definitive agreement announced FY20 Q4.
BED BATH & BEYOND 17Q3 PERFORMANCE HIGHLIGHTS & TRANSFORMATION UPDATE
Capital Allocation Principles Reiterate Additional Accelerated Share Repurchase Program
✓ Investing for growth and transformation • Expanded Total Share Repurchase Program (ASR) to up to
$825mn from up to $675mn during the next 3 years
✓ Ensuring financial resilience
• October 28th: Launched $225mn Accelerated Share Repurchase
✓ Returning cash to shareholders program (ASR-1)
• December 14th: Announced Approval of new $150mn
Accelerated Share Repurchase program (ASR-2)
• ASR 1+2, which total $375mn, are expected to be completed by
no later than fiscal year-end 2020
• Reflects balanced capital allocation principles, strong liquidity and
confidence in strategic growth plan
Note: ASR-1($225mn): 4.5mn shares delivered in FY20 Q3; Remainder expected to be delivered by 1/28/21.
BED BATH & BEYOND ASR-2 ($150mn): Expected to be initiated and be completed in FY20 Q4. 18BED BATH & BEYOND 19
FINANCIAL OUTLOOK

                                       portfolio transformation is now complete1

                                 Tightening                                                   Reiterating         Enhancing
                               Revenue Range                                                 Gross Margin     EBITDA to a Range

                                   $8.0bn                                                   Approx.             $500mn
                                     to                                                      35%                  to
                                   $8.2bn                                                       +200bps         $525mn
                    Recapture & Sustain Sales                                              vs Proforma FY19    vs Proforma FY19
                            vs FY20                                                              of 33%            of $425mn
                    (1)   Cost Plus World Market definitive agreement announced FY20 Q4.
BED BATH & BEYOND                                                                                                                 20
FINANCIAL OUTLOOK
• Expect approx. $3bn reduction in net sales vs FY 2019 after banner divestitures and store closures
- 5 banner divestitures1:
- >500 store closures planned (including 340 from divestitures and 200 from store network optimization
by the end of FY 2021)
FY 2021 Comparable Sales Guidance: Recapture & Sustain Sales
• Q1 (non-comp): RECAPTURE full sales opportunity vs prior year sales impact from store closures due to COVID-19
• Q2-Q4: SUSTAIN sales level vs FY20 strong base
• Guidance assumes flat comparable sales for financial planning purposes
Net Sales bridge Base 2019
($2.2bn)
($0.9 bn)
$11.2bn
$9.0bn $8.0bn
to
$8.2bn
2019 Non-Core FY2019 FY2021
Store Closure
Actual Asset Divestitures Proforma Projected
Impact
Net Sales Impact Net Sales Net Sales
# of retail stores: 1,500 ~1,100 ~960
(1) Cost Plus World Market definitive agreement announced FY20 Q4.
BED BATH & BEYOND 21
Notes: Numbers may not add due to rounding; for illustrative purposes only.FINANCIAL OUTLOOK
Gross Margin bridge SG&A bridge
+ - $3.6bn ($0.8bn)
+ - $2.8bn $2.5bn
+ - + -
35% 32% 31% - 31%
33% 33%
2019 Actual Non-Core FY2019 Store SG&A Reinvest. Reduction FY2021
2019 Actual FY2019 Margin Product Mix Promotion & Channel FY2021 SG&A Asset Proforma Closure Cost in Projected
Gross Proforma Improv. Including Markdowns/ Shift & Projected Divestitures SG&A Impact Restructuring Depreciation SG&A
Margin Gross From Own Brands Coupon Mgt Increased Gross Impact Programs & Amort.1
Margin Product Freight Margin
Sourcing Cost
Impact
(1) Fiscal 2021 Depreciation & Amortization estimated to be approximately $230 million.
BED BATH & BEYOND Notes: Numbers may not add due to rounding; for illustrative purposes only. 22FINANCIAL OUTLOOK
EBITDA bridge – key drivers of expansion (approximate figures)
$235mn ($175mn)
-
+ ($175mn)
$125mn
+ -
$75mn
- +
$500mn
$465mn $425mn to
$525mn
2019 Actual Non-Core FY2019 Store Merchandising SG&A Cost Reinvestment Channel FY2021
EBITDA Asset Proforma Closure Improv From Restructuring Spend Shift & Projected
Divestitures EBITDA Impact Product Programs Increased EBITDA
Sourcing Freight
Cost
Impact Mid-single-digit
5%
Margin Margin
Memo: Fiscal 2021 Depreciation & Amortization is estimated to be approximately $230 million.
BED BATH & BEYOND Notes: Numbers may not add due to rounding; for illustrative purposes only. 23FINANCIAL OUTLOOK
FY2020 actions reduce liabilities by ~$1bn $0.2bn ~$4bn
$0.2bn
• ~$0.5bn reduction in gross debt from bond tender offers $0.2bn
in FY20 Q2 ~($0.5bn) ~$3bn
• ~$0.5bn reduction in operating and finance lease liabilities $2.4bn
from banner divestitures and store closures (FY20 Q3+Q4) ~($0.5bn)
$1.9bn
~$1b reduction
$1.5bn $0.2bn
$1.2bn
FY19 Change in FY 2020 Projected
Change in
Debt/Lease Operating & Debt/Lease
Debt
Liabilities Finance Lease Liabilities
Q2
Liabilities
Q3
$1.5bn
Operating and Finance Bond debt
Lease Liabilities
Notes: Numbers may not add due to rounding; for illustrative purposes only.
BED BATH & BEYOND 24FINANCIAL OUTLOOK
• ~$1bn (at retail) inventory reduction underway:
~$.5bn reduction at cost
‐ non-core asset divestitures (~$1bn at retail) reduction
‐ store closures from fleet optimization
$2. 1bn
$1.6bn
FY21
FY19
Projected
Inventory
Inventory
Balance
Balance
Notes: Numbers may not add due to rounding; for illustrative purposes only.
BED BATH & BEYOND 25FINANCIAL OUTLOOK
Fiscal 2021
Outlook Update
• Providing additional visibility on P&L reshape after planned
divestitures and store closures comp sales Recapture & Sustain sales
• Enhancing FY 2021 EBITDA outlook to range of between Q1 (non-comp): Recapture lost sales opportunity
$500mn to $525mn from store closures in 2020 due to COVID-19
Q2-Q4: Sustain sales level vs FY20 strong base
significant and fast-paced gross margin ~35%
portfolio transformation adj. EBITDA $500mn to $525mn
FY21 vs FY19 adj. EBITDA margin mid-single digit
~500 5
capital investments $400mn+
$1bn reduction (at retail)
inventory position
store closures banner divestitures1 vs. FY19
from 1,500 to ~960 from 9 to 4 gross debt/
EBITDA ratioBED BATH & BEYOND 27
DIGITAL & COMMERICAL UPDATE

• Digital comparable sales up 77%; core Bed Bath & Beyond
  banner digital sales +94%

• 2.2mn new customers to digital

• ~21% of Bed Bath & Beyond customers placing 2+ orders
  vs 16% in FY19 Q3

• Online conversion for Bed Bath & Beyond improved 25%
  vs. FY19 Q3

• ~36% of total digital sales fulfilled by stores

• Buy Online Pickup in Stores (BOPIS) accounted for ~16%
  of total digital sales

                    (1)   Based on current trends.
BED BATH & BEYOND                                           28
DIGITAL & COMMERICAL UPDATE
BOPIS Net Promotor
BOPIS percentage of
Score vs. 49% in May
total digital sales
(when service launched)
BOPIS orders ready customers used
within 30 minutes BOPIS in FY20 Q3
BED BATH & BEYOND 29DIGITAL & COMMERICAL UPDATE
Available on Bed Bath & Beyond.com and buybuyBABY.com 3-step checkout reduced time to place order
2 Marketplaces – Instacart.com and Shipt.com Overhauled entire checkout journey
HarmonFaceValues.com added to Instacart Added new payment types
(Homepage)
of US households have increase in cart
access to Instacart and conversion rate YoY
Shipt marketplaces
BED BATH & BEYOND 30DIGITAL & COMMERICAL UPDATE
12/5/20
New digital customers visits, growing 50% YoY
12/5/20
Increase in Net
Promoter Score app downloads
for digital YoY
12/5/20
JANUARY 6, 2021
BED BATH & BEYOND 31BED BATH & BEYOND 32
OPERATIONS UPDATE
✓ Supply chain reformation
▪ Added secondary national carrier and several regional parcel delivery carriers to help alleviate
COVID-related shipping constraints and additional freight cost pressures
▪ Continued to focus on health & safety of associates working fulfillment centers
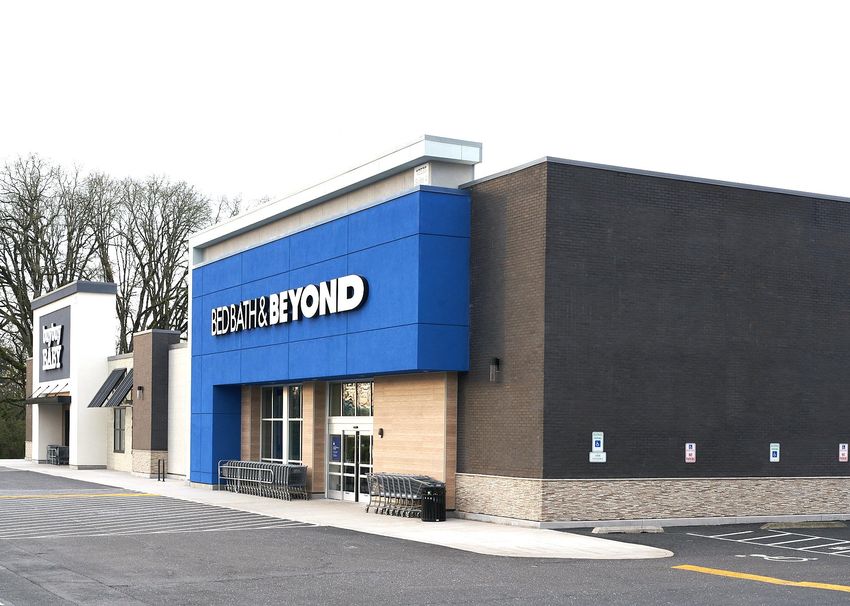
✓ Optimizing real estate portfolio
▪ Store network optimization program: closure of ~200 underperforming Bed Bath & Beyond
banner stores is well underway
o Pace of targeted closings in fiscal 2020 has accelerated from ~70 to ~120 stores
o Remain on track to complete full 200 store closure program during fiscal 2021
▪ Store remodel program: advanced from initial prototype phase to active iteration within 10
stores in Houston markets
o Highlighting destination categories including Bed, Bath, Kitchen and Store & Organization
o Expect to complete proof-of-concept stage by end of February 2021;
Next wave of renovations to include 130 to 150 stores in fiscal 2021
o Total investments of $250mn over the next 3 years in store remodels of >450 stores,
representing 60% of revenue
BED BATH & BEYOND 33OPERATIONS UPDATE
BEDDING HUB BATH
KITCHEN
BED BATH & BEYOND 34OPERATIONS UPDATE
• Represented 10% of total Company net sales in FY20 Q3
• Strong growth in digital, up 40%, representing >50% of
total BABY sales
• Enhanced digital experience with convenient payment
options, including After Pay and Apple Pay; upgraded and
relaunched BABY app in November 2020
• Gained nearly 2mn online customers YTD, +45%; >.5mn
new online customers in FY20 Q3
• New omni-channel capabilities such as BOPIS/curbside
services represented 13% of total BABY digital orders in
FY20 Q3
• Top performing categories in Q3 include Toys, Playroom,
Furniture and Apparel
BED BATH & BEYOND 35BED BATH & BEYOND 36
Q3 TOTAL ENTERPRISE SUMMARY

                    (1)   Cash flow generation includes cash flow from operations ($44mn) and cash flow from investing driven by proceeds from non-core banners and real estate monetization, net of capital expenditures ($200mn).
BED BATH & BEYOND                                                                                                                                                                                                                     37
JANUARY 6, 2021 BED BATH & BEYOND 38
APPENDIX

(in thousands, except for share data)
(unaudited)

                    * The Company is presenting certain non-GAAP financial measures for its fiscal 2020 third quarter. In order for investors to be able to more easily compare the Company’s performance
BED BATH & BEYOND   across periods, the Company has included comparable reconciliations for the 2019 periods in the reconciliation table above and that follow.                                             39
APPENDIX
(in thousands, except for share
data) (unaudited)
* The Company is presenting certain non-GAAP financial measures for its fiscal 2020 third quarter. In order for investors to be able to more easily compare the Company’s performance
BED BATH & BEYOND across periods, the Company has included comparable reconciliations for the 2019 periods in the reconciliation table above and that follow. 40APPENDIX
(in thousands, except for share data)
(unaudited)
* The Company is presenting certain non-GAAP financial measures for its fiscal 2020 third quarter. In order for investors to be able to more easily compare the Company’s performance
BED BATH & BEYOND across periods, the Company has included comparable reconciliations for the 2019 periods in the reconciliation table above and that follow. 41APPENDIX
(in thousands, except for share
data) (unaudited)
* The Company is presenting certain non-GAAP financial measures for its fiscal 2020 third quarter. In order for investors to be able to more easily compare the Company’s performance
BED BATH & BEYOND across periods, the Company has included comparable reconciliations for the 2019 periods in the reconciliation table above and that follow. 42APPENDIX BED BATH & BEYOND 43
You can also read