Investor Presentation - September 2018 - American Axle
←
→
Page content transcription
If your browser does not render page correctly, please read the page content below
Investor Presentation
September 2018

Forward Looking Statements
This presentation contains forward-looking statements within the meaning of the Private Securities Litigation Reform Act of 1995. These forward-looking
statements involve certain risks and uncertainties that could cause actual results to differ materially from those expressed or implied by these
statements. These risks and uncertainties include factors detailed in the reports we file with the SEC, including those described under “Risk Factors” in our
most recent Annual Report on Form 10-K and our Quarterly Reports on Form 10-Q. These forward-looking statements speak only as of the date of this
communication. We expressly disclaim any obligation or undertaking to disseminate any updates or revisions to any forward-looking statement contained
herein to reflect any change in our expectations with regard thereto or any change in events, conditions or circumstances on which any such statement is
based.

It should also be noted that this presentation contains certain financial measures, including Adjusted EBITDA, Adjusted Earnings per Share, Adjusted Free Cash
Flow, and Net Leverage Ratio that are not required by, or presented in accordance with, accounting principles generally accepted in the United States, or GAAP.
These measures are presented here to provide additional useful measurements to review our operations, provide transparency to investors and enable period-
to-period comparability of financial performance. A description of non-GAAP financial measures that we use to evaluate our operations and financial
performance, and reconciliation of these non-GAAP financial measures to the most directly comparable financial measures calculated and reported in
accordance with GAAP, can be found in the appendix under “Reconciliation of Non-GAAP Measures”.

                                                                                                                                                                  2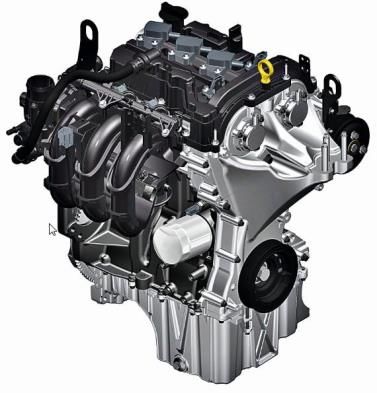
About AAM
                                                                                     Over

                   AAM is a premier, global leader in design, engineering,           75
                  validation and manufacturing of driveline, metal forming,     MANUFACTURING
                                                                                  FACILITIES
                    powertrain and casting technologies for automotive,
                              commercial and industrial markets

   $7B
PRO FORMA SALES

     Over         AAM is Delivering POWER through world-class quality,
    700             technology leadership and operational excellence                 16
                                                                              ENGINEERING CENTERS
  CUSTOMERS

     Over                                                         Over

 25,000                                     17
                                          COUNTRIES
                                                                  90
  ASSOCIATES                                                    LOCATIONS

                                                                                                    3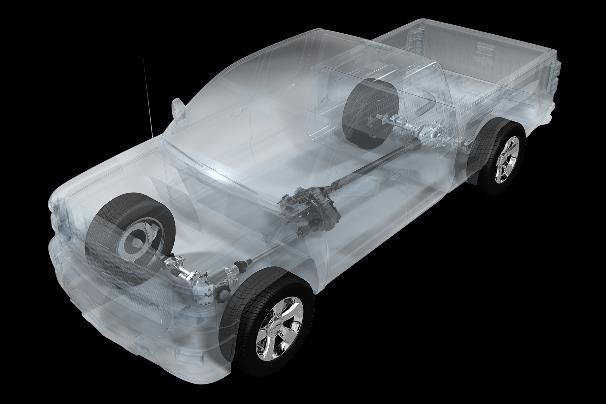
Strong Financial Performance
                                                              SALES                                                                                            ADJUSTED EBITDA * MARGIN

 $8.0                                                                                                                                                                                           17.5%-
                                                                                                              $7.2 -7.2
                                                                                                                     $7.25**
                                                                                                                                                                                       17.6%   17.75%**
                                                                                                                                              18.0%
 $7.0
                                                                                                 $6.3
                                                                                                                                              17.0%
 $6.0                                                                                                                                                                          15.7%
                                                                                                                                              16.0%

 $5.0
                                                                                                                                              15.0%
                                                                                                                                                                       14.6%
                                     $3.7                $3.9                     $3.9                                                                         13.9%
 $4.0
                 $3.2                                                                                                                         14.0%    13.2%
                                                                                                                                              13.0%
 $3.0
                                                                                                                                              12.0%
 $2.0
                                                                                                                                              11.0%

 $1.0
                                                                                                                                              10.0%

  $-                                                                                                                                            9.0%
                2013                2014                 2015                 2016               2017                2018E                             2013    2014    2015    2016    2017    2018E
                                                            Dollars in billions

                                       AAM has been growing sales while delivering industry-leading profitability
* For definitions of terms and Non-GAAP reconciliations, please see the attached appendix **Mid point of the 2018 target used for charting purposes
                                                                                                                                                                                                          4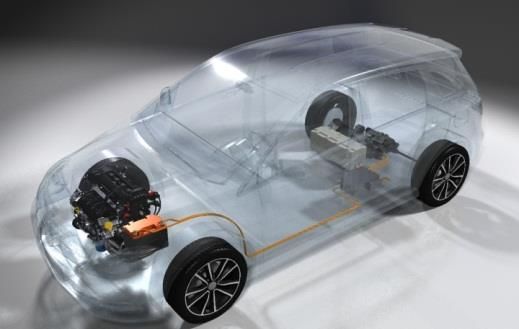
Strong Financial Performance
                                      ADJ. FREE CASH FLOW*                                                               NET LEVERAGE RATIO *
      $400
                                                                                                   ≈5% of
                                                                                                    Sales
                                                                                            $341            3.5   3.3
      $350

                                                                                                            3.0
                                                                                                                                              2.9
      $300
                                                                                                                         2.5
                                                                                                            2.5
      $250
                                                                                                                                                      ≈2
                                                         $190               $199                            2.0
                                                                                                                                1.9
      $200

                                                                                                                                       1.5
                                                                                                            1.5
      $150
                                       $123
      $100                                                                                                  1.0

       $50                                                                                                  0.5
                      $4
        $-                                                                                                   -
                    2013               2014               2015               2016           2017   2018E          2013   2014   2015   2016   2017   2019E
                                                               Dollars in millions

                                                Strong free cash flow growth generation and net leverage reduction
* For definitions of terms and Non-GAAP reconciliations, please see the attached appendix                                                                    5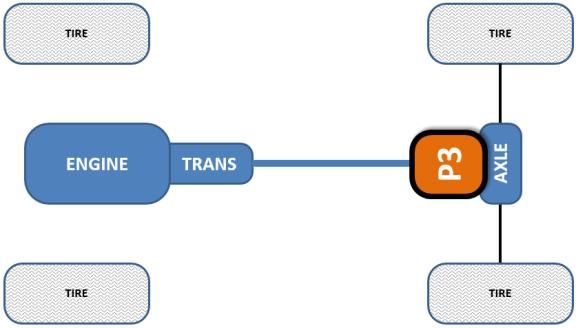
Business Units and Market Leadership
DRIVELINE | $4.0B POWERTRAIN | $1.1B
#1 Globally - Full-Size Pickup Trucks and SUV #1 Globally
driveline systems Powder metal connecting rods
#1 North America and #2 China AWD Systems Damped gears and rubber isolation pulleys
for crossovers Viscous dampers for passenger cars
Pioneer of Disconnecting AWD systems #1 North America - Aluminum valve bodies
METAL FORMING | $1.5B CASTING | $900M
Largest automotive forger in the world Leading automotive iron casting operations
#1 Globally - Differential gears, axle shafts, #1 North America ductile iron casting supplier
hypoid pinions and ring gears #1 / #2 North America - Differential carriers and
#1 North America - Transmission gears and cases, steering knuckles, control arms and
CVT pulleys brake calipers
*Note: Market leadership based on company estimates as compared to other independent suppliers, business unit sales based on estimated 2017 pro forma amounts before eliminations of intercompany sales of approximately $0.5 billion 6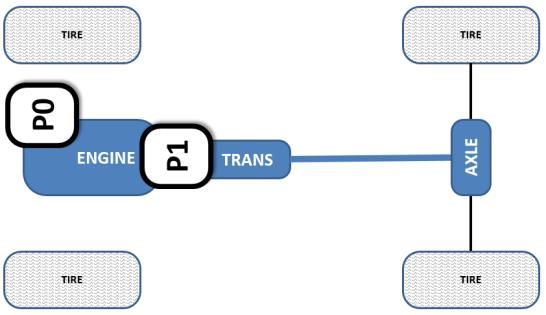
AAM Growth Opportunities
New and Incremental Business Backlog
                           $1.5 BILLION: 2018-2020          as disclosed on January 17, 2018

            Backlog by Vehicle Segment                  Backlog by Global Market
Commercial and                                                                                       South America and
  Other 5%                                                                                               other 5%
                             Passenger
              Full-size      Cars 15%                        Asia 20%
             Light Truck
              and SUV
                25%

                                                      Europe 15%

                                                                                         North America
                             Crossover                                                        60%
                            Vehicles 55%

            40% of our New Business Backlog is in markets outside of North America
                                                                                                                         8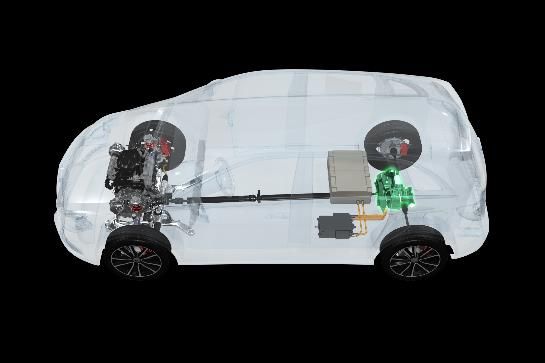
Revenue Diversification
         AAM 2016 Sales by Customer                2016 Sales by Region                     2016 Sales by BU
 Other
 Top 15           Other
 Global                                                                                       Metal
                   8%
 OEMs                                                                                        Forming
   6%                                                                                          13%
            FCA                                     North             Asia
            18%                                    America            10%      Europe
                            GM                      84%                          3%
                            67%
  Ford                                                                       Other
   1%                                                                         3%                        Driveline
                                                                                                          87%

         AAM 2020E Sales by Customer                2020E Sales by Region                   2020E Sales by BU

                                                                                              Casting
                           GM                                        Asia                      12%
               Other
                           31%                                       11%
               27%
                                                   North                                Powertrain
                                                                      Europe              17%                  Driveline
                                                  America              10%                                       51%
                                                   76%
Other                       Ford                                                             Metal
Top 15                                                                         Other
                            14%                                                             Forming
Global              FCA                                                         3%
                                                                                              20%
OEMs                15%
 13%

                              AAM experiencing diversification and growth in many areas
                                                                                                                           9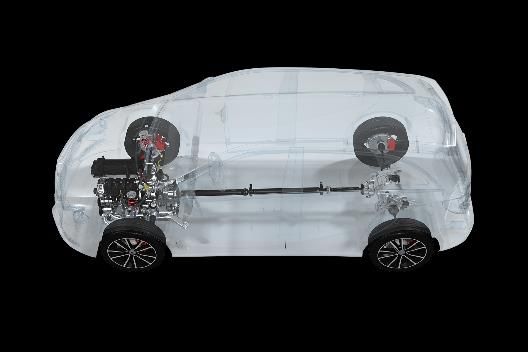
China Continues to Drive Growth for AAM
AAM China Sales Current growth driven by:
≈$700
Demand for crossover vehicles, luxury
passenger cars and LCVs
JV partnerships (Liuzhou AAM and HAAM)
$440 New business awards in our backlog:
Differential assemblies (SAIC-GM)
$275 Power Transfer Units (Foton, SAIC-GM, CAF)
Isolation Pulleys (Geely and Renault)
Rubber Dampers (Chery)
Transmission Valve Bodies (Wanliyang)
Balance Shaft Assemblies (CAF and SAIC)
Transmissions Shafts and Gears (Volkswagen)
2014 2017 2020E Connecting Rods (SAIC)
Dollars in millions
* Includes revenues of unconsolidated joint ventures 10Exponential Growth in Europe
AAM Europe Sales Current growth driven by:
≈$700 MPG acquisition
Added Metal Forming operations
$480 Strong Powertrain presence
New business launches
Two new e-AAM program launches
$100
Global crossover program begins production
Growing relationships with Daimler, JLR,
Ford, Renault, and BMW
2014 2017 2020E
Dollars in millions
11Global Growth Beyond 2020
60% of AAM’s $1.5 billion quoting and emerging business opportunities are
outside of North America*
Hybridization will drive additional Powertrain content
Increased demand for our e-AAM products to support higher electric vehicle
production, especially in Europe and China
Increased global Metal Forming presence
Further leveraging joint venture partnerships
AAM’s multi business unit strategy for global growth features many innovative technologies
* As disclosed in June 2018 12Technology Leadership
AAM Technology Leadership

    ICE                  HYBRID          ELECTRIC (BEV)

                AAM ENGINEERING COMPETENCIES
   Efficiency           Customer Value             Lightweighting

           Performance/NVH               Power Density
                                                                    14
EcoTrac Continues to Drive Profitable Growth
2013 2017 ≈$800M
2020
47%
$550M in 2018 CAGR
Cherokee Terrain/Equinox
Currently Launching
$55M in 2013
Edge/Nautilus Cadillac XT4
Featured on several significant global crossover platforms
15QUANTUM™ Technology
QUANTUM | Features all-new, completely redesigned
family of lightweight axles and drive units
KEY ATTRIBUTES
Industry first technology along with a revolutionary design
Significant mass reduction (up to 35%)
QUANTUM™ in Light Duty Truck
In combination, additional efficiency and weight reduction can deliver 1% to
1.5% improved vehicle fuel economy
Scalable across multiple applications - without loss of performance or power
Streamlined manufacturing process for key driveline components
QUANTUM™ RDU w/ eLSD QUANTUM™ Rear Axle
Recently awarded inaugural Altair Enlighten Future of Lightweighting Award!
16Key Fuel Efficiency Trends Benefit AAM
Downsized Engines Multi-speed Transmissions
Crankshaft Dampers & Isolation Pulleys
Balance Shaft Systems 10 Speed Transmission
3 Cylinder Engine
Transmission Components
Damped Gears
Demand for fuel efficiency gains is driving powertrain conversions,
leading to additional AAM content-per-vehicle opportunities of over $100
17TM
e-AAM Hybrid and Electric Driveline Systems
e-AAM driveline systems | Position AAM to
benefit from the global trend of electrification
KEY ATTRIBUTES
Highly integrated electric motor, gear reduction, & differential AAM P4 Rear e-Drive unit (Hybrid)
Power dense, low NVH, high efficiency design allows for
easy integration for multiple vehicle platforms
Modular solutions for passenger cars / crossovers to provide
economies of scale
Optional features for performance and functionality
AAM P4 e-Drive units (e-AWD BEV)
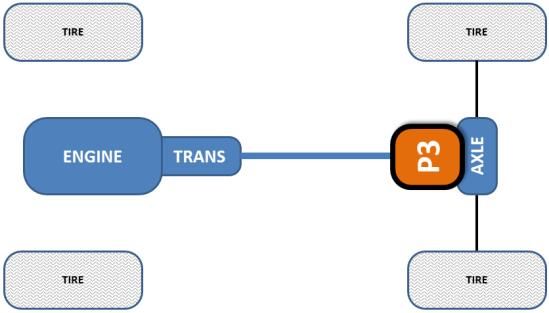
18Hybrid and Electric Vehicle Architectures
P0/P1 P2 P3 P4
AAM Content AAM Content AAM Content AAM Content
Conventional AAM Content New Electrification AAM Content
AAM content is featured across all hybrid and electric vehicle architectures
19AAM’s Capabilities for Hybrid and Electric Vehicles
P3 P4
P0, P1 and P2 are fully supported by
AAM’s conventional content.
Our e-AAM investments have been
focused on P3 and P4 solutions as
growth opportunities.
Launching Launching
Conventional AAM Content eDrive in E-Systems eDrive in
New Electrification AAM Content 2020 Integration 2018
Content per vehicle opportunities of $500 - $2,500+ for P3 and P4 applications
20AAM and Electrification | Current State
>5% $100M - $200M >$1B
of our 2018 – 2020 Backlog Revenue by 2021 Booked Revenue
e-AAM is becoming an Launching two sizable Revenues of awarded
increasing part of our new electrification programs with business through lifetime of
business backlog premium global OEMs the booked programs
AAM is benefiting from early investments in electrification
21AAM and Electrification | Future State
RAPID GROWTH ≈ $500M * 25% - 30%
Total Addressable Market New Business Opportunities Expected Win Rate
Approximately 1/3 of AAM’s
Based on AAM’s technology
Estimated TAM for e-Drive current $1.5 billion quoted and
and customer interest, we
units expected to grow from emerging new business
expect to achieve our normal
$2 billion today to $10 billion opportunities relate to our
win rate on new e-Drive
by 2025 e-AAM products across Asia,
business opportunities
Europe and North America
We expect e-AAM quoting activity to continue to expand and deliver significant organic growth
* As disclosed in June 2018 22Financial Overview
2Q 2018 AAM Highlights

                                       $1.90B                                                $348M                    $100M
                                                                                             18.3% of sales
                                            Record                                             Record                 Adjusted
                                           Quarterly                                          Quarterly               Free Cash
                                            Sales                                            Adj. EBITDA*               Flow*

                                             AAM                                                         Sold
                                                                                                                                  Prepaid $100M
                                         Recognized as                                               Aftermarket
                                                                                                                                  of Senior Notes
                                          Fortune 500                                               division of our
                                                                                                                                     due 2022
                                           Company                                                  Powertrain BU
                                                                                                                                                    24
* For definitions of terms and non-GAAP reconciliations, please see the attached appendix.
AAM’s 2018 Financial Targets
As of August 3, 2018
2018 Full Year Targets
Sales $7.2 - $7.25 billion
Adjusted EBITDA* Margin 17.5% - 17.75% of sales
Adjusted Free Cash Flow* ≈ 5% of sales
Based on the anticipated launch schedule of our new business backlog and our assumption that the US SAAR* is in the
range of 16.8 to 17.0 million units.
Adjusted Free Cash Flow target assumes capital expenditures of ≈ 8% of sales. Elevated capital spending in 2018
reflects significant new and replacement program launches.
We estimate approximately $50 to $75 million of restructuring and acquisition-related costs (net of related gains) and
payments during 2018. The impact of these have been excluded from our Adjusted EBITDA and Adjusted Free Cash
Flow targets.
AAM expects another record year in 2018
* For definitions of terms, please see the attached appendix 25Synergy Achievement Progress from MPG Acquisition
Public Company
Purchasing
Synergy Achievement Gauge
(Annual Run Rate in millions)
Costs and
Power and
Overhead
AAM Know-How
Rationalization
$40 M $60 M
Vertical
Targeted Cost
Integration
Reduction
Benefits and
Synergies - Run
Manufacturing 1Q 2019 Target
Rate by 2020 $120 million
Initiatives
$40 M = $140 M 2020 Target
$140 million
AAM has a clear path to meeting its updated synergy targets
26Cash Flow
ALIGNMENT
>$800M >$1.5B
Cash Flow is the SOLE operational
financial metric for the 2018 LTI
Management Performance Awards
≈5% of Sales
$341M
2017 Adjusted Free Cash Flow* Targeted 2018 Adjusted FCF 2019E - 2020E Adjusted FCF Projected Cumulative Adj. FCF
(FCF) 2017 - 2020E
Strong cash flow potential and high free cash flow yield
* For definitions of terms and Non-GAAP reconciliations, please see the attached
27Cash Flow Breakeven
US SAAR (units in millions)
Highly variable cost structure allows for
flexibility during periods of lower volumes
25-30% downturn
17.2
AAM has track record of reducing fixed costs
through facility and labor efficiency initiatives
during previous downside periods
≈12
Multiple options available to manage to
additional potential change in volumes,
including SG&A, capital spending, R&D etc.
Continued synergy attainment and productivity
2017E Breakeven
initiatives further reduce breakeven points
AAM has a very flexible cost structure
28Capital Allocation
Leverage Reduction Organic Growth
AAM has paid down >$300M Invest in R&D and continue organic
of gross debt over last 12 months growth with the appropriate returns
Strategic Shareholder Activity
Focus on objectives of technology, At the appropriate time, other
portfolio positioning, diversification options that may benefit our
and growth shareholders further
Capital allocation aligned with strategic objectives of AAM
29Why AAM?
SOLID FOUNDATIONAL Concentrated in the strongest vehicle segments
BUSINESS of light trucks, SUVs and crossovers
INNOVATIVE TECHNOLOGY Focused on hybridization, electrification,
LEADERSHIP lightweighting, fuel efficiency and performance
Potential for
COMPELLING GROWTH Driven by our new business backlog, innovative Multiple
AND DIVERSIFICATION advanced technologies and global footprint
Expansion
INDUSTRY LEADING Fueled by powerful vertical integration, productivity and Share
PROFITABILITY initiatives and operational excellence
Appreciation
POWERFUL CASH Strong free cash flow yield while funding
GENERATOR investments in profitable growth opportunities
30Q&A
SUPPLEMENTAL DATA
Reconciliation of Non-GAAP Measures
In addition to the results reported in accordance with accounting principles generally
accepted in the United States of America (GAAP) included within this presentation, we
have provided certain information, which includes non-GAAP financial measures.
Such information is reconciled to its closest GAAP measure in accordance with
Securities and Exchange Commission rules and is included in the following slides.

Certain of the forward-looking financial measures included in this presentation are
provided on a non-GAAP basis. A reconciliation of non-GAAP forward-looking financial
measures to the most directly comparable financial measures calculated and
presented in accordance with GAAP is not practical given the difficulty of projecting
event driven transactional and other non-core operating items, as well as accounting
adjustments related to recent tax reform and their related effects in any future period.
The magnitude of these items, however, may be significant.

                                                                                           33
Supplemental Data
Earnings before Interest, Income Taxes, Depreciation and Amortization (EBITDA) and Adjusted EBITDA
($ in millions)
2017 2016 2015 2014 2013
Net income $ 337.5 $ 240.7 $ 235.6 $ 143.0 $ 94.5
Interest expense 195.6 93.4 99.2 99.9 115.9
Income tax expense (benefit) 2.5 58.3 37.1 33.7 (8.2)
Depreciation and amortization 428.5 201.8 198.4 199.9 177.0
EBITDA $ 964.1 $ 594.2 $ 570.3 $ 476.5 $ 379.2
Restructuring and acquisition-related costs, debt
refinancing and redepemtion costs and non-recurring items 138.6 25.2 0.8 35.5 42.6
Adjusted EBITDA 1,102.7 $ 619.4 $ 571.1 $ 512.0 $ 421.8
as % of net sales 17.6 % 15.7 % 14.6 % 13.9 % 13.2 %
34Supplemental Data
EBITDA and Adjusted EBITDA for the Trailing Twelve Months Ended December 31, 2017
($ in millions)
Trailing Twelve
Quarter Ended Months Ended
March 31, June 30, September 30, December 31, December 31,
2017 2017 2017 2017 2017
Net income $ 78.4 $ 66.3 $ 86.3 $ 106.5 $ 337.5
Interest expense 25.5 56.9 57.5 55.7 195.6
Income tax expense (benefit) 7.5 2.4 5.7 (13.1) 2.5
Depreciation and amortization 56.1 124.6 122.6 125.2 428.5
EBITDA, as defined $ 167.5 $ 250.2 $ 272.1 $ 274.3 $ 964.1
Restructuring and acquisition-related costs 16.0 51.7 22.8 20.2 110.7
Debt refinancing and redemption costs __ 2.7 __ 0.8 3.5
Non-recurring items: __
Acquisition-related fair value inventory adjustment __ 24.9 __ __ 24.9
Other __ (3.8) 2.9 0.4 (0.5)
Adjusted EBITDA $ 183.5 $ 325.7 $ 297.8 $ 295.7 $ 1,102.7
Pre-acquisition adjusted EBITDA from acquired entities 129.1
Pro forma Adjusted EBITDA $ 1,231.8
35Supplemental Data
Free Cash Flow and Adjusted Free Cash Flow Reconciliation
($ in millions)
2017 2016 2015 2014 2013
Net cash provided by operating activities $ 647.0 $ 407.6 $ 377.6 $ 318.4 $ 223.0
Purchases of property, plant & equipment, net of proceeds from
sale of property, plant & equipment and from government grants (475.2) (218.5) (188.1) (195.3) (218.7)
Free cash flow $ 171.8 $ 189.1 $ 189.5 $ 123.1 $ 4.3
Cash payments for restructuring and acquisition-related costs __ __ __
109.3 9.5
Acquisition-related settlement of pre-existing accounts payable
__ __ __ __
balances with acquired entities 35.2
__ __ __ __
Interest payments upon settlement of acquired company debt 24.6
Adjusted free cash flow $ 340.9 $ 198.6 $ 189.5 $ 123.1 $ 4.3
36Supplemental Data
Net Debt and Net Leverage Ratio
($ in millions)
Twelve Months Ended
December 31,
2017
Current portion of long-term debt $ 5.9
Long-term debt, net 3,969.3
Total debt, net 3,975.2
Less: Cash and cash equivalents 376.8
Net debt at end of period $ 3,598.4
Pro forma Adjusted EBITDA $ 1,231.8
Net leverage ratio 2.9
37Supplemental Data
American Axle & Manufacturing Holdings, Inc.
Net Debt and Net Leverage Ratio
($ in millions)
at December 31,
2016 2015 2014 2013
Current portion of long-term debt $ 3.3 $ 3.3 $ 13.0 $ —
Long-term debt, net 1,400.9 1,375.7 1,504.6 1,537.0
Total debt, net 1,404.2 1,379.0 1,517.6 1,537.0
Less: Cash and cash equivalents 481.2 282.5 249.2 154.0
Net debt at end of period $ 923.0 $ 1,096.5 $ 1,268.4 $ 1,383.0
Net leverage ratio 1.5 1.9 2.5 3.3
38Supplemental Data
EBITDA and Adjusted EBITDA Reconciliation
($ in millions)
Three Months Ended Six Months Ended
June 30, June 30,
2018 2017 2018 2017
Net income $ 151.3 $ 66.3 $ 240.8 $ 144.7
Interest expense 54.4 56.9 107.6 82.4
Income tax expense 2.0 2.4 19.9 9.9
Depreciation and amortization 130.2 124.6 258.0 180.8
EBITDA 337.9 250.2 626.3 417.8
Restructuring and acquisition-related costs 36.8 51.7 55.1 67.7
Debt refinancing and redemption costs 4.3 2.7 14.6 2.7
Gain on sale of business (15.5) - (15.5) -
Non-recurring items:
Gain on settlement of capital lease (15.6) - (15.6) -
Acquisition-related fair value inventory adjustment - 24.9 - 24.9
Other - (3.7) - (3.7)
Adjusted EBITDA $ 347.9 $ 325.8 $ 664.9 $ 509.4
As % of net sales 18.3% 18.5% 17.7% 18.1%
39Supplemental Data
Free Cash Flow and Adjusted Free Cash Flow Reconciliation
($ in millions)
Three Months Ended Six Months Ended
June 30, June 30,
2018 2017 2018 2017
Net cash provided by operating activities $ 222.5 $ 150.9 $ 289.4 $ 213.2
(141.7) (103.0) (272.1) (137.1)
Less: Capital expenditures net of proceeds from sale of property,
plant and equipment
Free cash flow 80.8 47.9 17.3 76.1
Cash payments for restructuring and acquisition-related costs 19.5 56.7 41.3 66.2
Acquisition-related settlement of pre-existing accounts payable
balances with acquired entities - 12.4 - 35.2
Interest payments upon the settlement of acquired company debt - 24.6 - 24.6
Adjusted Free Cash Flow $ 100.3 $ 141.6 $ 58.6 $ 202.1
40Supplemental Data
EBITDA and Adjusted EBITDA
We define EBITDA to be earnings before interest expense, income taxes, depreciation and amortization. Adjusted EBITDA is defined as EBITDA excluding the impact of restructuring and acquisition-related
costs, debt refinancing and redemption costs, and non-recurring items. We believe that EBITDA and Adjusted EBITDA are meaningful measures of performance as they are commonly utilized by management
and investors to analyze operating performance and entity valuation. Our management, the investment community and the banking institutions routinely use EBITDA and Adjusted EBITDA, together with other
measures, to measure our operating performance relative to other Tier 1 automotive suppliers. We also use Segment Adjusted EBITDA as the measure of earnings to assess the performance of each segment
and determine the resources to be allocated to the segments. EBITDA and Adjusted EBITDA should not be construed as income from operations, net income or cash flow from operating activities as
determined under GAAP. Other companies may calculate EBITDA and Adjusted EBITDA differently.
Other Non-recurring Items
Other non-recurring items reflect the impact of a non-cash pension settlement charge related to one of our foreign entities, the impact of a gain related to the change of our method of accounting for indirect
inventory and the interest expense for the debt drawdown period prior to acquisition funding requirement.
Free Cash Flow and Adjusted Free Cash Flow
We define free cash flow to be net cash provided by operating activities less capital expenditures net of proceeds from the sale of property, plant and equipment and from government grants. Adjusted free
cash flow is defined as free cash flow excluding the impact of cash payments for restructuring and acquisition-related costs, settlements of pre-existing accounts payable balances with acquired entities, and
interest payments upon the settlement of acquired company debt. We believe free cash flow and Adjusted free cash flow are meaningful measures as they are commonly utilized by management and investors
to assess our ability to generate cash flow from business operations to repay debt and return capital to our stockholders. Free cash flow and Adjusted free cash flow are also key metrics used in our
calculation of incentive compensation. Other companies may calculate free cash flow and Adjusted free cash flow differently.
Net Debt and Net Leverage Ratio
We define net debt to be total debt, net less cash and cash equivalents. We define Net Leverage Ratio to be net debt divided by the trailing 12 months of Adjusted EBITDA or pro forma Adjusted EBITDA,
where applicable. Pro forma Adjusted EBITDA includes AAM's Adjusted EBITDA and the pre-acquisition EBITDA of acquired entities. We believe that Net Leverage Ratio is a meaningful measure of
financial condition as it is commonly used by management, investors and creditors to assess capital structure risk. Other companies may calculate Net Leverage Ratio differently.
Liquidity
We define Liquidity as cash on hand plus amounts available on our revolving credit facility and foreign credit facilities.
US SAAR
We define US SAAR as the seasonally adjusted annual rate of light vehicle sales in the United States.
CAGR
We define CAGR to be the compound annual growth rate of sales.
41You can also read