INVESTOR PRESENTATION January 2021 - Somfy Group
←
→
Page content transcription
If your browser does not render page correctly, please read the page content below

INVESTOR
PRESENTATION
 January 2021

    1
SOMFY OVERVIEW
         Investor Presentation 2021

2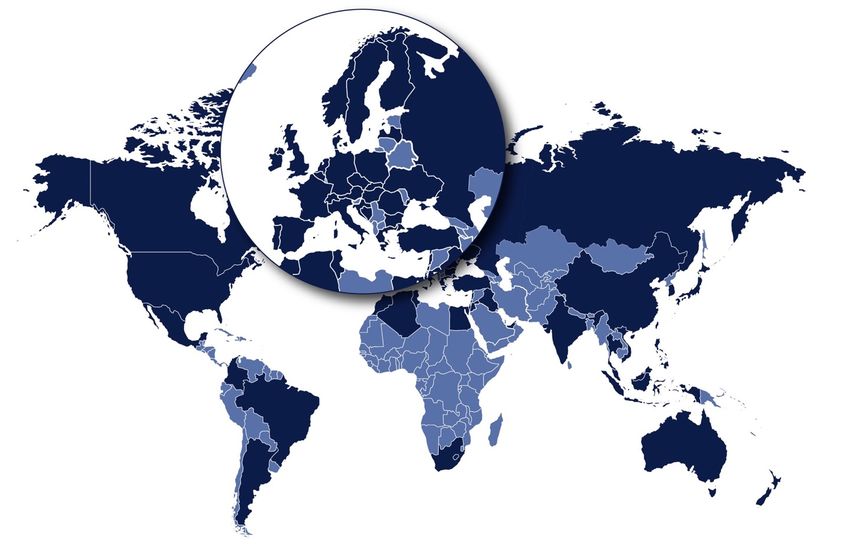
BACKGROUND
Growing aspiration of people throughout the world to enjoy safe, healthy and
environmentally friendly living spaces
Confirmation of the importance of comfortable and responsible housing underlined by
the pandemic and climate change
Addressing the need for comfort, security and efficiency (energy, etc.) by developing
innovative and connected solutions for residential and commercial buildings
Commitment to making the solutions as widely accessible as possible thanks to the
wide-ranging portfolio of brands and products, and to the breadth and depth of the
distribution network
#Inspiring a better way
of living accessible to all
3
PROFILE
Global leader in opening and closing automation for both residential and commercial
buildings (motors, remote controls, sensors, control panels)
• Addressing the residential and commercial construction and renovation markets
• Compatible with all major existing installations, i.e. blinds, shutters, interior solutions
(screens, curtains, solar protection, etc.) and access (automatic barriers, gates, doors, etc.)
• Extension to security systems (alarms, cameras, videophones, etc.)
• Can be integrated and used in home automation protocols
Pioneer in the digitalisation of living spaces and key player in the connected home
4
50 YEARS OF INNOVATION AND PARTNERSHIPS

          MOTORISATION                                               AUTOMATION                                                     DIGITALISATION

     1969                                       1987

                                          1st TV campaign
1st subsidiary                                                                                                                                2016
                                                                                                                                                                 2019   2020
                      1981                                    1998                      2006            2010               2015      2016
                                                                                                                                             Somfy            Smart
                  1st automation                                                                                                   Connexoon Protect                 ILÔ by Somfy
                                                                                                         ILMO,          Smart &                               Window st
  Push – Pull                                                                                              1st
                                                                                                                                                                     1 “all in
                                                                                                                        Smooth
    model                                                                                                                                                            one” security
                                                                                                       plug&play
                                                                                                                                                                     service
                                                                                                         motor,
                                                                                                      1st TaHoma
 Innovations                                                                     2006                      box      2014                             2018

                                                                            Opening of SITEM                   Opening of SOPEM                    Rumilly
 Industrial                                                                     facility                            facility                   “factory of the
performance                                                                                                                                       future ”

                                   1985                              2000                      2007
                                                                                                                                                            2018
Partnerships

                 1980                                  1990          2000                                2010               2015                                          2020
                                                                                         5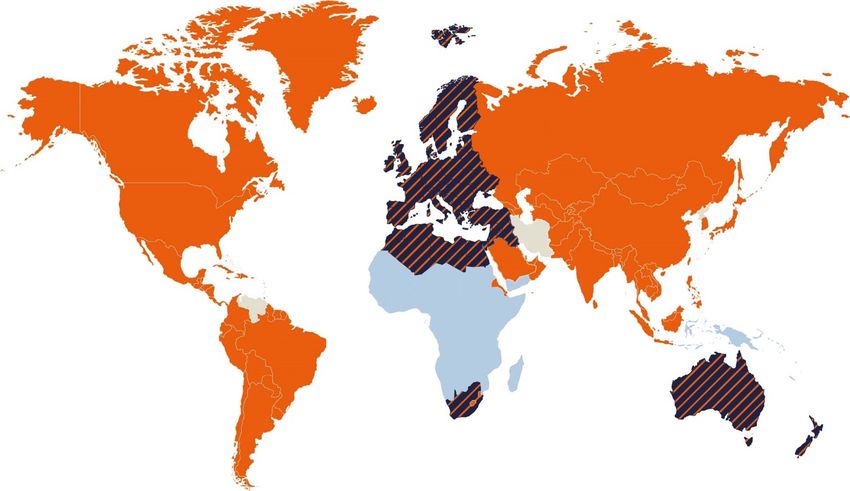
LONG-TERM GROWTH

                                                        Sales growth
    1 600,0

    1 400,0

    1 200,0

    1 000,0

     800,0

     600,0

     400,0

     200,0

        0,0
              2005   2006   2007   2008   2009   2010   2011      2012        2013   2014   2015       2016      2017       2018      2019

                                                        Group sales   Dooya

                                                                                            (1) Average growth over the period
                                                                                            (2) Average proforma growth over the period including
                                                                                            Dooya sales in 2018 & 2019
                                                           6
LONG-TERM PROFITABILITY
                                         Change in current operating profit and current operating margin

          250                                                                                                                                                       25,0
                                                                          +€88.5m (+76.1%)
                                                                       between 2005 and 2019
          200                                                                                                                                                       20,0

          150                                                                                                                                                       15,0

          100                                                                                                                                                       10,0

           50              Change in                                                                                                                                5,0
                         consolidation                                                                    Increase in capex
                             scope                        Economic crisis                                  and overheads

            0                                                                                                                                                       0,0
                2005   2006     2007     2008      2009        2010         2011   2012        2013       2014       2015      2016     2017     2018     2019

                                                Current operating result (€ m)            Current operating margin (COR/Sales) in %

                                                                                                                                Dooya not included in 2018 & 2019

                                                                        7
INDUSTRIAL FOOTPRINT

                              Poland
                           Sopem - Kraków
                            (production site)

        France
     Somfy - Cluses
      (production site
    and research centre)
                                                      China
      Simu - Gray
      (production site                           Dooya - Ningbo
      and test centre)
                                                   (production site)

                                                 LianDa - Zhejiang
                                                   (production site)

          Italy
       Bft - Schio
     (production site)

     Way - Galliera            Tunisia
     (production site)
                           Sitem - Zaghouan
                             (production site)

                               8
MARKETS
Multitude of growth drivers
• Demand for comfort and security
• Awareness of climate and energy issues
• Widespread adoption of motors and automation
• Increased usage due to the boom in connected objects
• Growth of new industrialised countries
Synergies between the various distribution channels
Diversity of competitor profiles
9
MARKETS (continued)                                                       Individual housing

                                          EMEA
                                   68% of the global
                                  motorisation market

                                                 37%

                Americas            63%                 Asia - Pacific
             11% of the global
                                                         21% of the global
            motorisation market                                               Collective housing
                                                        motorisation market

                                                           26%
              37%

                         63%
                                                                    74%

                                                                              Commercial buildings

                                                                                          Parking
New build   Renovation
                                                             10
MARKETS (continued)
Fields of activity
11MARKETS (continued)
Potential of the interior motorisation market
AMERICAS EMEA ASIA
34 m 58 m 65 m
2m 1.3 m 2.7 m
A GROWING MARKET
13% average growth rate
between 2010 & 2018
12MARKETS (continued)
Potential of the home automation (smart home) market
49.5 m 36.8 m
North America Europe
Average growth rate ($):
Average growth rate (€):
+24.8% p.a.
+23.4% p.a.
22.3 m
12.9 m
2018 2023 2018 2023
13MARKETS (continued)
HEATING
ALARMS 10% of homes fitted with LIGHTING
3 products 34% of homes fitted with
8% of homes fitted with
5 light sources
1 alarm
SENSORS
29% of homes fitted with
4 sensors
GARAGE 511,977 SOMFY
13% of homes fitted with
1 motor CONNECTED
HOUSEHOLDS
GATE
9% of homes fitted with INTERIOR BLINDS
1 motor 6% of homes fitted with
4 motors
ROLLER SHUTTERS TERRACE & PATIO
77% of homes fitted with 19% of homes fitted with
2 motors
EXT. VERTICAL BLINDS EXT. VENETIAN BLINDS
8 motors
10% of homes fitted with 13% of homes fitted with
4 motors 6 motors
14CUSTOMERS AND PARTNERS
Home automation
& IT Partners
Window & Door
Shutter & Awning Partners
Partners & KA
Removing Comfort and Energy Efficiency
YESTERDAY effort TODAY
security & Air Quality
Handle Motors Exterior & Interior Exterior & Interior
automation remote management
thanks to radio control system thanks to connectivity
15SUSTAINABLE
DEVELOPMENT
Investor Presentation 2021
16CORE OF THE GROUP’S STRATEGY
ENVIRONMENTAL IMPACT
REDUCTION
4
cornerstones of
ENGAGEMENT
OF OUR EMPLOYEES
BETTER WAYS OF LIVING
sustainable
FOR SOCIETY
development
CONSUMER
CARE
ETHICS AND REGULATIONS PERMEATE THESE FOUR CORNERSTONES.
17ENVIRONMENTAL IMPACT REDUCTION
GREEN PRODUCTS
Taking action with the eco-design of
our products and prioritising materials
and components with low greenhouse
Green
gas emissions Green Suppliers
Adopting the principles of the circular Design
economy
Green
+ Manufacturing
Green Green
GREEN OPERATIONS Products Operations GREEN BENEFITS
Producing and distributing solutions Green Helping to reduce our collective
with a lower environmental impact CARBON Offices carbon footprint thanks to solutions
FOOTPRINT
and products that help optimise and
Green
End-of-life + + Green reduce the energy consumption of
Distribution residential and commercial buildings
GREEN TEAMS Green
Introducing environmentally friendly Teams
practices in the workplace
Green practices and behaviours
18ENVIRONMENTAL IMPACT REDUCTION:
2019 KEY FIGURES
50% 61 7.2% in 2 years 88%
of Somfy products on sale Somfy product ranges reduction in CO₂ emissions of IT equipment was
worldwide at 1 January are certified related to the electricity reused in 2019,
2020 were eco-designed “Act for Green®”, consumption of Somfy with 12% recycled
compared with 17 in 2018 brand motors on standby
19BETTER WAYS OF LIVING FOR SOCIETY
Supports charities to help combat poor housing, thanks to two levers for action in France and internationally.
PEOPLE FINANCE
Involving people and adding meaning through an employee • International financial endowment
engagement programme - during working hours - in France and • Crowdfunding platform in France
internationally.
Up to 3 days per year and with the option of getting involved in 6
different ways: projects, during holidays, workshops, talents,
challenges and volunteering during retirement
650
employees involved in France
and internationally in 2019,
as part of 87 projects
20BETTER WAYS OF LIVING FOR SOCIETY (continued)
Doubling of donations to support access to decent housing through community crowdfunding
Є3,413,603 311 14,900 91%
donated to charities projects supported donations success rate
Through our partners
21FOCUS ON
2020 HY RESULTS
Investor Presentation 2021
22BUSINESS CONTINUITY PLANNING (COVID-19)
Rapid rollout of a set of measures to deal with the crisis and balance the
safety of employees with business continuity
Operations Workforce Finance
• Implementation of a remote • Signing of an agreement
between management and the • Reduction of the dividend
working system
trade union delegations on the proposed in relation to the
• Temporary suspension of
taking of paid leave 2019 financial year
production at certain sites
• Development of a safety • Safeguarding of all jobs until
protocol (individual and the end of June
collective measures)
23HIGHLIGHTS
New structure and new Executive Committee introduced in early January
Abrupt change in environment and reversal of trend midway through the half-year
due to the health crisis
Suspension of operations at several manufacturing sites in late March and gradual restart
early April
Massive rollout of remote working from mid-March to late June for suitable roles
Launch in late June of an integrated remote surveillance and alarm solution (Ilô by
Somfy)
Pursue of the recovery seen at the end of the first half-year during the third quarter
with unexpected intensity and strength in spite of the second lockdown
24KEY FIGURES
Sales: €568.9m (-7.5%)
Current operating margin 18.0% (-70 bps)
Net profit: €80.9m (-11.3%)
Cash flow: €117.7m (+0.2%)
Net financial surplus: €325.6m (+€15.1m compared with 31/12/2019)
25SALES
Data in € millions 30/06/18 30/06/19 30/06/20 Change 2020/19
Sales 586.1 615.1 568.9 -7.5%
Strong growth in January and
615.1 +4.9% -7.5%
586.1
+2.7%
February in most markets
568.9 -7.2%
like-for-like Almost universal downturn in mid-
Q2 332.0
March due to the severity of the
315.4 +2.1% +5.3% 277.6 -16.4% June +19.9%
health crisis
-20.3% May
Spectacular fall in April, followed
by a change of course in May and a
Q1
270.7 +3.5% 283.1 +4.6% 291.3 +2.9% significant upturn in June in many
-45.4% April
countries
H1 2018 H1 2019 H1 2020
Q2 2020 Peak of the crisis at one of the key
Change on a like-for-like basis
points of the year (awnings season)
26SALES (continued)
Total
-7.2%
-3.3% Northern
Europe
Central Europe
(of which Germany)
+6.7%
(+8.1%)
+19.7% Eastern Europe
-17.2%
France
Central and Eastern Europe held
Southern
-22.1% Europe
up very well
-9.3%
Fairly marked decline in the other
North -10.3% regions, but all returned to growth
America
Asia-Pacific -3.8%
by the end of the half-year, except
-13.6% Latin America
Dooya
Africa & the Sharp decline of Dooya at the start
Middle East
-16.3% of the year and subsequent
Latin
recovery due to the significance of
America China and Asia
Changes on a like-for-like basis
(constant scope and exchange rates)
27CURRENT OPERATING RESULT
Data in € millions 30/06/19 30/06/20 Change 2020/19
Sales 615.1 568.9 -7.5%
Current operating result 114.9 102.6 -10.7%
Current operating margin (COR/Sales) 18.7% 18.0% -70 bps
COR/Sales Decline in current operating result
18.7%
COR/Sales COR/Sales
slightly higher than fall in sales
18.0% 18.0%
1.7
25.7 17.4
4.3 0.1 Implementation of measures in
2.2 response to the crisis, resulting in a
control of salaries and a reduction
in commercial costs and overheads
114.9
102.8 102.6 Current operating margin
maintained at a high level
(COR/Sales: 18.0%)
2019 H1 COR Sales growth Impact of margin Impact of cost Impact of Impact of 2020 H1 COR like- Forex impact 2020 H1 COR
on variable costs savings investment Depreciation and for-like 2019
maintained provisions
28CONDENSED INCOME STATEMENT
Data in € millions 30/06/19 30/06/20 Change 2020/19
Expected but contained decline in
Sales 615.1 568.9 -7.5% current operating result
Current operating result 114.9 102.6 -10.7% Limited impact of non-recurring
Non-recurring operating items (0.7) (0.8) N/S and financial operating items
Net financial expense (1.9) (4.0) -109.0% Knock-on decrease in income tax
Income tax (22.5) (18.3) -18.6% Decline, albeit limited, in net
Share of net profit from associates 1.3 1.4 N/S profit
Consolidated net profit 91.2 80.9 -11.3%
29UPDATE ON DOOYA
Data in € millions 30/06/19 30/06/20 Change 2020/19 Slight fall in sales, thanks to a sharp upturn
Sales* 89.2 84.9 -4.8% in the second quarter, after a severe decline
First quarter 43.0 35.1 -18.2% in the first quarter due to the progression
of the health crisis in China and Asia
Second quarter 46.2 49.8 +7.7%
The main expense items were contained as
a result of the actions taken in recent
Data in € millions 30/06/19 30/06/20 Change 2020/19 months, leading to a slight increase in
Sales* 89.2 84.9 -4.8% EBITDA and net profit
EBITDA 7.4 7.9 +6.3%
EBITDA/Sales 8.3% 9.3% +100 bps
Net profit 1.9 2.0 +6.0%
* Including €87.4 million with customers outside the Group as of 30 June 2019 and €83.2 million as of 30 June 2020
30CONDENSED BALANCE SHEET
Data in € millions 30/06/19 31/12/19 30/06/20
Equity 939.6 1,012.8 1,044.4
Long-term borrowings 54.8 45.0 49.2
Provisions and retirement commitments 38.2 39.1 40.8
Financial ratios preserved
Other non-current liabilities 16.3 17.5 17.6
Decrease in working capital
Permanent capital 1,048.8 1,114.5 1,152.0
requirements compared to last year,
Goodwill 95.4 95.6 94.5 due to the effects of the crisis
Net non-current assets 337.0 340.7 337.7
(destocking and lower invoicing)
Investments in associates and joint 134.2 136.5 137.0
ventures Stability of net financial surplus (net of
Other non-current receivables 26.8 26.0 23.6
liability corresponding to dividends
Working capital 455.3 515.6 559.2 payable)
Working capital requirements 225.6 159.8 184.1
Cash and cash equivalents* 229.7 355.8 375.2
Net financial debt (174.7) (310.5) (325.6)
* Item includes the current portion of financial liabilities
31FOCUS ON
2020 Q3 SALES
Investor Presentation 2021
32SALES
Data in € millions Q3/20 30/9/20
like-for-like like-for-like
Central Europe 73.7 +14.0% 200.6 +9.3%
Northern Europe 44.4 +32.0% 114.8 +7.8% Continuation, with unexpected
intensity and strength, of the
North America 32.6 +27.2% 82.0 +2.8%
recovery seen at the end of the first
Latin America 5.1 +11.9% 13.3 -7.0% half-year
Total North & West 155.7 +21.3% 410.6 +6.9% Continued improvement throughout
France 100.4 +26.7% 248.4 -3.8% July, August and September
Southern Europe 37.4 +34.5% 88.1 -5.1% Particularly strong growth in Eastern
and Northern Europe, as well as
Africa & the Middle East 18.7 +27.1% 45.4 +0.1%
Southern Europe, North America and
Eastern Europe 38.1 +34.5% 97.2 +25.1% France, some of the regions hardest
Asia-Pacific 18.0 -0.2% 47.5 -6.7% hit at the peak of the pandemic
Total South & East 212.6 +26.4% 526.6 +0.4%
Total 368.3 +24.2% 937.2 +3.1%
33FOCUS ON
2020 M&A
Investor Presentation 2021
34ACQUISITION OF A MAJORITY STAKE IN REPAR'STORES (1/2)
• Repar'Stores, the French market leader for roller blind
repairs and upgrades services
• FY 20 Sales : €28.5 m (+ 21,7% over the past two financial
years)
• 190 franchisees in France
• Acquisition of a 60% majority stake in the share of
Repar'Stores
• An equity investment effective since the start of January
2021
• An additional option regarding the remaining shares
(ends in 2026)
35ACQUISITION OF A MAJORITY STAKE IN REPAR'STORES (2/2)
A MAJORITY EQUITY
INVESTMENT IN LINE WITH strengthening Somfy’s positioning in the
services sector
AMBITION 2030, THE 10-
YEAR STRATEGIC PLAN strengthening Somfy's commitment to sustainable
AND WHICH AIMS AT development
supporting Repar’stores in its European
expansion
362030 AMBITION
VISION
Investor Presentation 2021
37STRATEGIC FRAMEWORK
2030 AMBITION
THE PREFERRED PARTNER FOR WINDOW AND DOOR AUTOMATION
Forward-looking in Smart
1 Living 2 Rising value to customers
• Supporting the transformation of the building • Putting customers at the centre of the
industry organisation
• Safeguarding market share while anticipating • Accelerating the digitalisation of core business
changing demands products
• Pursuing the policy of developing partnerships to • Developing high value added services
build a strong ecosystem • Anticipating and satisfying customers’ new
• Creating homes that combine comfort, well-being habits
and safety with a responsible approach
3 Delivering performance 4 Inspiring & Engaging
• Drafting a new roadmap to capture opportunities • Focusing on a single vision "One Somfy, One
• Strengthening the Somfy brand portfolio and image Team’’ and a collective commitment
• Placing operational excellence at the heart of the • Supporting the development of in-house
strategy talents and offering stimulating careers and
• Reducing the environmental footprint for greater career development opportunities
corporate responsibility • Fostering inclusion through diverse recruitment
• Making teams performance drivers
38BUSINESS LINE – A NEW SEGMENTATION TO MANAGE THE PRODUCT RANGES
Core business Accelerators Add-ons
Strengthen leadership in the core Optimise the value proposition and Develop alternative revenue streams.
business. business performance.
Gain market share and adopt a
Innovate, develop brands, digitalise Capture opportunities and anticipate positioning that promotes the new
ranges and strengthen partnerships risks. vision.
to deliver an increasingly diverse and
high-performance offering to Smart windows
customers. Doorlock
Air quality (Thermostat)
Lighting management
Security (Europe)
Exterior Applications* Swinging shutters
Urban Road Systems & Parking Management
Interior Applications* Industrial and commercial closing systems
Smart Home + Overkiz
EMEA residential access Window opener (Mingardi)
Building controls
Projection screens
Services
* Including patios, controls and sensors
39OUTLOOK FOR THE
2020 FINANCIAL YEAR
Investor Presentation 2021
40OUTLOOK FOR THE YEAR
Improved confidence in the Group’s fundamentals and the Ambition 2030 transformation
project, notably as a result of the lessons learnt from the pandemic (further demonstration of
the importance of the digitalisation of homes and commercial buildings, as they are vehicles for
comfort and energy performance)
Continuation over the third quarter of the recovery seen at the end of the first half-year, with
unexpected intensity and strength
Outlook for the full financial year of sales increase and a recovery in current operating margin,
under the combined effect of activity growth and exceptional and one-off cost savings, related
to the measures implemented at the start of the pandemic
41You can also read