Q3 2019 5 November, 2019 - Helping people keep their commitments - Hoist Finance
←
→
Page content transcription
If your browser does not render page correctly, please read the page content below

Q3 2019

5 November, 2019

Helping people keep their commitments

Today’s presenters

                     Klaus-Anders    Christer
                       Nysteen      Johansson
                         CEO           CFO

                                                2
AGENDA

 1   Key highlights Q3

 2   Financial update

 3   Capital, funding and liquidity

 4   Summary

 5   Appendix

                                      3
Strategic focus in Q3

 Q3 highlights                                                            Implementing strategy

 1. Underlying performance on par with previous quarters this year
 2. Executing on our strategy. Key achievements:                                       • Site consolidation in France
       • Firm commitment on first rated securitisation                                 • Targeting 80 FTEs in shared services
       • Decisive steps taken to become more efficient
       • Great progress in digital
 3. Strong balance sheet, and ready for growth in Q4                                   • Outsourcing IT infrastructure
                                                                                       • Live-testing digital solutions

 Key Performance
                                                                                       • Committment for rated securitisation
 • EBT* at SEK 194m
                                                                                       • Expected investment-grade rating
 • Collection performance at 101%
 • Cost-to-income* at 73%
 • Return on Equity (RoE)* at 15%
                                                                                       • Well capitalised for growth in Q4
 • Strengthened capital ratios, CET1 ratio at 10,3%

                         *Excluding Items Affecting Comparability (IAC)                                                         4
Site consolidation continues

 • Positive outlook on French market, with
   growth across all asset classes

 • Bayonne site closed to improve efficiency

 • ~30 FTEs affected
                                                        Lille
 • Streamlined organisation with specialisation
     •   Lille – Unsecured NPLs                         Paris
     •   Paris – Secured NPLs

 • Strong pickup in digital collections           Bayonne
     •   10% since self-service launch in March

                                                                5
Expansion in shared services

                                       Shared Service Centre                             Nearshoring Centre
                                             (Poland)                                        (Romania)

                               Accounting, IT, People, Legal, Tax, Risk,
   Types of services                                                           Back office, call centre activities
                               Internal Audit, Business Control

                                                                           •   Initial presence through acquisition of
                                                                               servicing entity Maran, which includes
                           •   Multiple markets transferring services          ~80 FTEs in Romania
   Current focus           •   Targeting ~65 FTEs by year-end              •   Adding capacity to service multiple
                                                                               markets, targeting additional ~30 FTEs
                           •   Cost benefit vs all markets                     by Q1-20
                                                                           •   Significant cost benefit

      Shared service to leverage scale and maximise skills, enabling us to work in a more effective and efficient way

                                                                                                                         6
Important step in becoming the digital leader
•   Larsen & Toubro Infotech Ltd (“LTI”) new IT        •      One of the Largest IT Companies in the Nordics
    infrastructure outsourcing partner
                                                       •      28,000 consultants worldwide
•   Ready to scale in the ambition to become the
    market leader                                      •      10 Delivery Centres situated in Europe, Poland & Nordics

•   Immediate access to experienced team in the        •      Deep domain experience in Core Banking, Payments,
    financial industry                                        Asset mgmt., Risk and Compliance

•   Current team of ~60 resources directly affected

•   Setup adds significant contribution to reach the
    2021 cost-to-income target

                                                           LTI wins ZEE Business National CSR Leadership Award for Innovations in CSR practices (Sept, 2019)
                                                                                                                                                               7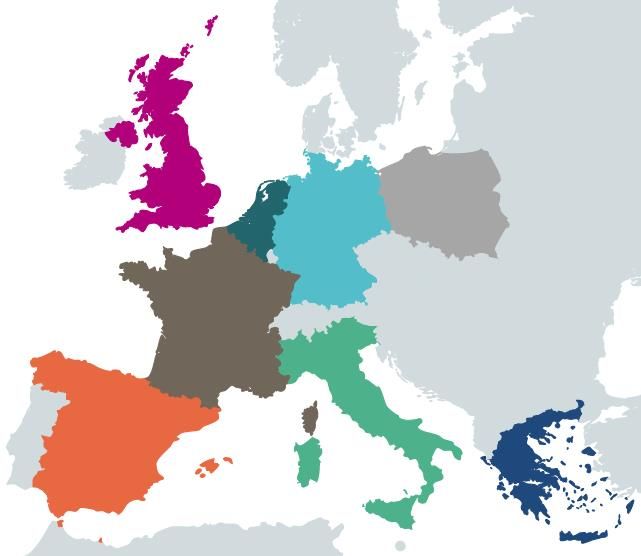
Live-testing digital solutions

        WhatsApp for Business
   •   The largest messaging platform with over 1.4 billion users worldwide

   •   Traditionally used for personal use, but expanded to small business in early 2018

   •   Adopted widely by customers to replace SMS

        Rich Communication Services (RCS)
   •   RCS is a technology developed in conjunction with Google aimed to replace SMS as
       a new “Over-the-Top” messaging service

   •   Participation in the Early Access programme

   •   Outreach to all android devices in September 2019

   •   Android has 75% of the mobile device market in Europe

                                                                                           8
On track to implement a sustainable business model

                                                                       Rated securitisation transaction
                                                                       •   Portfolio size: EUR337m

                                                                       •   Senior tranche: 85%
                Portfolio
                                                        Rated senior   •   Expected investment grade rating
                                                          tranche
                                         Rated senior
                                           tranche
                                                        Retained by
                                                                       •   Coupon on senior tranche: 1.8%
                             Selected                      Hoist
Hoist Finance   Purchase
                  price
                             portfolio                                 •   IRR on subordinated tranche: 15%

                                                                       •   Commitment from CarVal Investors, LP to close in Q4

                                                                       •   Further strengthens CET1 capital
                 Servicing
                agreement                               Mezzanine
                                         Subordinated
                                           tranche
                                                          Junior

                                                                                                                                 9
Well positioned ahead of seasonally strong Q4
Acquisition volumes, SEK billion
10
9 Key takeaways
8
• Positive trends across
7
multiple markets, for all
asset classes
6
• Market dynamics continue
5 to support margin
improvement
4
• Strengthened capitalisation
3 enables continued growth
2 • Q4 seasonally strong as
banks focus on balance
1 sheet management at year-
end
0
2016 2017 2018 2019
Q1 Q2 Q3 Q4
10Attractive markets conditions throughout Europe
• Renewed government guarantee systems (GACS)
Italy • Increasing sales of UtP loans & secondary market
transactions
UK • Steady pipeline but some Brexit uncertainty
Poland • Favourable competitive dynamics post-GetBack
Germany • Stable and mature
France • Significant growth in the secured NPL market
Spain • Remains one of the most competitive markets
Benelux • Banks remain reluctant to sell but margins remain healthy
Greece • Deconsolidation and securitisation transactions prevalent
SOURCE: Hoist Finance internal data 11AGENDA
1 Key highlights Q3
2 Financial update
3 Capital, funding and liquidity
4 Summary
5 Appendix
12EBT suppressed short-term due to strategic initiatives
SEKm Q3 2019 Q2 2019 Q1 2019 Q3 2018 Change
Interest income acq loan portfolios 836 848 810 718 16%
Key takeaways
Interest expense -138 -105 -104 -93 48% • Size of NPL book unchanged, with
Net interest income 696 746 706 622 12%
margins ~0.5% higher on new
acquisitions, ’19 vs ‘18
Impairment gains and losses 12 35 51 51 -76%
• ~30 SEKm in additional interest expense
Net result from financial transactions -45 -18 -16 40 N/A
vs previous quarters, equally split
Total operating income 698 797 774 731 -5% between deposits and securitisation
Total operating expenses -568 -571 -561 -499 14%
• Collection performance at 101%,
Net operating profit 130 226 213 232 -44% including -2% impact from Spain
Profit from participations in joint ventures 16 4 13 11 43% • 31 SEKm negative impact from interest
rate hedging, offset by lower future
Profit before tax 146 230 226 243 -40%
funding cost
Ratios Q3 2019 Q2 2019 Q1 2019 Q3 2018 Change • Favourable underlying cost development,
but accruing 33 SEKm for restructuring in
Return on Equity, % 12 16 17 20 -8 pp France and within IT-outsourcing
C/I ratio, % 80 71 71 67 13 pp
13EBT suppressed by strategic initiatives beneficial in the long-term
SEK million
226 230
210
16
194
47
146
Q1-19 EBT Q2-19 EBT Q3-19 Restructuring* EBT adjusted Hedge effects Underlying EBT
for IAC related to
flattening of
yield curve
Cost-to-income 71% 71% 80% 73% 72%
*Restructuring charges in connection with closure of Bayonne site, outsourcing of IT and realized loss in connection with adopting updated hedging models
14Financial summary, adjusted for Items Affecting Comparability (IAC)
SEKm Q3 2019 Q2 2019 Q1 2019 Q3 2018 Change
Interest income acq loan portfolios 836 848 810 718 16%
Key takeaways
Interest expense -138 -105 -104 -93 48% • Q3 2018 adjusted for modification gain
Net interest income 696 746 706 622 12%
in connection with repurchase of senior
bonds
Impairment gains and losses 12 35 51 51 -76%
• No items affecting comparability in Q1
Net result from financial transactions -31* -18 -16 -2* >100%
and Q2 2019
Total operating income 712* 797 774 689* 3%
• Q3 2019 adjusted for restructuring
Total operating expenses -534* -571 -561 -499 7%
charges
Net operating profit 178* 226 213 191* -7%
Profit from participations in joint ventures 16 4 13 11 43%
Profit before tax 194* 230 226 202* -4%
Ratios Q3 2019 Q2 2019 Q1 2019 Q3 2018 Change
Return on Equity, % 15* 16 17 16* -1 pp
C/I ratio, % 73* 71 71 71* 2 pp
*Items affecting comparability (IAC) in Q3-18 refer to a modification gain taken up as income in conjunction with repurchase of senior bonds (42 SEKm). For Q3-19 IAC consists of restructuring charges in connection
with closure of Bayonne site (24 SEKm), staff-related costs in connection with outsourcing of IT (7 SEKm) and realized loss in connection with adopting updated hedging models (15 SEKm).
15Major strategic steps in Q3
Cash-to-achieve until 2021 Run rate expected financial impact 2021
SEKm Decreased cost in SEKm
200-250
French site consolidation
IT infrastructure outsourcing Collection excellence ~100
Pre-Q3 initiatives
Digitization of
~50
customer interface
Collections analytics ~50
24
7 Indirect cost/
Organization ~100
49
Investments in Site optimisation Other Total
Total 55 45 10 300
IT infrastructure, and near-shoring
digitization and
analytics
16Reduction in market rates comes at a cost which is offset over time
Average offered interest rate – Hoist deposits
• Interest rate risk is hedged
for business and capital 1,8%
reasons 1,6%
• Hedging EUR, GBP and PLN 1,4% At constant
rates, with average 1,2% volumes, Q3
duration 2.5 year 1,0% changes in offered
rates translate into
• +/- 10 bps movement of 0,8%
yield curves translates into at least 15 SEKm
0,6% reduction of
ca +/- 9 SEKm change in
0,4% annualized future
value of IRS instruments
0,2% funding cost
• Q3 2019 includes -16 SEKm
from interest rate hedging 0,0%
2019-06-01 2019-07-01 2019-08-01 2019-09-01 2019-10-01
June July Aug Sept Oct
Floating deposits (Sweden) Fixed deposits (Sweden)
Floating deposits (Germany) Fixed deposits (Germany)
17AGENDA
1 Key highlights Q3
2 Financial update
3 Capital, funding and liquidity
4 Summary
5 Appendix
18Capital and liquidity position
Q3 2019 Capitalisation, % Capital ratios, % Liquidity reserve, SEKm
31 Dec 2018 30 Sep 2019 31 Dec 2018 30 Sep 2019
14,9%
14,1%
11,9%
CET1-target range 12,3%
10,3% 11,7%
9,9%
2,2% 10,3%
8,1% 9,7%
12 836
7 399
Regulatory Margin above CET1-ratio Common Equity Tier 1 Total
capital capital Tier 1 capital ratio capital ratio capital ratio
requirement requirement
19Active shift to reduce balance sheet risk
Distribution of deposits
Key takeaways
• Gradual shift in the last
42%
52%
year to reduce interest
65%
60% rate risk
69%
• Arrived at the targeted
mix – no desire or need to
move beyond current
level
58%
48% • Best-in-class funding rates
40%
31% 35% across durations
− Floating at 0.45-0.60%
− Fixed Sweden: 3 years at 1.75%
− Fixed Germany: 5 years 1.50%
Q3-18 Q4-18 Q1-19 Q2-19 Q3-19
Fix Floating
20Funding rate remains highly competitive
Funding excluding equity and AT1-capital, SEKbn
Key takeaways
35
1,80% 1,63% 2,0% • Continuous growth in retail
1,8% deposits during the quarter,
30 where senior unsecured
1,6%
25
remained constant (excluding
1,4%
effects from securitisation)
1,2%
20
1,0% • The successful securitisation
15
0,8% improved capital ratios but
0,6%
results in slightly higher cost
10
of funding
0,4%
5
0,2% • Oversized liquidity reserve
0 0,0% had a negative effect on the
Q1-17 Q2-17 Q3 -17 Q4 -17 Q1-18 Q2-18 Q3-18 Q4-18 Q1-19 Q2-19 Q3-19 Interest expense in relation
Deposits Senior unsecured debt (excluding securitisation) to book value
Senior unsecured debt (securitisation) Subordinated liabilities
Commercial Paper Average cost of funding, %
Interest
expense/ 2,4% 2,6% 2,1% 2,1% 1,9% 1,9% 2,0% 2,1% 2,0% 1,9% 2,5%
Book value
21Implementing a sustainable business model
Weighted average cost of debt RoE of securitisation
• Cost of funding does increase somewhat but still very attractive • Securitisation structures seen as consistent with NPL backstop
versus high yield funded competitors regulation
• Majority of competitors fund at cost in excess of the rated • More efficient from a capital perspective
securitisation (currently around 4 - 6.5%) • Supporting attractive RoE development
• Given this transaction is the first of its kind, Hoist expects further
efficiencies with potentially further improved terms from future
transactions
Unsecured risk weights as % of acquired NPLs(1)
4% 150%
80-105%
92,50%
2%
Current Rated securitisation
Current Rated securitisation
1) For rated securitization it depends on weighted average life and rating; includes 5% retention
22AGENDA
1 Key highlights Q3
2 Financial update
3 Capital, funding and liquidity
4 Summary
5 Appendix
23Outlook and today’s key takeaways
Attractive market conditions
• Well positioned for a seasonally strong fourth quarter
• Strong pipeline across a number of markets and asset classes
• Continued margin improvements
Delivering on our strategy
• Delivering on strategic agenda
• Implementing a sustainable post NPL backstop business model
• Becoming the digital leader in our industry
24AGENDA
1 Key highlights Q3
2 Financial update
3 Capital, funding and liquidity
4 Summary
5 Appendix
25Investor Relations
Most recent stock recommendations Selected Investor Relations
Date Institution Recommendation TP
events in 2019
2019-10-30 Citi Neutral 54
2019-10-11 Nordea Hold n/a on hold • Geneva & Paris, November 7-8
2019-10-11 Pareto Hold 55 • Oslo, November 15
2019-10-07 SEB Buy 68 • Brussels/Amsterdam, December 2
• USA/Canada, December 4-6
• Goldman Sachs Annual Credit Mgmt Day,
Recommendations December 11
3
1
0
Buy Hold Sell For more information:
Web: ir.hoistfinance.com/en
Analyst coverage
Institution Analyst
Head of Investor Relations:
Citi Investment Research Borja Ramirez
Andreas Lindblom
Nordea Markets Ermin Keric
andreas.lindblom@hoistfinance.com
Pareto Securities Vegard Toverud
+46 (0)72 506 14 22
SEB Ramil Koria
26Disclaimer
IMPORTANT: The following applies to this document, the oral presentation of the information in this document by Hoist Finance AB (publ) (the
“Company”) or any person on behalf of the Company, and any question-and-answer session that follows the oral presentation (collectively, the
“Information”).
The Information has been prepared and issued by the Company solely for use at the presentation held by the Company in relation to the Company’s
operations and position. This Presentation does not purport to contain comprehensive or complete information about the Company and is qualified in its
entirety by the business, financial and other information that the Company is required to publish in accordance with the rules, regulations and practices
applicable to companies listed on Nasdaq Stockholm. The Information has not been independently verified and will not be updated. Unless otherwise
stated, any market data used in the Information is not attributed to a specific source, are estimates of the Company, and have not been independently
verified. The Information, including but not limited to forward-looking statements, applies only as of the date of this document and is not intended to give
any assurances as to future results.
THE INFORMATION IS BEING MADE AVAILABLE TO EACH RECIPIENT SOLELY FOR ITS INFORMATION AND BACKGROUND.
The Information does not constitute or form part of, and should not be construed as (a) an offer or the solicitation of an offer to subscribe for or purchase
any securities issued by the Company, or (b) any form of financial opinion, recommendation or investment advice with respect to any securities or
financial instruments.
The Information contains forward-looking statements. All statements other than statements of historical fact included in the Information are forward-
looking statements. Forward-looking statements give the Company’s current expectations and projections relating to its financial condition, results of
operations, plans, objectives, future performance and business. These statements may include, without limitation, any statements preceded by, followed
by or including words such as “target,” “believe,” “expect,” “aim,” “intend,” “may,” “anticipate,” “estimate,” “plan,” “project,” “will,” “can have,” “likely,”
“should,” “would,” “could” and other words and terms of similar meaning or the negative thereof. Such forward-looking statements involve known and
unknown risks, uncertainties and other important factors beyond the Company’s control that could cause the Company’s actual results, performance or
achievements to be materially different from the expected results, performance or achievements expressed or implied by such forward-looking
statements. Such forward-looking statements are based on numerous assumptions regarding the Company’s present and future business strategies and
the environment in which it will operate in the future. The Company disclaims any obligation to update or revise any forward-looking statements, whether
as a result of new information, future events or otherwise.
27You can also read