Finnair Capital Markets Day - Welcome to 22 May 2014, Helsinki
←
→
Page content transcription
If your browser does not render page correctly, please read the page content below
Welcome to
    Finnair Capital Markets Day
                     22 May 2014, Helsinki

1                      © Finnair | Capital Markets Day, 22 May 2014
Today’s Agenda
                             Topic                         Presenter                Time               Pages
    Welcome by the Chairman of the Board           Klaus Heinemann, Chairman         13:00                    -

    Delivering on Strategy                         Pekka Vauramo, CEO                13:20                 6-25

                                                   Greg Kaldahl, SVP Resource
    Network development and JBA's                                                    14:00                26-54
                                                   Management

    Break                                                                            14:30

    Commercial Strategy- Closing the revenue gap   Allister Paterson, CCO            15:00                55-65

                                                   Juha Järvinen, Managing
    Cargo’s role in Asian growth                                                     15:30                66-76
                                                   Director of Finnair Cargo

    Break                                                                            15:45

    Fleet and funding strategy                     Erno Hildén, CFO                  16:00              77-100

    Closing remarks                                Pekka Vauramo, CEO                16:40                    -

    Cocktails and informal discussion                                                17:00

2                                                                               © Finnair | Capital Markets Day, 22 May 2014
Introducing the Finnair Team
    Experienced, international management team

                  Klaus Heinemann
                  b. 1951, Diplom Kaufmann, German citizen. Chairman of the Finnair Board of Directors since 27 March 2013
                  and Member of the Board since 2012. Mr. Klaus Heinemann was the CEO of AerCap Holdings N.V., a NYSE-
                  listed global aircraft leasing company, in 2003-2011, Member of the Executive Board of DVB Bank, focused on
                  transport financing, in 1998-2002, Global Head of Aviation/Shipping at the Long-Term Credit Bank of Japan
                  (LTCB) and the Co-Head of LTCB's London branch in 1988-1998, and held various positions in Bank of America
                  in 1976-1988.

                  Pekka Vauramo
                  b. 1957, M. Sc. (Mining). President and CEO as of 1 June 2013. Mr. Vauramo joined Finnair from Cargotec, a
                  Finnish cargo and load handling company, where he held different management position between 2007 and
                  2013. Before his transfer to Finnair, Mr. Vauramo was based in Hong Kong since 2010 as COO of the
                  MacGregor Business Area. Between 1985 and 2007 Mr. Vauramo started worked at Sandvik, a Swedish mining
                  and construction company.

                  Erno Hildén
                  b. 1971, M.Sc. (Econ.), CFO, in Finnair's service since 1997. Mr. Hilden's previous posts include VP for Finnair
                  Leisure Flights business unit and various business development posts in Finnair corporate management. Prior to
                  his present position he was Finnair Plc's COO.

3                                                                                                    © Finnair | Capital Markets Day, 22 May 2014
Introducing the Finnair Team
    Experienced, international management team

                  Gregory Kaldahl
                  b. 1957, B.Sc. (Education), SVP Resources Management, in Finnair's service since 2011. Mr. Kaldahl
                  previously worked for several airlines. His latest position was VP, Resource Planning for United
                  Airlines.

                  Allister Paterson
                  b. 1960, MBA, SVP Commercial Division, in Finnair's service since 2013. Mr. Paterson has previously
                  worked in the transportation sector, in senior leadership positions in Air New Zealand and as a CEO
                  of Air Canada Vacations. Prior to joining Finnair he worked as a CEO of Seaway Marine Transport.

                  Juha Järvinen
                  b. 1976, MBA, Managing Director Finnair Cargo, in Finnair’s service since 2012. Mr. Järvinen has
                  worked in aviation industry for 16 years, with previous positions within SAS Group in the UK,
                  Finland, Estonia and Sweden within passenger commercial and airport operations. Prior to joining
                  Finnair he worked as VP International Airport Operations for SAS Scandinavian Airlines in Stockholm

4                                                                                          © Finnair | Capital Markets Day, 22 May 2014
Disclaimer
    This document includes forward-looking statements. These forward-looking statements may be identified by words such as “may,” “will,” “expect,” “intend,” “anticipate,”
    “believe,” “estimate,” “plan,” “project,” “could,” “should,” “would,” “continue,” “seek,” “target,” “guidance,” “outlook,” “forecast” and other similar words. Such statements
    include, but are not limited to, statements about the expected increase in debt, and other statements that are not historical facts. These forward-looking statements are
    based on the current objectives, beliefs and expectations of Finnair Plc. and its subsidiaries (the “Company”), and they are subject to significant risks and uncertainties
    that may cause actual results and financial position and timing of certain events to differ materially from the information in the forward-looking statements. The following
    factors, among others, could cause actual results and financial position and timing of certain events to differ materially from those described in the forward-looking
    statements: the impact of any business combination transaction, including the challenges and costs of integrating operations and achieving anticipated synergies; the
    effects of any planned or in process divestitures; the price of, market for and potential market price volatility of the Company’s common stock ; the Company’s significant
    liquidity requirements and substantial levels of indebtedness; potential limitations on the Company’s use of certain tax attributes; the impact of significant operating losses
    in the future; downturns in economic conditions that adversely affect our business; the impact of the price and availability of fuel and significant disruptions in the supply
    of aircraft fuel; competitive practices in the industry, including the impact of industry consolidation; increased costs of financing, a reduction in the availability of financing
    and fluctuations in interest rates; the Company’s high level of fixed obligations and ability to fund general corporate requirements, obtain additional financing and respond
    to competitive developments; any failure to comply with the liquidity covenants contained in financing arrangements; provisions in credit card processing and other
    commercial agreements that may affect the Company’s liquidity; the impact of union disputes, employee strikes and other labor-related disruptions; the inability to
    maintain labor costs at competitive levels; interruptions or disruptions in service at the Company’s hub airport; regulatory changes affecting the allocation of slots; the
    Company’s reliance on third-party regional operators or third-party service providers; the Company’s reliance on and costs, rights and functionality of third-party
    distribution channels, including those provided by global distribution systems, conventional travel agents and online travel agents; the impact of extensive government
    regulation; the impact of heavy taxation; the impact of changes to the Company’s business model; the loss of key personnel or inability to attract and retain qualified
    personnel; the impact of conflicts overseas or terrorist attacks, and the impact of ongoing security concerns; the Company’s ability to operate and grow its route network;
    the impact of environmental regulation; the Company’s reliance on technology and automated systems and the impact of any failure or disruption of, or delay in, these
    technologies or systems; costs of ongoing data security compliance requirements and the impact of any significant data security breach; the impact of any accident
    involving the Company’s aircraft or the aircraft of its regional operators; delays in scheduled aircraft deliveries or other loss of anticipated fleet capacity; the Company’s
    dependence on a limited number of suppliers for aircraft, aircraft engines and parts; the impact of changing economic and other conditions and seasonality of the
    Company’s business; the impact of possible future increases in insurance costs or reductions in available insurance coverage; the impact of global events that affect travel
    behavior, such as an outbreak of a contagious disease; the impact of foreign currency exchange rate fluctuations; the Company’s ability to use certain tax attributes; and
    other economic, business, competitive, and/or regulatory factors affecting the Company’s business, including those set forth in the filings of the Company with the
    relevant financial authorities, especially in the “Risk Factors” and “Management’s Discussion and Analysis of Financial Condition and Results of Operations” sections of their
    respective annual reports. Any forward-looking statements speak only as of the date hereof or as of the dates indicated in the statements. The Company does not
    assume any obligation to publicly update or supplement any forward-looking statement to reflect actual results, changes in assumptions or changes in other factors
    affecting these forward-looking statements except as required by law.

5                                                                                                                                                 © Finnair | Capital Markets Day, 22 May 2014
The Finnair opportunity
    Our strategic targets and roadmap to reaching them

    Pekka Vauramo, CEO
    Finnair Capital Markets Day, 22 May 2014

6                                                        © Finnair | Capital Markets Day, 22 May 2014
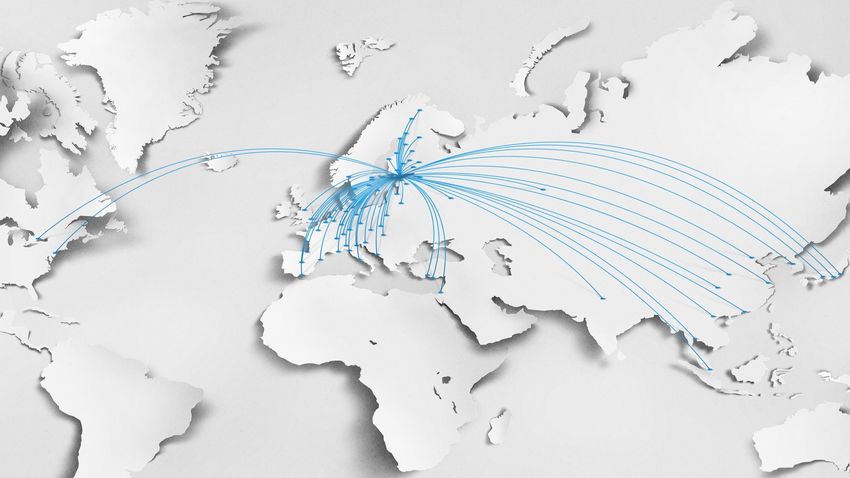
Finnair is a network airline connecting Asia
    and Europe

                                                      North-      Leisure
                                                      Atlantic     11 %
     More than                                          5%
                      Over
      9 million                    Fleet of 77
                  60 European                       Finland
    passengers         and         aircraft, of       4%
                                                                            Asia
     and MEUR     15 long-haul      which 44                                49 %
      2,400 in    destinations    operated by                    Europe
    revenue in                       Finnair.                     31 %
        2013
                  (Summer 2014)                      2013
                                                  ASK split
7                                                                                  © Finnair | Capital Markets Day, 22 May 2014
Major achievements since CMD 2012

             Cost structure

                           Commercial

                                Operations

                              Network

               Financing

8                                            © Finnair | Capital Markets Day, 22 May 2014
We have built one of the best operational
    airlines in the world...
    By focusing on:                         2013 performance

                                                                             European               Finnair
                                                                             benchmark*
    • Structure, size, governance         Punctuality                                84.2%                  89.4%

    • Commitment to quality and safety    Regularity                                 98.9%                  99.8%

    • Operational processes               Bags (/1000 pax)                               9.6                      8.1

                                          Connection reliability                       98%                  98.8%
    • Hub management
                                          Safety                                                      1st-3rd**
    • Vendor management

                                                                                                            * Source: AEA
                                         ** JACDEC 2013 safety ranking. JACDEC =Jet Airliner Crash Data Evaluation Centre.
9                                                                                      © Finnair | Capital Markets Day, 22 May 2014
...and improved cost efficiency & asset
     utilization
     Improved CASK                                         Higher utilization
               0,08                                                           16
                      0,071   0,070      0,071     0,069                                                                       +0.6%
               0,07                                                           14             +1.3%
                                                                                                           +3.6%

                                                            Block hours/day
                                          +14.9%   +1.6%
                                 +6.0%
               0,06                                                           12
     € cents

               0,05                                                           10
                                 -4.6%
                                          -4.1%
                                                   -3.3%
               0,04                                                           8                                          +8.4%
                                                                                                     +7.8%
                                                                                          +7.6%
               0,03                                                           6
               0,02                                                           4
               0,01                                                           2
                 0                                                            0
                      2010     2011      2012      2013                            2010     2011         2012               2013
                         CASK ex-fuel    Fuel                                       Narrowbody       Widebody

10                                                                                                   © Finnair | Capital Markets Day, 22 May 2014
Finnair share and bond price development
Finnair share price development Finnair Bond price development
1 Jan 2012-16 May 2014 since 27 Aug 2013
Finnair
3,50 market cap
1 800 000 105,5
Finnair MEUR 378
3,30 (16 1
May
6002014)
000
market cap 105,0
3,10 MEUR 295 1 400 000
(31 Dec 2011) 104,5
2,90
1 200 000
104,0
2,70
1 000 000
2,50 103,5
800 000
2,30
103,0
Finnair 600 000
2,10 market cap
102,5
1,90 MEUR 283 400 000
(3 Dec 2012)
200 000 102,0
1,70
1,50 0 101,5
Volume, shares Close, EUR
11 © Finnair | Capital Markets Day, 22 May 2014Delivering on strategy for profitable growth
Doubling Asian revenues by 2020
from 2010 level
Growing traffic via Helsinki
by optimising its strategic location
Creating shareholder value
- delivering 6% operational EBIT
12 © Finnair | Capital Markets Day, 22 May 2014Doubling Asian revenues
by 2020
13 © Finnair | Capital Markets Day, 22 May 2014Doubling Asian revenue – Where are we now?
Asian traffic revenue, MEUR 42% of 2013 passenger revenue
from Asian traffic
CAGR
2014–2020
6.96% 3%
9%
9%
42%
37%
Asia Europe
Domestic Leisure
North Atlantic
* Based on guidance given on 7 May 2014:”Finnair estimates 2014 turnover to be close to 2013 levels.”
14 © Finnair | Capital Markets Day, 22 May 2014Europe-Asia travel expected to increase more than
100% by 2020
Passenger flows
and hub throughput
(Asia and Europe, 2020E)
2010 PAX flows:
Europe – Middle East
130 million
2020E /Asia (pax/yr)
CAGR
(2020E)
60 million +6.3%
PAX throughput at major
(2010)
international airports
(pax/yr) M=million
M-East
180M
China's
Notes:
1. Pax throughput includes both domestic, international and terminal passengers. Figures
top 3
include both inbound and outbound pax calculated on basis of country-region pairs. hubs
2. Data available for Mainland China airports does not disaggregate domestic and
BKK
300M
international passengers. 90M
3. PAX throughput Middle East includes Dubai airport (112m); Doha (38m); Abu Dhabi KUL
(26m). China includes Beijing (155m); Guangzhou (88m); Shanghai Pudong (83m)
80M HKG
Source:
IATA, ATI database, BCG analysis; IATA Country Forecasts; BCG Analysis; World Bank. SIN 120M
90M
15 © Finnair | Capital Markets Day, 22 May 2014China’s second tier cities offer great potential
2010 GDP for urban clusters Urban clusters in China and their hub
USD Billions cities
Shanghai 527
Changchun-
Switzerland 527 Harbin
Jingjinji
Liao central-
Jingjinji 475 Huhehaote
south
Taiyuan Shandong
Central
Belgium 469 Guanzhong Byland
Hefei
Nanjing
Yangzi mid-lower
Chengdu Shanghai
Shandong 418 Chongqing Hangzhou
Nanchang
Changzhutan Coast West
Austria 378 Kunming
Shenzhen
Guangzhou (includes Foshan)
Nanning
Guangzhou 357
0 200 400 600
Source: Dominic Barton, 2013.
16 © Finnair | Capital Markets Day, 22 May 2014Joint Business Agreement in Europe-Japan
traffic strengthens our position in Japan
35%
Market share in EUR-JP vv Traffic*
JAPAN
30%
25%
20%
15%
10%
5%
0%
• After joining the SJB we are now a
part of the largest joint business in
Europe–Japan vv. traffic
* Source: SRS Q2 2014.
17 © Finnair | Capital Markets Day, 22 May 2014Our strengths in Asia – Europe transfer traffic
Shortest and fastest
Asia-Europe route
Early mover in
Europe-Asia direct
flights
One of world's most
punctual airlines
Helsinki airport hub
Strong Nordic
brand appeal
On-going long-haul
product development
18 © Finnair | Capital Markets Day, 22 May 2014Growing traffic via Helsinki 19 © Finnair | Capital Markets Day, 22 May 2014
Highly efficient Helsinki hub supports Asia-
     Europe traffic growth
     Room for growth in Helsinki-Vantaa...   ...with 24h rotation benefits to Asia
     •   3 runways                           •   Sustainable competitive advantage and cost
     •   35 min minimum connection time          benefits:
     •   Uncongested airspace                    – Fastest connections between North-
                                                    Eastern Asia and Northern Europe
                                                 – Very high aircraft utilisation in long-haul
                                                    traffic
                                                 – Less need for additional crew members
                                                    due to flight time restrictions
                                                 – Smaller fuel consumption due to shorter
                                                    flight times

                                                                         © Finnair | Capital Markets Day, 22 May 2014
20
Cost competitive European feeder network a
necessity for Asian traffic growth
European competitive landscape We focus on
• Lowering cost base in short-haul flying
– Labour costs
– Possible alternative measures
• Continuing Flybe cooperation
• Decision on short haul fleet renewal in
the next 18-24 months
21 © Finnair | Capital Markets Day, 22 May 2014Creating shareholder value 22 © Finnair | Capital Markets Day, 22 May 2014
Our key mid-term priorities
     The Tools

          Fleet strategy         Financing        Strategic partnerships

     The Building Blocks

       New Digital Finnair    Network Strategy            Cargo

     The Foundation
        Competitive Cost     Leading Commercial       Safe, Efficient
           Structure              Strategy             Operations
23                                                       © Finnair | Capital Markets Day, 22 May 2014
We are well on track in achieving cost savings
– flight crew labour costs still under negotiation
Savings reached by 22 May 2014: MEUR 167 Total target
Phase I: MEUR 140 MEUR 200
Other 136 4 23
Phase II: MEUR 60
Pilots 17
Cabin 18
Technical & ground services 48
Other employee groups 17
Phase I realised Phase I additional saving reached Phase II realised Phase II remaining target
24 © Finnair | Capital Markets Day, 22 May 2014We are building the foundation for growth
• Competitive cost structure will be key Growth
for profitable growth, therefore cost 2016
savings remain in our focus.
2015
• As a vital part of our topline growth,
we continue to implement our new Revenue
enhancement A350s
Commercial strategy and closing the
identified revenue gap.
2014
• First A350s enter our fleet next year,
Cost
and we are ready to grow our traffic
savings
building on our existing strengths.
25 © Finnair | Capital Markets Day, 22 May 2014Thank you
For further information, please contact Finnair IR:
Financial Comms & IR Director Mari Reponen,
tel. +358 9 818 4054, mari.reponen@finnair.com
Follow me on Twitter: @marireponen
IRO Kati Kaksonen,
tel. +358 9 818 2780, kati.kaksonen@finnair.com
Follow me on Twitter: @KatiGemini
26 Finnair Investor presentation February 2014You can also read