Tadawul and Dubai Financial Market - A Comparative Study
←
→
Page content transcription
If your browser does not render page correctly, please read the page content below
http://jbar.sciedupress.com Journal of Business Administration Research Vol. 9, No. 2; 2020

 Tadawul and Dubai Financial Market - A Comparative Study
 Issam Tlemsani1, Fai Albadeen2, Ghada Althaaly2, Maha Aljughaiman2 & Hala Bubshait2
1
 The Center of International Business, London, United Kingdom
2
 Al-Khobar, Dammam, Saudi Arabia
Correspondence: Issam Tlemsani, The Center of International Business, London, United Kingdom.

Received: October 31, 2020 Accepted: November 3, 2020 Online Published: November 4, 2020
doi:10.5430/jbar.v9n2p45 URL: https://doi.org/10.5430/jbar.v9n2p45

Abstract
This research is intended to identify the fundamentals of stock valuation and utilize them in the macro analysis and
micro valuation of two major stock exchanges ‘Tadawul’ and ‘Dubai Financial Market’. These stock exchanges are
compared in terms of their strengths and weaknesses according to significant economic indicators, alongside
essential stock market determinants, all the while highlighting relevant relationships among them. Upon assessment,
GDP has a strong influence on the valuation of the market and KSA’s GDP growth in the last two years has been
slightly higher than UAE’s growth, affecting projected GDP growth rates. Tadawul performed better than DFM in
P/E ratio indicating a higher willingness to invest in the Saudi stock exchange as well as a higher return expectation.
DFM’s stocks are highly undervalued. It can be concluded that both stock exchanges are strong and competitive
respectfully, and their potential for growth depends on the economic market that they originate from.
Keywords: Tadawul, Dubai financial market, stock valuation, share index
1. Introduction
Micro and macro valuation of stock markets is the process of analyzation of existing markets by using qualitative
knowledge in the analysis of secondary data provided by the stock market exchange. This research is intended to
identify the fundamentals of stock valuation and utilize them in the macro analysis and micro valuation of two major
stock exchanges in Middle East, Tadawul and Dubai Financial Market. Tadawul (TASI) is the stock exchange of
Saudi Arabia, founded in 2007, and is supervised by the Capital Market Authority today. Tadawul is the only stock
market that is authorized to serve as a stock exchange in Saudi Arabia. According to the Tadawul listing guide, the
number of listings has reached 272 as of the first half of 2019 (Tadawul the Gateway to the Saudi Capital Markets,
2019). Tadawul’s market follows the global industry classification standard in having 20 diverse sectors. On the other
hand, Dubai Financial Market (DFM) is one of three stock exchanges located in the United Arab Emirates, founded
in 2000. It has a total of 178 listings and is supervised by the Securities and Commodities Authority (SCA). The
reason for choosing to analyze the Dubai Financial Market in particular against Tadawul stock exchange is because
in the recent years its market has flourished, much like the Saudi stock market, into becoming a hub for investment
opportunities, being two of the largest stock markets in the Middle East. Therefore, the implications of this research
include the result of the analogy of stock market valuations between the two markets in terms of growth patterns,
strengths and weaknesses, economic and stock market indicators, and the interconnectedness of the two.
Through analysis of available data, this research aims to compare between stock market exchange systems that are
operating in the Middle East, namely the relationship dynamics between Saudi Arabia’s Tadawul exchange in
juxtaposition with United Arab Emirates’ Dubai Financial Market. It examines the market’s pinnacles of
measurement in terms of indexes as well as overall market performances. This research will cover the body of work
necessary to achieve its aim within the scope outlined. Through examination of macro and micro economic valuation
methods of the stock market, the result of this research project will prove to be deliverable within scope. Pursuance
of the research methods outlined will yield the results necessary to evaluate the Saudi as well as the Emirates stock
markets within their respectful measurements.
The objective aimed to be achieved through this research is the exploration and full relevant comparison of the two
different Middle East based stock markets based on the factors outlined. Through background research in literature
review to data analysis of available information, the objective of the project will be met. Actions taken to complete
the research will include the fully-fledged in-depth analysis of measurements used by either stock market and the

Published by Sciedu Press 45 ISSN 1927-9507 E-ISSN 1927-9515
http://jbar.sciedupress.com Journal of Business Administration Research Vol. 9, No. 2; 2020

comparison of their results based on their methods. This study seeks further exploration of existing stock market
models, with a direct focus on Middle East based markets that are deemed necessary to further investigate by using
measuring systems of the growth rate model, the free cash flow to equity model, as well as various price ratios and
end of year returns.
The limitations of the research will be to the available online information and historical data provided by each of the
stock markets named, and will rely on calculation analysis as written by the chosen formulas, ratios and models used
to evaluate the markets.
2. Literature Review
The topic at stake revolves around the principles of stock market valuation which will be heavily expressed in this
research paper through the analysis and comparison of both the Saudi stock exchange, Tadawul, and Dubai stock
market, from a macro and micro perspective. Going back to the essentials of stock market valuation, previous studies
and theories are relied on to assess key concepts, link them to the elements of the topic at stake and utilize them to
formulate conclusions accordingly. Existing literature discusses the various aspects of the aggregate economy and
interrelated stock market determinants, causal relationships between the two, the macroeconomic perspective of
stock markets, global stock indexes, and components of the micro-valuation.
The overall analysis of the stock market requires undertaking a top-down approach, starting with the overall market
and economy, moving on to industry and ending with the individual company stocks. On a larger scale, the
performance of the stock market in particular is a projection of the expected performance of a country’s economy,
implying that the economy is led by the stock market, according to (Levine & Zerfoz, 1998) which have measured
the development of stock markets against several different indicators and have found, through statistical data, a
strong relationship between a preceding stock market development followed by economic growth. Several researches
have also proven that there is a positive causal relationship between the stock market and economic growth.
Financial analysts and investors assess the global economy through initially comparing countries’ gross domestic
product. According to (Brezina, 2011) the gross domestic product is the total market value of the entire output of a
country including all its goods and services produced. It serves as an indicator for the performance and health of a
country’s economy. (insert citation YEAR). The top-down approach suggests starting with the analysis of the global
economy, comparing and contrasting countries’ different GDP’s which helps to identify the public presentation of
that country and how well they are doing.
Furthermore, according to (Medura, 2008) suggested that the stock market can act as a driver to economic growth.
When it comes to stock price movements, they affect the sentiments in the economy of both consumers and investors.
More precisely, sentiment indicators are used to determine what investors and consumers expect of the economy and
how they feel about their spending (optimistic or pessimistic), and has the ability to influence the gross domestic
product both positively and negatively according to stock market trends. In events of a bull-market, where prices of
securities are increasing, there is a strong overall demand for stocks due to more wealth/profit and high consumer
and investor confidence, which leads to higher spending thus increasing the GDP. In events of a bear-market, where
prices of securities are decreasing, this yields lower wealth/profit in the economy and results in pessimistic
consumers and investors which decreases spending and lowers GDP. Therefore, a country’s GDP report is analyzed
by investors to determine the health of an economy and long-term growth.
After determining which regions present a high GDP, the top-bottom approach moves on to the next stage, which is
to analyze trends of countries’ stock indexes, keeping record of stock prices, long-term charts, and technical analysis.
By analyzing the long-term chart of a country’s stock index. This is useful in allowing investors and analysts to learn
whether that country’s stock market is in upward trend or downward trend. According to Harold Watt (2013), the
movement of stocks in an upward direction is called an uptrend, and the movement of stocks in a downward
direction is called a downtrend. Watt stresses the importance of choosing to invest in an uptrend stock market.
The top-down approach ends with an analysis of the stock market from a micro perspective, using stock valuation
models and metrics such as the free cash flow to equity model (FCFE), P/E ratio, Price/book value ratio and several
others. For example, the FCFE has long been used by analysts to value stocks, and acts as an alternative or an
extension to the dividend discount model. According to (Damodaran, 2005), many such as Warren Buffet value a
company based on shareholder’s earnings. This is particularly prominent in this model, where shareholder’s earnings
are taken into consideration (all the cash flows that are left after paying out major business operations). Damodaran
continues stating that a noticeable difference between the traditional dividend discount model and the FCFE is that
the FCFE discounts the potential dividends rather than actual dividends. Other than that, effective use has been made

Published by Sciedu Press 46 ISSN 1927-9507 E-ISSN 1927-9515
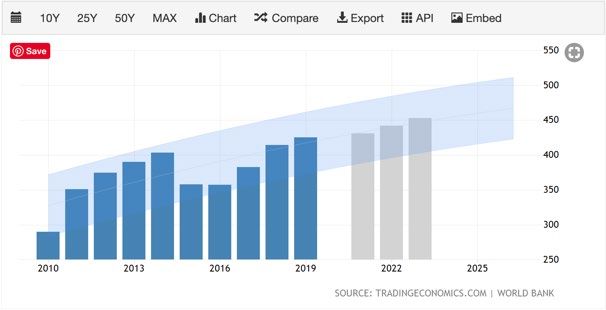
http://jbar.sciedupress.com Journal of Business Administration Research Vol. 9, No. 2; 2020

of the works of (Reilly et al., 2019) to interpret the roles of P/E ratio, Price/book value ratio, The price/cash flow
ratio, Price/sales ratio, and one-year returns, which are explained thoroughly and applied to the topic at stake.
3. Research Methodology
The research utilizes macroeconomic analysis and micro valuation techniques to compare and analyze the valuation
of the Saudi Stock Exchange and the Dubai Financial Market. Furthermore, the research utilizes both a quantitative
and qualitative approach since the numerical data pertaining Tadawul and the Dubai Financial Market are analyzed
using the qualitative knowledge gained using the above-mentioned book. Hence, the research is a involves the use of
secondary data analysis.
4. Findings
4.1 Macro Valuation of the Stock Market
One of the methods of valuation of the stock markets is by macro-analysis of the economy of the growth. To value
the stock markets of Saudi Arabia and Dubai, it is essential to analyze the GDP and forecasted GDP of the two
countries alongside the annual GDP growth rate and forecasted growth rate.

 Figure 1. The growth rate of the GDP of UAE and KSA (World Bank, 2020)

GDP has a strong influence upon the valuation of stock market. The value of the stock market is strongly dependent
upon the GDP of the country considering the linkage between GDP and corporate profit. In other words, the increase
in GDP leads to an increase in corporate profit, which in turn has a strong influence on the growth of the stock
market. When the GDP growth of rate of Saudi Arabia and the United Arab Emirates is compared, it can be seen that
over the last five years, which is between 2012 to 2017, the GDP of UAE has experienced a better growth rate
compared to that of Saudi Arabia. Nonetheless, the growth of Saudi Arabia has been slighter higher during the last
two years, which is the period of 2018 and 2019.
The direct implication of this data upon stock market valuation of Dubai Financial Market and Tadawul indicates that
the growth of the DFM was better in 2012 to 2017 compared to Tadawul. Nonetheless, DFM also experienced a
plunge in its all share index during 2017 and 2019 as a direct consequence of its low GDP growth. Nonetheless,
Tadawul did not experience a huge plunge in its all share index like DFM.

Published by Sciedu Press 47 ISSN 1927-9507 E-ISSN 1927-9515
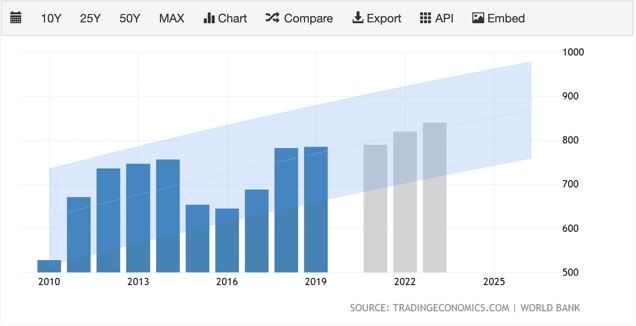
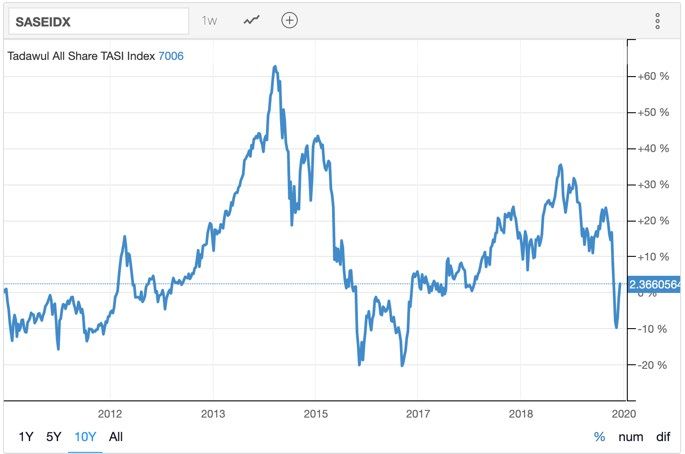
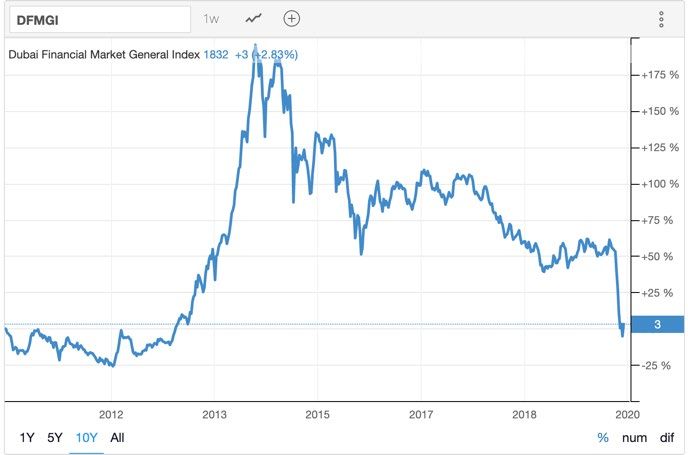
http://jbar.sciedupress.com Journal of Business Administration Research Vol. 9, No. 2; 2020

 The Forecasted GDP of KSA

 Figure 2. The Forecasted GDP of UAE (Trading Economics, 2020)

Data analysis and evaluation: The forecasted growth rate of the GDP of UAE is 2.60%. On the other hand, the
forecasted growth rate of the GDP of Saudi Arabia is 1.91%. It is highly unlikely that both the countries will be able
to achieve this growth in the GDP with the current situation of coronavirus. One of the criticisms of using
macroeconomic analysis as a method of valuing stock market can be seen her (Trading Economics, 2020).
The current crisis of Covid-19 has caused the stock markets of both Tadawul as well as Dubai Financial Market to
crash. This unforeseeable change cannot be seen with the help of preliminary GDP data. However, there is light at
the end of every tunnel. Therefore, post Covid-19, the stock markets of both DFS and Tadawul might experience a
significant due to Dubai Expo 2020 and Saudi Vision 2030 respectively (Augustine, 2019) Nevertheless, prior to the
Covid-19 crisis, it can be seen that the changes in the GDP of the countries have direct impact on the stock market
value. Hence, if a normal situation is assumed then the value of GDP of Saudi Arabia is more than that of UAE.
Nonetheless, the GDP purchasing power parity of UAE is higher than that of Saudi Arabia. Furthermore, in terms of
GDP purchasing power parity, UAE is the seventh largest country in the world and Saudi Arabia is the seventeenth
largest country (World Bank, 2019).

 Figure 3. Comparing the All Share Index of Dubai Financial Market and Tadawul (Trading Economics, 2020)

Published by Sciedu Press 48 ISSN 1927-9507 E-ISSN 1927-9515
http://jbar.sciedupress.com Journal of Business Administration Research Vol. 9, No. 2; 2020

Data evaluation and analysis: The GDP of the country is a good factor for valuing the stock market. All share index
of UAE and KSA are synonymous to the growth of the GDP. This is because the growth of the GDP leads to
corporate profits, which is essential for the growth of stocks. Hence, macroeconomic analysis is a good technique to
value stock markets. However, the macroeconomic analysis could not predict the sudden downfall in all share index
of both the stock markets due to coronavirus. Therefore, other methods of valuation of stock market should be used
to compare and contract Tadawul and DFM.
4.2 Micro Valuation of the Stock Market
4.2.1 Free Cash Free Equity (FCFE) Model
The FCFE model utilizes a combination of the next year’s estimated cash flow and discount rate to value the stock
market. It was extremely challenging to find these figures for Tadawul and DFM. Hence, this method of valuation of
stock market is not utilized in many researches. Nonetheless, there are few other alternative relative valuation ratios
that can be used to value the Tadawul and DFM stock markets. These alternative valuation ratios are price/earnings
ratio (P/E Ratio), the price/book value ratio (P/BV), the price/cash flow ratio (P/CF), the price/sales ratio (P/S) and
one-year returns.
4.2.2 Price/Earnings Ratio (P/E Ratio)
The formula for P/E Ratio based on dividend discount model is:
 1⁄ 1
 P/E = −
 (1)
Where D1 is the dividend expected in Period 1
 • E1 is the earnings expected in Period 1
 • k is the required rate of return on the stock
 • g is the expected growth rate of the dividends for the stocks

Table 1. Illustration of the P/E ratio of Tadawul and Dubai Financial Market
Stock market P/E Ratio
Saudi Stock Exchange (Tadawul) 19.51
Dubai Financial Market (DFM) 6.72

Data analysis and evaluation: A higher P/E Ratio means that stock market investors are willing to pay a higher value
considering the higher expected growth in the shares. Hence, a higher P/E Ratio is better since it shows that the
anticipated growth of the stocks is higher. The P/E ratio of Tadawul is higher than DFM, thereby depicting that
investors expect a higher growth in stocks of Tadawul compared to DFM.
4.2.3 The Price/Book Value Ratio (P/BV)
The following is the formula for P/BV Ratio:

 P/BV Ratio = (2)
 +1

Where, Pt is price of the stock in Period t
 • BVt+1 is the estimated end-of-yearbook value per share

Table 2. Illustration of the P/BV ratio of Tadawul and Dubai Financial Market
Stock market P/BV ratio
Saudi Stock Exchange (Tadawul) 1.6779
Dubai Financial Market (DFM) 0.6399

Data analysis and evaluation: A good P/BV ratio is below 1. This is because a value of 1 shows undervalued stocks.

Published by Sciedu Press 49 ISSN 1927-9507 E-ISSN 1927-9515
http://jbar.sciedupress.com Journal of Business Administration Research Vol. 9, No. 2; 2020

However, investors consider a value of below 3 as sufficiently good. The P/BV Ratio of Tadawul is higher than DFM.
Furthermore, the P/BV ratio of DFM is below 1. Hence, the stocks of DFM are highly undervalued and a growth in
its value can be expected. Nonetheless, the P/BV value of Tadawul is not bad.
4.2.4 The Price/Cash Flow Ratio (P/CF)

 P/CF = (3)
 +1

Where
 • Pt is the of the stock in Period t
 • CFt+1 is the expected cash flow per share
The statement of consolidated cash flow for Tadawul for the financial year of 2019 has not been released yet
considering that the auditing period is not over. Hence, the P/CF formula cannot be calculated for Tadawul.
Therefore, it will be impossible to compare the P/CF of Tadawul and DFM.
4.2.5 Price/Sales Ratio (P/S)
The following is the formula for P/S Ratio

 P/S = (4)
 +1

Where, Pt is the price of the stock in period t
 • St+1 is the expected sale per shares

Table 3. Illustration of the P/S ratio of Tadawul and Dubai Financial Market
Stock Market P/S ratio
Saudi Stock Exchange (Tadawul) 2.7532
Dubai Financial Market (DFM) 1.3458

Data analysis and evaluation: A lower value of P/S Ratio is better since it signifies the investment of the investor
with respect to the sales of the company. A good P/S Ratio is between 1 and 2. Hence, the P/S Ratio of DFM is good.
Furthermore, the P/S Ratio of DFM is also better compared to Tadawul considering its low value. Therefore, DFM is
performing better with respect to the P/S Ratio.
One-year returns
 −
The formula for one-year returns is as follows = (5)
 100%

Where
 • EYP is the End of year price
 • BYP is the beginning of the year price

Table 4. Illustration of one-year returns Tadawul and Dubai Financial Market
Stock market One-year returns
Saudi Stock Exchange (Tadawul) -20.20%
Dubai Financial Market (DFM) -31.17%

The negative one-year return of the both the stock markets signify that it is not able to give a profit to its investors.
Furthermore, the loss incurred by investors of DFM is higher than Tadawul considering that Tadawul has a return
-20.20% and DFM has a return of -31.17%.

Published by Sciedu Press 50 ISSN 1927-9507 E-ISSN 1927-9515
http://jbar.sciedupress.com Journal of Business Administration Research Vol. 9, No. 2; 2020

5. Conclusions
After comparing the DFM and Tadawul, it can be said that both stock exchange markets are equally strong and
competitive. It is difficult to choose the stock market, which is performing better since the same external factors
influence the GDP of the two countries since the two countries are primarily oil-based. Moreover, the use of
valuation ratios also depicts that Tadawul has a better P/E ratio and one-year return than DFM. However, DFM has a
better P/BV ratio and P/S ratio compared to Tadawul. Hence, both the stock markets have its own set of strengths and
weaknesses. Therefore, it is better to understand the strengths and weaknesses of the two stock markets and not
conclude that one is a better performer than the other.
In brief, it can be concluded that the stock exchange markets of both Saudi Arabia and Dubai have its own sets of
weaknesses and strengths. Furthermore, both the stock exchange markets have similar growth patterns considering
that both the economies are strongly oil, aluminum and so on. Furthermore, the valuation ratios also depict that both
have equal strengths and opportunities. Figure 4 provides a summary of the valuation ratios of DFM and Tadawul:

 Valuation ratios of DFM and
 Tadawul
 -31.17
 One-year returns
 -20.2

 1.3458
 P/S ratio
 2.7532

 0.6399
 P/BV Ratio
 1.6779

 6.72
 P/E Ratio
 19.51

 -40 -30 -20 -10 0 10 20 30

 Dubai Financial Market (DFM) Saudi Stock Exchange (Tadawul)

 Figure 4. Summary of the Valuation Ratios of DFM and Tadawul

The research analyzes the strengths and weaknesses of the DFM and Tadawul during the process of valuation of the
stock market. It provided a great opportunity to apply the knowledge gained in the security analysis and portfolio
management course. However, if the research would have been restarted then the connections between the research
findings and literature review would have been stronger.
Furthermore, one of the main practical outcomes of the research is that it inculcates a better understanding for
investors in the stock market. Moreover, it also provides an in-depth evaluation of the dynamics of the working of
the stock exchange market. Hence, in short, the research the process of valuation of Tadawul and DFM involved the
application several concepts essential for better understanding security analysis and portfolio management.
References
Augustine, B. (2019). Expo 2020’s to have long term positive impact on Dubai. Retrieved April 10th, 2020, from
 https://gulfnews.com/business/expo-2020s-to-have-long-term-positive-impact-on-dubai-1.68366581
Bloomberg. (2020). Dubai Financial Market General Index. Retrieved 10th April 2020, from
 https://www.bloomberg.com/quote/DFMGI:IND
Bloomberg. (2020). Tadawul All Share Index. Retrieved 10th April 2020, from

Published by Sciedu Press 51 ISSN 1927-9507 E-ISSN 1927-9515
http://jbar.sciedupress.com Journal of Business Administration Research Vol. 9, No. 2; 2020

 https://www.bloomberg.com/quote/SASEIDX:IND
Damodaran, A. (2005). Valuation Approaches and Metrics. Retrieved from
 https://books.google.com.sa/books?id=8zzDbY8tTrYC&dq=free+cash+flow+to+equity+valuation+model&sour
 ce=gbs_navlinks_s
Hayes, A. (2020). Yearly Rate of Return Method. Retrieved 10th April 2020, from
 https://www.investopedia.com/terms/y/yearly-rate-of-return-method.asp
Levine, R., & Zervos, S. (1998). Stock Markets, Banks, and Economic Growth (3rd ed., Vol. 88). American
 Economic Association. Retrieved from
 https://www.isid.ac.in/~tridip/Teaching/DevEco/Readings/07Finance/06Levine&Zervos-AER1998.pdf
Medura, J. (2008). Financial Institutions and Markets. Retrieved from
 https://books.google.com.sa/books?id=i3w6fSIgOiIC&dq=stock+prices+and+economic+growth&source=gbs_n
 avlinks_s
Reilly, F., Brown, K., & Leeds, S. (2019). Investment Analysis and Portfolio Management (11th ed., pp. 350 to 400).
 Singapore: Cengage Learning Asia Pte Ltd.
Rezina, C. (2011, December 15). Understanding the Gross Domestic Product and the Gross National Product.
 Retrieved from https://books.google.com.sa/books?id=hpmh-fm2hVcC&dq=gross+domestic+product&source=
 gbs_navlinks_s
Tadawul Listings Guide 2019. (2019). Retrieved from
 https://www.tadawul.com.sa/wps/wcm/connect/a0a2d2ff-6c82-455b-b08e-f0c2e955c080/listingguide-EN2019.p
 df?MOD=AJPERES&CVID=mG7OEJH
Trading Economics. (2020). DFM general|DFMGI - Index Price|Live Quote|Historical Chart. Retrieved 10 April
 2020, from https://tradingeconomics.com/dfmgi:ind
Trading Economics. (2020). Saudi Arabia Stock Market (TASI)|1998-2020 Data|2021-2022 Forecast|Quote|Chart.
 Retrieved 10 April 2020, from https://tradingeconomics.com/saudi-arabia/stock-market
Trading Economics. (2020). United Arab Emirates GDP|1973-2019 Data|2020-2022 Forecast|Historical|Chart.
 Retrieved 10 April 2020, from https://tradingeconomics.com/united-arab-emirates/gdp
Watt, H. (2013, November). Stock Market Investment. Retrieved from
 https://books.google.com.sa/books?id=EZUVAgAAQBAJ&pg=PP28&dq=stock+market+is+uptrend+or+downt
 rend&hl=en&sa=X&ved=0ahUKEwi8nYbGrePoAhUB4BoKHbV4BwYQ6AEIKDAA#v=onepage&q=stock
 market is uptrend or downtrend&f=false
Wilkinson, J. (2020). Price to Sales Ratio Analysis & Definition • The Strategic CFO. Retrieved 10 April 2020, from
 https://strategiccfo.com/price-to-sales-ratio-analysis/
World Bank. (2019). GDP per capita (current US$)|Data. Retrieved 10th April 2020, from
 https://data.worldbank.org/indicator/ny.gdp.pcap.cd
World Bank. (2020). GDP growth (annual %) - United Arab Emirates, Saudi Arabia|Data. Retrieved 10th April 2020,
 from https://data.worldbank.org/indicator/NY.GDP.MKTP.KD.ZG?end=2018&locations=AE-SA&most_
 recent_year_desc=true&start=2010&view=chart

Copyrights
Copyright for this article is retained by the author(s), with first publication rights granted to the journal.
This is an open-access article distributed under the terms and conditions of the Creative Commons Attribution
license (http://creativecommons.org/licenses/by/4.0/).

Published by Sciedu Press 52 ISSN 1927-9507 E-ISSN 1927-9515
You can also read