Real Estate Summary - Demand remains strong and spreads reversed somewhat in early 2019 - UBS
←
→
Page content transcription
If your browser does not render page correctly, please read the page content below
Real Estate Summary
US Real Estate – Edition 2, 2019

Demand remains strong and
spreads reversed somewhat in early 2019.

                                           UBS Asset Management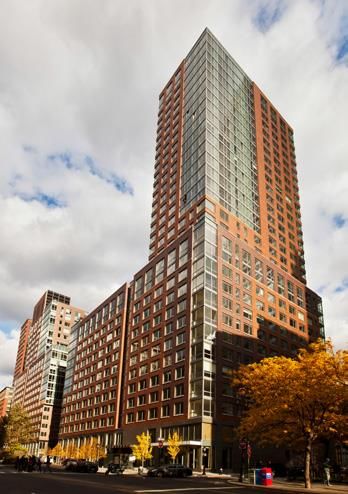
Commerical real estate

US real estate investors are entering year four of a period of relative calm, income-driven
performance. Demand is strong. Supply should be monitored closely. Capital flows are
supportive but not excessive, even as spreads show signs of easing.

Private commercial real estate continues to produce steady                        Boosts to sentiment were short lived as a partial government
returns, in line with long-term expectations, even though there                   shutdown followed by volatile trade negotiations added
are some differences across major property types, see exhibit 1.                  uncertainty to investor outlooks. Federal budget negotiations
For long-horizon real estate investors, this outcome was                          and debt ceiling debates loom on the horizon. Yet, tight labor
expected. After all, rent growth is positive. Expectations are                    market conditions support consumers. Favorable credit
for continued growth at a diminished rate compared                                conditions support economic growth, which most economists
to recent performance.                                                            expect to be positive and at or slightly above-trend during 2019.

During late 2018 and early 2019, investors experienced                            In real estate markets we turn to the fundamentals; demand for
heightened uncertainty and volatility in equity and bond                          space is supported by economic expansion and a strong labor
markets. After four short-term rate hikes in 2018, the US Federal                 market. Supply growth must be monitored closely, but currently,
Reserve indicated the December 2018 rate hike would likely be                     new construction levels are meeting strong demand, resulting in
followed by a pause.                                                              relatively stable occupancy rates and positive rent growth.

Exhibit 1: US real estate returns across property types
Rolling four-quarter total return (%)

   30

   20

   10

    0

  -10

  -20

  -30
    4Q08                          4Q10                         4Q12                         4Q14                  4Q16                     1Q19

          Apartments            Industrial         Office          Retail

Source: NCREIF Property Index as of March 2019. Past performance is not indicative of future results.

Page 2 of 8
We can further break out real estate revenue into occupancy At 3.8% as of March 2019, the national unemployment rate is
and rents. Occupancy rates are high relative to the past ten years near its lowest point since 1969. Job growth has been lumpy but
but face a small degree of downward pressure with supply is strong overall, exhibit 3. During the past year average monthly
growth matching or exceeding demand. As there is little room to job gains approached 220,000 per month. A tight labor market
increase occupancy, rent growth is the driving force behind generally puts slow, upward pressure on wage inflation but has
income gains, exhibit 2. Economic conditions create some made it tougher to fill open positions.
optimism that growth will continue to reflect positive
momentum in the US.
Exhibit 2: Property sector rent growth Exhibit 3: US job growth and unemployment rate
Year-over-year change (%) Change in employment (thousands of jobs) %
10 400 6.7
350 6.3
8
300 5.9
6 250 5.5
200 5.1
4 150 4.7
100 4.3
2
50 3.9
0 0 3.5
1Q15 1Q16 1Q17 1Q18 1Q19 May-14 Mar-15 Jan-16 Nov-16 Sep-17 Jul-18 Apr-19
Apartment Industrial Office Retail Job growth (L) Unemployment rate (R)
Source: CBRE-Econometric Advisors as of March 2019. Source: Moody's Analytics as of 3 May 2019.
A growing economy and tight labor market should continue to Realized and expected growth in real estate income directly
generate demand for real estate, with steady demand offsets upward pressure on real estate cap rates from the tight
supporting income growth. The tight labor market is one reason spread. Current economic expansion is considered to be self-
wage growth is expected to continue to accelerate in the US. US sustaining at or above the long-term average, US Gross
Consumer price inflation was relatively contained at 1.9% in the Domestic Product (GDP) increased by 3.2% during first quarter
year ending first quarter 2019. Expectations continue to be for a 2019, exhibit 4.
strong, but slowing, labor market and modest inflation in 2019.
Exhibit 4: US real GDP growth
Real GDP growth (%)
6
4
2
0
-2
-4
3Q09 1Q10 3Q10 1Q11 3Q11 1Q12 3Q12 1Q13 3Q13 1Q14 3Q14 1Q15 3Q15 1Q16 3Q16 1Q17 3Q17 1Q18 3Q18 1Q19
Quarterly annualized Annual growth
Source: Moody's Analytics as of 26 April 2019.
Page 3 of 8In December, the target range for the Fed Fund rate rose for the Total US commercial real estate sales volume was USD 458 bn in
fourth time in 2018 to 2.25% to 2.50%. The Fed has adopted a the year ending March 2019; up slightly compared to the prior
more patient perspective for 2019; the target range remains two 12-month periods, see exhibit 6. Sector trends remain
unchanged from year end. While the labor market remains consistent, with sales of retail and office properties decreasing
strong, national and global political hesitancy leads to the and sales of apartment, industrial and hotels increasing.
expectation for fewer changes to the Fed Funds Rate over the
course of 2019. One reason transaction volume is lower for retail and office
properties is that lenders have a higher appetite to provide debt
In 2019, we expect positive unlevered property returns driven by for industrial and apartment assets. Real estate debt capital is
growth in income with moderation in appreciation, relative to low cost and generally available but not free flowing like it was
recent years. In first quarter 2019, appreciation return recovered during the lead in to the last downturn. In 2018, increasing
somewhat from a dip the previous quarter, elevating the NCREIF interest rates compressed spreads available to lenders in a
Property Index gain to 1.8%, exhibit 5. competitive marketplace.
Exhibit 5: US property returns Exhibit 6: US transactions
% Transaction volume rolling 4Q (billions USD)
5.0 500
4.0 400
3.0 300
2.0 200
1.0 100
0.0 0
1Q11 1Q12 1Q13 1Q14 1Q15 1Q16 1Q17 1Q18 1Q19 1Q14 1Q15 1Q16 1Q17 1Q18 1Q19
Income return Appreciation return Apartment Industrial Office Retail Hotel
Source: NCREIF Property Index as of March 2019. Source: Real Capital Analytics as of March 2019.
Past performance is not indicative of future results.
The spread between property yields and the cost of debt
decompressed slightly in early 2019. On the whole, US
debt markets can be described as operational but not
excessive, which encourages development but not an abundance
of supply.
Page 4 of 8Long-term interest rates remain low relative to US history even
as those rates moved higher in 2018. The 10-year US Treasury
rate was 2.4% at the end of 2017 gaining 60 bps over 2018 to
an average of 3% in the fourth quarter. A subsequent 50 bps
drop in the 10-year Treasury in early 2019 eased much of the
capital market pressure but did not fully reverse the increase in
long-term interest rates over the prior year.
With little movement in cap rates, the downward move in
Treasury rates slightly increased spreads available in US real
estate, exhibit 7. Yet, spreads offered by real estate investments
are below long-term expectations, representing a change from
the wide spreads that drew capital so quickly in the wake of the
last recession.
While the real estate spread is no longer compressing, it is low
enough to support our expectation for slightly higher cap rates
by the end of 2019. There is no noticeable distress in the market
that might put stronger upward pressure on cap rates. Income is
growing; potential sellers can afford to be patient. In addition,
debt is available, and capital expenditures are increasing.
Exhibit 7: Commercial real estate spread
Basis points
500
400
300 Liberty Green/Liberty Luxe, New York, NY
200
100
0
1Q97 4Q99 3Q02 2Q05 1Q08 4Q10 3Q13 2Q16 1Q19
Spread (cap rate minus 10-year Treasury rate)
20-year average spread
Source: NCREIF Fund Index-Open-end Diversified Core Equity and Moody's
Analytics as of March 2019.
Page 5 of 8Property types Exhibit 8: Property sector vacancy and completion rates
Vacancy rate (%) Percent of inventory (%)
Apartments Apartments
The March 2019 US homeownership rate, at 64.2%, is 20 2.0
unchanged from one year ago. Persistence in the labor market 15 1.5
and consistent household formation help offset elevated
10 1.0
homeownership, leading to sustained demand for multifamily
rentals. Year-over-year rent growth was above inflation at 3.0% 5 0.5
in first quarter 2019. After trending down through most of 0 0.0
2018, apartment vacancy rates rose modestly in the fourth 1Q13 1Q14 1Q15 1Q16 1Q17 1Q18 1Q19
quarter and again in first quarter 2019, see exhibit 8. At
Vacancy (L) Supply (R)
4.6%, vacancy remains below the 20-year average of 5.4%.
The pace of new construction is not anticipated to slow Industrial
noticeably until 2020.
20 2.0
Industrial 15 1.5
In the year ended first quarter 2019, industrial net rent saw a 10 1.0
pop of 7.9% growth, notably above the five-year average of 5 0.5
5.3% per annum. The pace of completions remains elevated,
0 0.0
exhibit 8. Forecasts expect rising completion numbers in 2019 1Q13 1Q14 1Q15 1Q16 1Q17 1Q18 1Q19
and 2020. Industrial availability was 7.1% in first quarter 2019,
Vacancy (L) Supply (R)
down 20 bps from one year ago, nearly as low as it has been
since 2000. Even as demand remains high, rising completions
add some increasing risk to the outlook. Office
20 2.0
Office 15 1.5
New office deliveries decelerated slightly in first quarter 2019,
10 1.0
exhibit 8. Exhibiting characteristic volatility, office rent gains
outperformed inflation with Downtown's 7.0% annual growth; 5 0.5
this unsustainable growth spurt far exceeding Suburban office's 0 0.0
2.6% rent growth. Average office vacancy decreased 50 bps 1Q13 1Q14 1Q15 1Q16 1Q17 1Q18 1Q19
from one year ago. The gap between Downtown vacancy at Vacancy (L) Supply (R)
10.5% and Suburban vacancy at 13.5% remains wide.
Downtown deliveries accelerated to 1.3% of inventory,
Retail
while Suburban completions slipped to 1.2%, having passed
20 2.0
a peak period.
15 1.5
Retail 10 1.0
Increased disposable income and low unemployment should
support retail sales in 2019. Stability in high-quality properties is 5 0.5
likely offset by deterioration in others. Mall/lifestyle center 0 0.0
occupancy is flattening, while power center occupancy is 1Q13 1Q14 1Q15 1Q16 1Q17 1Q18 1Q19
increasing. Mall/lifestyle rent growth is volatile, while power Vacancy (L) Supply (R)
center annual rents have seen modest growth in the last two
annual periods. At 8.8%, availability in Neighborhood,
Source: CBRE-Econometric Advisors as of March 2019. Supply is shown as a
Community & Strip (NCS) retail is down 70 bps since the end of completion rate (i.e. completions as a percent of existing inventory).
2017. In the year ending first quarter 2019, NCS rents grew at a
pace of 4.1%, more than double the pace of inflation.
Page 6 of 8Viewpoint Even though 2018's rising interest rate environment reversed
and long-term interest rates fell during early 2019, uncertainty
persists. Transaction volume is sustaining a high level but shows
minimal acceleration. Appreciation remains modest. We expect a
Even as capital markets face dimished spreads and cap rates are
small upward movement in cap rates over the coming year.
closer to the cost of debt, fundamental strength in the US
economy acts as an offsetting factor by supporting income
Capital investment into stabilized assets is increasing, an
growth at the property level.
expected outcome in a long expansion. Debt and equity capital
is seeking growth strategies, and existing assets are under
Beginning in early 2016, US real estate entered a widely-
pressure to compete with new construction. Investors should pay
anticipated period of income-driven performance. US properties
careful attention to the risk-return expectations for incremental
are appreciating at about the pace of inflation. Appreciation
capital.
relates back to the positive rent growth generated by properties,
as opposed to the outsized influence of capital flows the US
experienced in 2014 and 2015.
A tight labor market and optimistic confidence measures
Looking more closely at the drivers of income, rent growth is the
reinforce our expectations for relatively good occupancy
true powerhouse behind the gains. An expectation for continued
rates and continued rent growth in the US real estate sector.
positive economic growth reinforces our view that property-level
income growth should outpace inflation even as the pace of
growth moderated in recent years. Income-generated
performance is consistent with a long-term expectation for
private commercial real estate investments.
Exhibit 9 – Historical performance
Total returns (%) 2016 2017 2018 4Q18 1Q19 10 year 20 year
Bar cap 3.0 4.0 (0.4) 1.5 3.3 3.9 4.8
S&P 500 12.0 21.8 (4.4) (13.5) 13.6 15.9 6.0
NAREIT 8.6 8.7 (4.0) (6.1) 17.2 18.8 11.1
CPI 2.1 2.1 1.9 (0.5) 1.2 1.8 2.2
NCREIF Property Index
Total 8.0 7.0 6.7 1.4 1.8 8.5 8.9
Income 4.8 4.7 4.6 1.1 1.1 5.5 6.3
Appreciation 3.1 2.2 2.1 0.3 0.7 2.9 2.5
NCREIF total returns by property type
Apartments 6.2 6.1 6.1 1.3 1.3 8.6 8.8
Hotel 4.9 7.6 7.6 1.2 0.4 6.3 6.9
Industrial 13.1 14.3 14.3 3.4 3.0 10.4 10.0
Office 6.0 6.8 6.8 1.6 1.6 7.5 8.2
Retail 5.7 2.2 2.2 (0.4) 1.7 8.9 10.0
Source: NCREIF, NAREIT, Morningstar and Moody's Analytics as of March 2019.
Page 7 of 8Real Estate Research & Strategy Team – US This publication is not to be construed as a solicitation of an offer to buy
or sell any securities or other financial instruments relating to UBS AG or
its affiliates in Switzerland, the United States or any other jurisdiction.
William Hughes UBS specifically prohibits the redistribution or reproduction of this material in
Tiffany Gherlone whole or in part without the prior written permission of UBS and UBS accepts no
liability whatsoever for the actions of third parties in this respect. The information
Christopher DeBerry and opinions contained in this document have been compiled or arrived at based
Kurt Edwards upon information obtained from sources believed to be reliable and in good faith
Samantha Hartwell but no responsibility is accepted for any errors or omissions. All such information
and opinions are subject to change without notice. Please note that past
Amy Holmes performance is not a guide to the future. With investment in real
Joshua Rome estate/infrastructure/private equity (via direct investment, closed- or open-end
Ryan Watts funds) the underlying assets are illiquid, and valuation is a matter of judgment by
a valuer. The value of investments and the income from them may go down as
well as up and investors may not get back the original amount invested. Any
market or investment views expressed are not intended to be investment
For more information please contact research. The document has not been prepared in line with the
requirements of any jurisdiction designed to promote the independence
of investment research and is not subject to any prohibition on dealing
UBS Asset Management ahead of the dissemination of investment research. The information
Real Estate Research – US contained in this document does not constitute a distribution, nor should it be
considered a recommendation to purchase or sell any particular security or fund.
A number of the comments in this document are considered forward-looking
UBS Realty Investors LLC statements. Actual future results, however, may vary materially. The opinions
10 State House Square expressed are a reflection of UBS Asset Management’s best judgment at the time
this document is compiled and any obligation to update or alter forward-looking
Hartford, CT 06103 statements as a result of new information, future events, or otherwise is
1-860-616-9000 disclaimed. Furthermore, these views are not intended to predict or guarantee the
future performance of any individual security, asset class, markets generally, nor
are they intended to predict the future performance of any UBS Asset
Management account, portfolio or fund. Source for all data/charts, if not stated
otherwise: UBS Asset Management, Real Estate & Private Markets. The views
Follow us on LinkedIn expressed are as of June 2019 and are a general guide to the views of UBS Asset
Management, Real Estate & Private Markets. All information as at 31 March 2019
unless stated otherwise. Published June 2019. Approved for global use.
© UBS 2019 The key symbol and UBS are among the registered and unregistered
trademarks of UBS. Other marks may be trademarks of their respective owners.
www.ubs.com/repm-research All rights reserved.
Page 8 of 8You can also read