CITIZEN PERSPECTIVE 2021 Citizen Survey - a - City of Winnipeg

Page created by Alex Cortez
 
CONTINUE READING
CITIZEN PERSPECTIVE 2021 Citizen Survey - a - City of Winnipeg
CITIZEN PERSPECTIVE
      2021 Citizen Survey a

May 2021
presented by:                 2021 Citizen Survey | City of Winnipeg   1
CITIZEN PERSPECTIVE 2021 Citizen Survey - a - City of Winnipeg
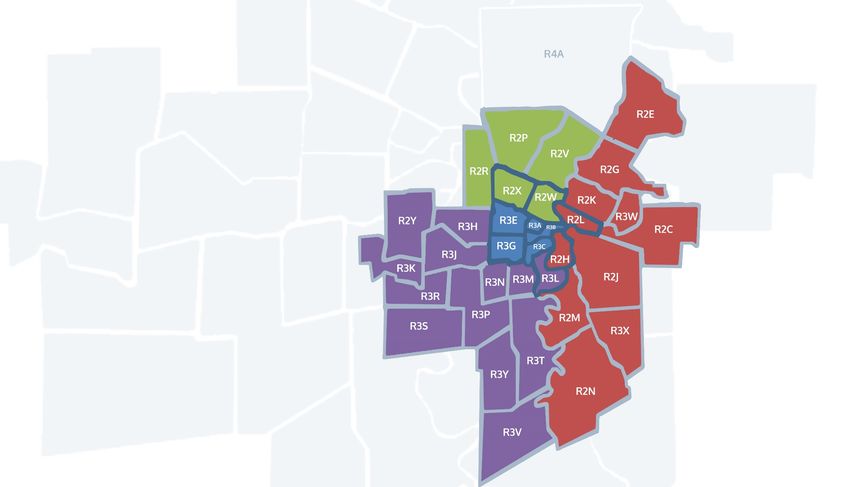
Background and Objectives
Project Background

 ●   Historically this study has been used as a tool for measuring the level of satisfaction of the
     citizen’s of Winnipeg.
 ●   The City of Winnipeg has conducted this study annually since 2001.

Project Objectives
1. Determine Winnipeg citizen’s levels of satisfaction regarding their city
2. Determine Winnipeg citizen’s current needs in their city
  ● Gauge how those needs have changed and where they are heading
       ○ e.g. Are specific issues trending downward or emerging?

COVID-19 adjustments

 ●   Where relevant, question wording was adjusted to reflect the pandemic and ask
     participants to reflect on their typical behaviour.
 ●   Responses that may have been impacted by COVID-19 are identified where applicable.

                                                                     2021 Citizen Survey | City of Winnipeg   2
Methodology

A total of 600 Winnipeg citizens aged 18 years and over were interviewed by telephone between
April 28 to May 18, 2021. The sample include both landlines and cell phone numbers. The final
results in this survey are weighted by age, gender, and the area of Winnipeg respondents reside
in according to 2016 Statistics Canada census data.

The margin-of-error for this telephone survey of 600 adults is +/- 4.1%, 19 times out of 20. The
margin-of-error is higher for sub-populations analyzed in these results.

Where applicable, this report compares the results of the 2021 survey with the results of
previous citizen satisfaction surveys conducted in 2017 to 2020.

Notes:
• Data presented is based on people who answered the survey questions (excludes “don’t
  know/refused” response).
• The percentages shown in this report may not add up to exactly 100%, due to rounding.
• Values less than 3% may not be shown in charts.

                                                                    2021 Citizen Survey | City of Winnipeg   3
Demographics [1/2]
        The majority of respondents are under 55 years old and nearly three-quarters are
        home owners.

                                                   Age                                                           Own/Rent Home

                                                                           65 and older
                                                    22%
                             31%
                   55+
                                                                          55 to 64
                                                     9%
                                                                                                                       Rent,
                                                                          45 to 54
                                                    24%                                                                29%
                             39%
                35 to 54                                                                                                            Own,
                                                                          35 to 44
                                                    16%                                                                             71%
                                                                          25 to 34
                             30%                    18%
                18 to 34                                                  18 to 24
                                                    12%

Q73 -- What age are you? (Base: All respondents. 2021 n=600) - unweighted
Q74 -- Do you rent or own your home? (Base: All respondents (excluding Don’t know/Refused). 2021 n=585) - unweighted

                                                                                                                        2021 Citizen Survey | City of Winnipeg   4
Demographics [2/2]
        The majority of respondents have some post-secondary education with 48% having a university
        degree. Of the 81% of residents who answered the income question, nearly two-thirds have a
        household income of $60,000 or more.

                          Level of Education                                                                        Household Income

                                                                                                                                  15%               $150K+
                                                          University degree(s)

                                        48%                                                                                       17%               $100K to
Where do they live?
                                                                                                               Area of Winnipeg
                                 Downtown
                                   10%
        West/Southwest
             35%

                                    East/Southeast
                                         36%

                     North
                      18%

                                                                                                                                                             Downtown
                                                                                                                                                             East/Southeast
                                                                                                                                                             West/Southwest
                                      Inner                                                                                                                  North
                                       City
                                                                                                                                                             Inner City
                                       26%                                                                                                                   Outer City

                  Outer City
                    74%

Q78 -- First three characters of postal code. (Base: All respondents (excluding Don’t know/Refused). 2021 n=598) – unweighted

                                                                                                                                2021 Citizen Survey | City of Winnipeg    6
How do they describe their Ethnic Origin?
        Over two-thirds of survey respondents described their ethnic origin as white/Caucasian.

                                                                               Ethnic Origin
                                         White/Caucasian (e.g., European)                                                                 68%
                                                       Indigenous or Aboriginal                       8%
                               South Asian (e.g., East Indian, Pakistani)                            7%
                                                                                 Filipino            7%
                                                               Black (e.g., African)                5%
                                                                                Chinese           2%
                                       Southeast Asian (e.g., Vietnamese)                         2%
                                                                     Latin American               1%
                                                      West Asian (e.g., Iranian)
THE RESULTS

   Contact Person Name – Click to Edit
   Phone Number – Click to Edit
   Email Address – Click to Edit
   Website Address – Click to Edit

                     2021 Citizen Survey | City of Winnipeg   8
2021 Overall Satisfaction

                                             Quality of Life
                                              (Very good/Good)

                                   2017     2018    2019    2020       2021

                                   92% 93% 93% 97% 89%

   Value for Tax Dollars                  Net Promoter Score                        Overall City Services
        (Very good/Good)                                                             (Very /Somewhat Satisfied)
                                          (Recommendation)
2017   2018   2019   2020   2021
                                                     1                        2017     2018      2019     2020     2021

70% 71% 68% 78% 64%                                                            88% 87% 88% 90% 87%

                                          Customer Service
                                          (Very /Somewhat Satisfied)

                                   2017     2018    2019    2020       2021

                                   83% 79% 81% 82% 78%

                                                                              2021 Citizen Survey | City of Winnipeg      9
Net Promoter Score Value
        27% are classified as Winnipeg Promoters, and the overall 2021 NET Promoter
        Score is +1. This is a 16-point decrease compared to 2020. Older citizens are
        more likely to be Promoters.
                                                                Likelihood of Recommending
                                                                 Winnipeg as a Place to Live
                    NPS:                  +9                       +11                     +11                        +17                      +1
                                                                                                                                                                   Promoters
                                          32%                      33%                      32%                                               27%
                                                                                                                     36%                                           (9-10 out of 10)

                                                                                                                                                                   Passives
                                          45%                                                                                                 47%
                                                                   45%                      47%                      45%                                           (7-8 out of 10)

                                                                                                                                                                   Detractors
                                          23%                      22%                      21%                      19%                      26%
                                                                                                                                                                   (0-6 out of 10)

                                         2017                     2018                     2019                     2020                     2021
                                                          Those more likely to be Promoters in 2021 include:
                                                           55 years or older (38%)

NET Promoter Score (NPS) is calculated by subtracting the Detractor score from the Promoter score (% Promoters - % Detractors)
Q2 -- On a scale from 0 to 10, where 0 is not at all likely and 10 is very likely, how likely would you be to recommend Winnipeg as a place to live? (Base: All respondents
(excluding Don’t know/Refused). 2021 n=593)

                                                                                                                                2021 Citizen Survey | City of Winnipeg           10
QUALITY OF LIFE

     Contact Person Name – Click to Edit
     Phone Number – Click to Edit
     Email Address – Click to Edit
     Website Address – Click to Edit

                       2021 Citizen Survey | City of Winnipeg   11
Quality of Life
        Although lower than previous years, the majority (89%) of Winnipeggers rate the overall
        quality of life in Winnipeg as very good or good.

                                                       Overall quality of life in Winnipeg today

      NET Very Good/Good:                   92%                       93%                       93%                       97%                        89%

                                           27%                        27%                       24%                                                 23%                    Very good
                                                                                                                          40%
                                                                                                                                                                           Good

                                                                                                69%                                                 66%
                                           64%                        66%                                                                                                  Poor
                                                                                                                          56%

                                                                                                                                                                           Very poor
                                            6%                         6%                        6%                                                  9%
                                                                                                                           3%
                                           2017                      2018                      2019                      2020                      2021

                                                    There are no demographic subgroups more likely rate quality of
                                                    life as very good or good.

Q3 -- In general, how would you have rated the overall quality of life in Winnipeg prior to the impacts of the coronavirus? (Base: All respondents (excluding Don’t know/Refused).
2021 n=599)

                                                                                                                                     2021 Citizen Survey | City of Winnipeg            12
Quality of Life Statements
                                                                                   Quality of Life Ratings
                                                                                       (Strongly agree/Agree)

                                                                                                                                            91%
                                                                                                                                              94%
       Easy to get around by car                     Easy to get around by car
                                                                                                                                         87%
                                                                                                                                            91%
                                                                                                                                           90%

                                                                                                                               77%                          47%: 55+ (strongly agree)
                                                                                                                                  80%
  Easy to get around by walking                  Easy to get around by walking
                                                                                                                             74%
                                                                                                                              75%
                                                                                                                                   81%                      78%: 35 to 54
                                                                                                                     66%                                    78%: Male
                                                                                                                       68%                                  71%: Outer City
      Feel safe walking alone at             Feel safe wlaking alone at night in
                                                       neighbourhood                                                64%                                     56%:
Perceptions of Winnipeg Statements [1/2]
                                                                                          Perceptions of Winnipeg Ratings
                                                                                                 (Strongly agree/Agree)

                                                                                                                                   85%
  I can find the information
       I need on the City of                 I can find the information I need on the
                                                     City of Winnipeg website

          Winnipeg website                                                                                                              88%

                                                                                                                            71%
       Believe the City of
 Winnipeg acts in the best                  I believe the City of Winnipeg acts in the
                                                     best interest of citizens

       interest of citizens                                                                                                       82%

           Believe that I can                                                                                   43%                                34%: White/Caucasian
 influence the decisions or                I believe that I can influence the decisions
                                               or direction of the City of Winnipeg

      direction of the City of
                    Winnipeg                                                                                          52%

                                                                                                         2021    2020

Q10 to Q12 -- I am now going to read you a few statements about your perception of Winnipeg. For each one, please tell me whether you strongly agree, agree, disagree, or strongly
disagree.(Base: All respondents (excluding Don’t know/Refused). 2021 n=527-579)

                                                                                                                                   2021 Citizen Survey | City of Winnipeg            14
Perceptions of Winnipeg Statements [1/2]
                                                                                      Perceptions of Winnipeg Ratings
                                                                                             (Strongly agree/Agree)

         I find the City of Winnipeg
                  to be a trustworthy          I find the City of Winnipeg to be a
                                               trustworthy source of information                                                    87%
               source of information

                 I believe the City of
                  Winnipeg's actions
              towards reconciliation
           with Indigenous peoples
                                                                                                                      70%
                                           I believe the City of Winnipeg's actions

               are making a positive       towards reconciliation with Indigenous
                                            peoples are making a positive impact

                               impact                                                                                                             There are no
                                                                                                                                                  demographic
                                                                                                                                                  subgroups more likely
                                                                                                                                                  to strongly or
                                                                                                                                                  somewhat agree with
                                                                                                                                                  these statements.
                                                                                                        2021

Q12A to Q12B -- I am now going to read you a few statements about your perception of Winnipeg. For each one, please tell me whether you strongly agree, agree, disagree, or
strongly disagree.(Base: All respondents (excluding Don’t know/Refused). 2021 n=490-560)

                                                                                                                                 2021 Citizen Survey | City of Winnipeg       15
Actions to Improve Quality of Life [1/3]
        Citizens most commonly mentioned housing and social programs for improving the quality of life in
        Winnipeg. This is up from 2020, however, other responses remain fairly similar.

                                                                Actions to Improve Quality of Life
                                                                                                       24%
                                  Housing / Social programs                                    15%
                                                                                       6%
                                                                                                      23%
                                        Roads / Infrastructure                                            29%
                                                                                                      24%
                                                                                                      23%
                                                  Crime / Policing                                     24%
                                                                                                                               51%
                                                                                                     22%
                                                Improve services                                       26%
                                                                                 0%
                                                                                                   20%
                                          Active living / Transit                                   21%
                                                                                                   20%
                                                                                         10%
                                                       City Planning                     10%
                                                                                       6%
                                                                                        8%
                                                             Economy                      11%
                                                                                      5%
                                                                                                     22%
                                                            All Others                            17%
                                                                                            11%                                                             2021
                                                                                   2%
                                                               Nothing              4%                                                                      2020
                                                                                     5%
                                                                                                                                                            2019
Q13 -- What actions do you think the City of Winnipeg could take to improve the quality of life in the City? (accept up to 3 answers) (Base: All respondents (excluding Don’t
know/Refused). 2021 n=464)

                                                                                                                                       2021 Citizen Survey | City of Winnipeg   16
Actions to Improve Quality of Life [2/3]
       Top Actions by perceived Quality of Life                                                                              Most common actions for
                                                                                                                           Good/Very good (87%, n=400)
             Housing / Social                   23%                                                •    Fix roads and streets, including back lanes (21%)
                   programs                       30%                                              •    Reduce crime / improve law enforcement / safety (13%)
                                                                                                   •    Improve public transit / rapid transit, including fares (12%)
                                                23%
     Roads / Infrastructure
                                                24%

                                                23%
              Crime / Policing
                                                22%

                                                22%
            Improve services                                                                                                  Most common actions for
                                                21%
                                                                                                                             Very poor/Poor (13%, n=61)
                                                21%                                                •    Fix roads and streets, including back lanes (17%)
      Active living / Transit
                                            11%                                                    •    Address homelessness (17%)
                                                                                                   •    Lower taxes / rates (17%)
                                           8%
                       Economy
                                            12%
                                                                           Very good/Good
                                                                           (87%, n=400)
                                           7%
                 City Planning                                             Very Poor/Poor
                                                25%                        (13%, n=61)

Q13 -- What actions do you think the City of Winnipeg could take to improve the quality of life in the City? (accept up to 3 answers) (Base: All respondents (excluding Don’t
know/Refused). 2021 n=461)

                                                                                                                                       2021 Citizen Survey | City of Winnipeg   17
Actions to Improve Quality of Life [3/3]

                                     Selected verbatims for                                                                   Selected verbatims for
                                     Good/Very good (87%)                                                                      Very poor/Poor (13%)
             • “Better 311 service.”                                                                       •     “Better road conditions.”
             • “Better transit, more frequent service.                                                     •     “Enforcing mask wearing.”
               Addressing the needs of homeless people.”                                                   •     “Fix the roads. Synchronize traffic lights.
             • “Improve maintenance of park public spaces.”                                                      Make downtown livable by getting people
             • “Increase efficiency and productivity to reduce                                                   out of the bus shacks.”
               tax burden while being able to make                                                         •     “Focusing on homeless population. Better
               improvements to infrastructure, transit and                                                       residential roads. Better use of funding.”
               underpasses. Look for new models and ways of                                                •     “More support for low income families and
               doing things more economically.”                                                                  the homeless.”
             • “Invest more in infrastructure. Cleaning up our                                             •     “Things are dangerous. Hire more social
               streets, trees, and sidewalks to make the city                                                    workers, and have more resources for mental
               look positive and pretty. Culture events for                                                      health. Mental health is suffering the most.”
               minority groups – make them more involved as                                                •     “With crime, they have to address the root
               part of our city.”                                                                                causes which are poverty and social issues.”
             • “More housing for homeless population.”
             • “The potholes are always an issue.”

Q13 -- What actions do you think the City of Winnipeg could take to improve the quality of life in the City? (accept up to 3 answers) (Base: All respondents (excluding Don’t
know/Refused). 2021 n=461)

                                                                                                                                       2021 Citizen Survey | City of Winnipeg   18
VALUE FOR TAX DOLLARS

        Contact Person Name – Click to Edit
        Phone Number – Click to Edit
        Email Address – Click to Edit
        Website Address – Click to Edit

                          2021 Citizen Survey | City of Winnipeg   19
Value for Tax Dollars
        About two-thirds of Winnipeggers feel that they receive good or very good value for their
        property tax dollars.

                                                     Perceived value from property tax dollars
                   NET
        Very good/Good                      70%                      71%                      68%                      78%                         64%
                 value:
                                            6%                        5%                       5%                        8%                        7%                   Very good
                                                                                                                                                                        value

                                                                                                                                                                        Good
                                           64%                       66%                      63%                                                 58%                   value
                                                                                                                        70%
                                                                                                                                                                        Poor value

                                           25%                                                28%                                                 28%
                                                                     23%                                                                                                Very poor
                                                                                                                       19%
                                                                                                                                                   8%                   value
                                            6%                        6%                       4%                       3%
                                          2017                      2018                      2019                     2020                      2021

                                                   There are no demographic subgroups more likely to rate value for
                                                   tax dollars as very good or good.

Q14 -- Considering the services provided by the City for your property tax dollars, do you feel you receive… (Base: All respondents (excluding Don’t know/Refused). 2021 n=532)

                                                                                                                                   2021 Citizen Survey | City of Winnipeg            20
Reasons for Value Received for Tax Dollars [1/2]

                 Reasons by perceived value                                                                         Most common reasons for
                                                                                                                Very good/good value (64%, n=343)
                                                                                                   •    General satisfaction (35%)
                                                                 49%                               •    Satisfaction with road upkeep (10%)
                       City
          Planning/Spending
                                                                                                   •    Good schools (10%)
                                                          37%
                                                                                                   •    Low/reasonable taxes (8%)
                                                                                                   •    Satisfaction with services:
                                                                48%                                     • Snow clearing (16%)
                       Services                                                                         • Garbage/recycling (15%)
                                                            41%
                                                                                                        • Street cleaning (10%)
                                                                                                        • Community services (9%)
                                              14%
       Roads/Infrastructure
                                                             42%                                                      Most common reasons for
                                                                                                                  Very poor/poor value (36%, n=189)
                                         6%                                                         • Dissatisfaction with roads (40%)
              Safety/Policing                                     Very good/good value              • Dissatisfaction with services (18%)
                                       4%                         (64%, n=343)                      • Dissatisfaction with taxes (17%)
                                                                                                    • Dissatisfaction with city administration and
                                              14%                                                     planning (13%)
                          Other                                   Very poor/poor value
                                                 21%              (36%, n=189)                      • Dissatisfaction with city spending (9%)
                                                                                                    • Issues with snow removal (9%)
Q14B -- Why do you feel you receive  from your property tax dollars? Multiple response allowed. (Base: Gave an option about value for taxes (excluding Don’t
know/Refused). 2021 n=408)

                                                                                                                                  2021 Citizen Survey | City of Winnipeg   21
Reasons for Value Received for Tax Dollars [2/2]

                                Selected verbatims for                                                                Selected verbatims for
                              Very good/good value (64%)                                                            Very poor/poor value (36%)
           •    “Access to community recreation, libraries, garbage                                   •    “Condition of residential streets.”
                and recycling, and some amenities are good value                                      •    “During the summer, I bike. I find the majority of
                for the property tax dollars.”                                                             taxes support car infrastructure. I have as many
           •    “Because there has been improvement in                                                     rights as car users.”
                infrastructure.”                                                                      •    “I don’t actually see them doing anything.”
           •    “Because we have decent street and sidewalk                                           •    “I find they are cutting transit services. Some
                cleaning in our neighbourhood.”                                                            people don’t have a vehicle and use transit all
           •    “Don’t see a lot of negative.”                                                             the time, so please provide better transit
           •    “Garbage pickup and recycling is good.”                                                    services.”
           •    “I have lived in big cities like Toronto and Vancouver                                •    “I live in a condo. We pay the same rate as
                and I don't have any real issues with how Winnipeg                                         standalone homes but we do not get the same
                uses tax dollars.”                                                                         service.”
           •    “Our taxes are not that high and we try to take                                       •    “It feels as though citizens are not being heard
                advantage of libraries and pools and services the                                          by the City.”
                City provides.”                                                                       •    “Most of money spent listening to upper-middle
           •    “Services provided in fairly timely and efficient                                          class, ignoring transportation, and maintenance
                manner.”                                                                                   and upkeep of roads.”
           •    “They collect garbage, clean streets, and have good                                   •    “Taxes are too high.”
                police services.”                                                                     •    “We only get our garbage collected. We need
           •    “Very good job. Doing the best they can with                                               more services for the money we pay for our
                infrastructure.”                                                                           property taxes.”
Q14B -- Why do you feel you receive  from your property tax dollars? Multiple response allowed. (Base: Gave an option about value for taxes (excluding Don’t
know/Refused). 2021 n=408)

                                                                                                                                  2021 Citizen Survey | City of Winnipeg   22
CUSTOMER SERVICE

      Contact Person Name – Click to Edit
      Phone Number – Click to Edit
      Email Address – Click to Edit
      Website Address – Click to Edit

                        2021 Citizen Survey | City of Winnipeg   23
Contact with the City
        Phone is the most common method used to contact the City followed by email. Just over half of
        Winnipeggers contacted the city in the past year, with those under the age of 35 being less likely to do so.

          Contacted City in the                                                                                  How did you contact the City?
               last year                                                                                                              (base: contacted the City)

                                                                                                                                                                                    85%
                                                                                                                                                                                     87%
   2021                                  55%                   41%: 18 to 34                           Phone                    by telephone
                                                                                                                                                                                      89%
                                                                                                                                                                                        92%
                                                                                                                                                                                       90%
                                                                                                                                                          17%
                                                                                                                                                         14%
   2020                                     63%
                                                                                                         Email                                             18%
                                                                                                                          by email or internet

                                                                                                                                                         14%
                                                                                                                                                             21%
                                                                                                                                                       7%
                                                                                            Completing a                                                9%
                                                                                                                                                         12%
   2019                                      67%
                                                                                                                     completing a form online

                                                                                             form online                                               7%
                                                                                                                                                 NOT ASKED
                                                                                                                                                     4%
                                                                                                                                                    3%
                                                                                            Social media                 through social media
                                                                                                                                                   2%
   2018                                        70%                                                                                                 2%
                                                                                                                                                 NOT ASKED
                                                                                                                                                   2%                                       2021
                                                                                                                                                   2%
                                                                                                  In person                         in person
                                                                                                                                                      6%                                    2020
                                                                                                                                                     5%
   2017                                         73%                                                                                               1%
                                                                                                                                                    3%                                      2019
                                                                                                                                                  1%                                        2018
                                                                                                           Mail                       by mail
                                                                                                                                                   2%
                                                                                                                                                  2%                                        2017
                                                                                                                                                   2%

Q65 -- Have you contacted 311 or another staff member from the City of Winnipeg in the last year? (Base: All respondents (excluding Don’t know/Refused). 2021 n=597)
Q66 -- How did you contact the City of Winnipeg? Multiple responses allowed (Base: Contacted the city (excluding Don’t know/Refused). 2021 n=326)

                                                                                                                                                   2021 Citizen Survey | City of Winnipeg      24
Satisfaction with Customer Service
        Satisfaction with customer service remains high at 78%. Satisfaction levels are similar
        across each method of contact.

                                     Satisfaction with Customer Service
           NET
Very/somewhat                83%               79%                81%                 82%                 78%
       satisfied
                                                                                                                  Very
                                                                                                                                                       %
                                                                                                                  satisfied                         Very/
                                               36%                 40%
                            50%                                                       46%                44%                     Method of        Somewhat
                                                                                                                                  contact          satisfied
                                                                                                                  Somewhat
                                                                                                                  satisfied

                                               43%                                                                                Phone               84%
                                                                   42%                                   34%      Somewhat
                            33%                                                       37%                         dissatisfied
                                                                                                                                  Online              83%
                                               10%                 11%                                   13%
                            10%                                                       10%                         Very
                                               11%                                                                                 Email              80%
                            7%                                      7%                 7%                 9%      dissatisfied

                            2017               2018               2019               2020               2021

                    There are no demographic subgroups more likely to be satisfied
                    with the customer service experience.
Q67 -- How would you rate the experience? (Base: Contacted the city (excluding Don’t know/Refused). 2021 n=324)

                                                                                                                   2021 Citizen Survey | City of Winnipeg   25
Customer Service Details
                                                                                                   Agreement with Statements
                                                                                                      (Strongly/Somewhat Agree)

                                                                                                                                                                     92%
      City staff are courteous,                                                                                                                                        94%
                    helpful and    City staff are courteous, helpful and knowledgeable
                                                                                                                                                                   91%
                knowledgeable                                                                                                                                      91%
                                                                                                                                                                   91%

                                                                                                                                                  76%
           The quality of service                                                                                                                     78%
                from the City isThe quality of service from the City is consistently high
                                                                                                                                                73%

               consistently high                                                                                                                      77%
                                                                                                                                                       79%

                                                                                                                                          67%
             The City responds                                                                                                          65%
        quickly to requests and    The City responds quickly to requests and concerns
                                                                                                                                  59%
                      concerns                                                                                                          64%
                                                                                                                                          67%
                                                                                                                                        There are no
                                                                                                                                        demographic
                                                                                                                               61%
            City staff are easy to                                                                            Contact Person 59%
                                                                                                                             Name – Click      to Edit
                                                                                                                                        subgroups   more likely
                                                                                                                                        strongly or somewhat
             get a hold of when I City staff are easy to get a hold of when I need them
                                                                                                                                62%
                                                                                                              Phone Number – Click   to Edit
                                                                                                                                        agree with these
                       need them                                                                                              60%       customer service
                                                                                                              Email Address – Click
                                                                                                                                62% to Edit
                                                                                                                                        details.
                                                                                            2021       2020      2019
                                                                                                              Website   2018
                                                                                                                      Address – 2017
                                                                                                                                 Click to Edit
Q68 to Q71 -- I am going to read you a number of statements about the City. Thinking about your personal dealings with the City of Winnipeg and your general impressions, please tell
me whether you strongly agree, somewhat agree, somewhat disagree, or strongly disagree. (Base: Contacted the city (excluding Don’t know/Refused). 2021 n=313-317)

                                                                                                                                        2021 Citizen Survey | City of Winnipeg          26
Improvement to Customer Service [1/2]
          Customers service improvements by                                                                    Most common improvements for
                  satisfaction level                                                                         Very/Somewhat satisfied (78%, n=236)
                                        32%                                                     • No suggestions/satisfied (42%)
           Staffing
 Levels/Availability
                                                                                                • Answer phone more quickly/less time on hold (19%)
                                          39%                                                   • More people on staff (18%)

                                    22%
       Staff contact
                                                55%

                                 11%
              Systems                                                                                           Most common improvements for
                                10%
                                                                                                             Very/Somewhat dissatisfied (22%, n=66)
                                                                                                  •    More people on staff/phones (22%)
                              3%
                 Other
                                                                                                  •    Staff should respond more quickly (18%)
                                                                Very/Somewhat
                               5%                               satisfied (78%,
                                                                                                  •    More knowledgeable staff (18%)
                                                                n=236)                            •    Follow up on reported issues (17%)
                                                                                                  •    Answer phone more quickly/less time on hold (17%)
                                           42%                  Very/Somewhat
   No suggestions/
          satisfied                                             dissatisfied (22%,
                                10%
                                                                n=66)

Q72 -- How could the City's customer service be improved? Multiple responses allowed (Base: Contacted customer service (excluding Don’t know/Refused). 2021 n=305)

                                                                                                                               2021 Citizen Survey | City of Winnipeg   27
Improvement to Customer Service [2/2]

                                Selected verbatims for                                                             Selected verbatims for
                            Very/Somewhat satisfied (78%)                                                     Very/Somewhat dissatisfied (22%)
            •    “A little more access to real people instead of all the                             •    “311 takes far too long to respond and often the
                 automated phone systems.”                                                                person doesn’t give advice than can fix the
            •    “A live chat rather than waiting for the phone.”                                         problem. They refer you to someone else.”
            •    “During times when they are expecting high                                          •    “Hire more staff.”
                 volumes of calls, they should have more staff                                       •    “I don't think it would be fair for me to say how
                 available to respond.”                                                                   they could be improved because it is more of a
            •    “Keeping the public updated on their questions.”                                         departmental issue. But many people wait for
            •    “Maybe ensure the staff are up to date with their                                        the City's response and they should give a
                 knowledge and information.”                                                              timeline for when to expect responses.”
            •    “More staff to answer phones.”                                                      •    “Just be more accessible. I don’t like navigating
            •    “Not easy getting a hold of someone via 311. Passed                                      the tele-prompt phone menu.”
                 around to different employees.”                                                     •    “More knowledgeable staff. Too many uncertain
            •    “Quicker response to email contact. It was almost                                        answers to questions.”
                 three weeks before I heard back. I felt that was a                                  •    “More resources or make it easier to look up on
                 while.”                                                                                  the website.”
            •    “They need to keep reaching out to people with a                                    •    “Stop putting everybody on hold.”
                 prompt reply.”                                                                      •    “Speed up the 311 telephone wait time.”
            •    “When you do phone it can hard to get a hold of                                     •    “To actually come out and fix things when they
                 people, but the online is good.”                                                         say they are going to.”

Q72 -- How could the City's customer service be improved? Multiple responses allowed (Base: Contacted customer service (excluding Don’t know/Refused). 2021 n=305)

                                                                                                                               2021 Citizen Survey | City of Winnipeg   28
CITY SERVICES

    Contact Person Name – Click to Edit
    Phone Number – Click to Edit
    Email Address – Click to Edit
    Website Address – Click to Edit

                      2021 Citizen Survey | City of Winnipeg   29
Overall Satisfaction with City Services
        The majority (87%) of Winnipeggers are at least somewhat satisfied with city services.

                                                         Overall Satisfaction with City Services
                 NET
      Very/somewhat                       88%                       87%                      88%                        90%                      87%
             satisfied

                                           23%                       20%                      17%                       27%                       23%                     Very
                                                                                                                                                                          satisfied
                                                                                                                                                                          Somewhat
                                                                                                                                                                          satisfied
                                           65%                       67%                      71%                                                 64%
                                                                                                                        62%                                               Somewhat
                                                                                                                                                                          dissatisfied
                                                                                                                                                                          Very
                                           10%                       11%                      10%                        9%                       10%                     dissatisfied

                                          2017                      2018                      2019                     2020                      2021

                                                 There are no demographic subgroups more likely to be satisfied
                                                 with the overall satisfaction with city services.

Q52 -- In general, how satisfied are you overall with the services provided by the City of Winnipeg? (Base: All respondents (excluding Don’t know/Refused). 2021 n=594)

                                                                                                                                   2021 Citizen Survey | City of Winnipeg                30
Importance of Service Areas [1/2]
        Public safety is rated as the most important service area followed by
        infrastructure.

                            Service Area                                    Importance                              % Ranked
                                                                                                                                                               2020
                                                                             (weighted)                              1 and 2
                                        Public Safety                                1.7                                 83%
                             (Fire Paramedic, Police)
                                      Infrastructure                                 2.4                                 55%
                                           (Roads, Water)
                        Community Services                                           2.5                                 47%
                               (Libraries, Recreation)
                                        Property &
                                      Development                                    3.3                                 19%
                                   (Land use planning)
               1= most important                                                                                                                    4= least important

Q53 -- Rank the following group of services in order of importance where 1 is the most important to you and 4 is the least important to you. (Base: All respondents (excluding Don’t
know/Refused). 2021 n=536-582)

                                                                                                                                      2021 Citizen Survey | City of Winnipeg           31
Importance of Service Areas [2/2]
        Infrastructure continues to decrease in importance.

                                                          Ranked 1 or 2
                                                                                           86%
                         82%                   80%                   81%                                         83%

                         68%
                                               62%
                                                                     58%                   58%
                                                                                                                 55%                      Public Safety
                                               43%                                         45%                  47%                       Infrastructure
                                                                     41%
                         35%                                                                                                              Community Services
                                                                     21%                                                                  Property & Development
                         17%                   16%                                                               19%
                                                                                           13%

                       2017                  2018                   2019                  2020                  2021

Q53 -- Rank the following group of services in order of importance where 1 is the most important to you and 4 is the least important to you. (Base: All respondents (excluding Don’t
know/Refused). 2021 n=569-589)

                                                                                                                                      2021 Citizen Survey | City of Winnipeg           32
Satisfaction with Public Works
                                                                                 Satisfaction with Individual Services
                                                                                                    (Very Satisfied/Somewhat Satisfied)
                                                                                                                                                                                             90%
      Condition of major parks                                                                                                                                                                          97%
          (among those who used it)
                                                                      Condition of major parks
                                                                                                                                                                                                        97%
                                                                                                                                                                                                         98%
                                                                                                                                                                                                        97%
                                                                                                                                                                                          86%
                                                                                                                                                                                           87%
                                                                                  Insect control
                                                                                                                                                                                            88%
                    Insect control                                                                                                                                                        86%
                                                                                                                                                                                   80%
                                                                                                                                                                                    82%
  Condition of the local park in                                                                                                                                                                  92%
                                             Condition of the local park in your neighbourhood
                                                                                                                                                                                            88%
          your neighbourhood                                                                                                                                                              86%
          (among those who used it)                                                                                                                                                       86%
                                                                                                                                                                           75%                     52%: 55+
                                                                                                                                                                             77%                   (very satisfied)
                                                                                 Snow removal
                                                                                                                                                                            76%
                   Snow removal                                                                                                                                       70%
                                                                                                                                                                         73%
                                                                                                                                                                65%
                                                                                                                                                                          73%
      City’s efforts to keep city                 City’s efforts to keep city clean and beautiful
                                                                                                                                                                             76%
                                                                                                                                                                        71%
            clean and beautiful                                                                                                                                       69%
                                                                                                                                                          62%
                                                                                                                                                        60%
     Management of rush hour                             Management of rush hour traffic flow
                                                                                                                                                 56%
                                                                                                                                               54%
                  traffic flow                                                                                                              51%
                                                                                                                                                          61%
                                                                                                                                                       58%
                                                                     Condition of major streets
                                                                                                                                                        59%
     Condition of major streets                                                                                                        45%
                                                                                                                                          48%
                                                                                                                                            51%
                                                                                                                                               54%
       Condition of residential          Condition of residential streets in your neighbourhood
                                                                                                                                                55%
streets in your neighbourhood                                                                                                                52%
                                                                                                                                          49%

                                                                                                    2021     2020      2019     2018            2017
Q15/Q21/Q22/Q23/Q27/Q36/Q41/Q42 -- Now, I'm going to read you a list of services that are provided by the City of Winnipeg. Please tell me whether you are very dissatisfied,
somewhat dissatisfied, somewhat satisfied or very satisfied with each of the following services. Some of these services have been closed or suspended by the City due to the
coronavirus, and we would like you to think about these services while they were operating. ((excluding Don’t know/Refused). 2021 n=421-597)

                                                                                                                                                   2021 Citizen Survey | City of Winnipeg                        33
Satisfaction with Community Services
                                                                                     Satisfaction with Individual Services
                                                                                                       (Very Satisfied/Somewhat Satisfied)
                                                                                                                                                                        93%
          Public Library Services                                                                                                                                     91%
            (among those who used it)                              (35) Public Library Service
                                                                                                                                                                         94%
                                                                                                                                                                         94%
                                                                                                                                                                          95%

    Community Centre operated                                                                                                                                      89%
                                                                                                                                                                         94%
                    programs                 (26) Community Centre operated programs like
                                                          soccer or hockey                                                                                         90%
            (among those who used it)                                                             NOT ASKED
                                                                                                  NOT ASKED

         City-operated recreation                                                                                                                         83%
                                                                                                                                                                87%
                        programs             (25) City-operated recreation programs like
                                          swimming lessons, Learn to Skate or other Leisure
                                                           Guide Programs
                                                                                                                                                                    91%
            (among those who used it)                                                                                                                              90%
                                                                                                                                                                   90%

 Support for arts, entertainment                                                                                                                          82%
                                                                                                                                                             85%
                        & culture           (21) The City's support for arts, entertainment &
                                                                 culture                                                                                                 94%
                                                                                                                                                                   89%
                                                                                                                                                                   89%
      Condition of City-operated                                                                                                                    75%
             recreation facilities                                                                                                                          85%
            (among those who used it)
                                         (23) Condition of City-operated recreation facilities
                                                                                                                                                                 90%
                                                                                                                                                              87%
                                                                                                                                                             86%
                                                                                                                                                    75%
   Condition of City of Winnipeg                                                                                                                            85%
            Community Centres                 (24) Condition of City of Winnipeg Community
                                                                  Centres                                                                                             92%
            (among those who used it)                                                             NOT ASKED
                                                                                                  NOT ASKED
                                                                                                                                                                      There are no
                                                                                                                                                  72%
           Efforts to ensure that                                                                                                               70%
                                                                                                                                                                      demographic
  residential property standards        (37) City's efforts to ensure that residential property
                                               standards are met through inspections                                                          68%                     subgroups more likely
    are met through inspections                                                                                                                69%
                                                                                                                                                  72%                 to be satisfied with
                                                                                                                                                                      community services.
                                                                                                      2021    2020    2019    2018     2017
Q35/Q37/Q38/Q39/Q40/Q49/Q51 -- Now, I'm going to read you a list of services that are provided by the City of Winnipeg. Please tell me whether you are very dissatisfied, somewhat
dissatisfied, somewhat satisfied or very satisfied with each of the following services. Some of these services have been closed or suspended by the City due to the coronavirus, and
we would like you to think about these services while they were operating. ((excluding Don’t know/Refused). 2021 n=122-541)

                                                                                                                                              2021 Citizen Survey | City of Winnipeg          34
Satisfaction with Police Service
                                                                                       Satisfaction with Individual Services
                                                                                           (Very Satisfied/Somewhat Satisfied)

                                                                                                                                           71%
                                                                                                                                            72%
      Enforcement of                              (10) Enforcement of traffic laws
                                                                                                                                                74%
          traffic laws                                                                                                                    70%
                                                                                                                                    64%

                                                                                                                                          70%

        Police service                                                                                                                          74%

       efforts in crime                 (11) Police service efforts in crime control
                                                                                                                                                75%
            prevention                                                                                                                                  84%
                                                                                                                                                      80%     There are no
                                                                                                                                                              demographic
                                                                                                                                          69%                 subgroups more likely
      Police Service                                                                                                                              78%         to be satisfied with
    response to 911                    911(32) Police Service response to 911 calls
                                                                                                                                                  77%
                                                                                                                                                              police service.
               calls                                                                                                                                        88%
  (among those who used it)
                                                                                                                                                74%

                                                                                             2021   2020     2019    2018    2017
Q24/Q25/Q46 -- Now, I'm going to read you a list of services that are provided by the City of Winnipeg. Please tell me whether you are very dissatisfied, somewhat dissatisfied,
somewhat satisfied or very satisfied with each of the following services. Some of these services have been closed or suspended by the City due to the coronavirus, and we would like
you to think about these services while they were operating. ((excluding Don’t know/Refused). 2021 n=104-565)

                                                                                                                                      2021 Citizen Survey | City of Winnipeg           35
Satisfaction with Fire Paramedic Services
                                                                                         Satisfaction with Individual Services
                                                                                               (Very Satisfied/Somewhat Satisfied)

                                                                                                                                                    93%
Fire and rescue service response                                                                                                                       97%
              to fire emergencies              (3) Fire and rescue service response to fire
                                                               emergencies                                                                              98%
                                                                                                                                                         99%
                                                                                                                                                         99%

                                                                                                                                            85%
        Safety of existing buildings                                                                                                           89%
       through fire inspections and          (33) Safety of existing buildings through fire
                                                    inspections and enforcement                                                                 91%
                       enforcement                                                                                                          85%
                                                                                                                                               89%

                                                                                                                                            85%
                                                                                                                                                89%
          Fire and injury prevention   (34) Fire and injury prevention education provided
                                             through public events and public service
                                                                                                                                               88%
                                                         announcements
                           education                                                                                                          88%
                                                                                                                                              88%

                                                                                                                                           84%
                                                                                                                                             87%
   Emergency response capability          (30) Emergency response capability for medical
                                                          emergencies                                                                         88%
        for medical emergencies
                                                                                                                                              88%
               (among those who used it)
                                                                                                                                             87%

                                                                                                                                         81%
                                                                                                                                                            There are no
Level of city preparedness, ability                                                                                                              90%        demographic
    to respond, and assist during      (14) Level of city preparedness, ability to respond,
                                         and assist residents during natural and human
                                                                                                                                                89%         subgroups more likely
                                                          caused disasters

       natural and human caused                                                                                                                    92%      to be satisfied with fire
                        disasters                                                                                                              88%
                                                                                                                                                            paramedic services.
                                                                                              2021    2020     2019     2018    2017
Q17/Q28/Q44/Q47/Q48 -- Now, I'm going to read you a list of services that are provided by the City of Winnipeg. Please tell me whether you are very dissatisfied, somewhat
dissatisfied, somewhat satisfied or very satisfied with each of the following services. Some of these services have been closed or suspended by the City due to the coronavirus, and
we would like you to think about these services while they were operating. ((excluding Don’t know/Refused). 2021 n=135-530)

                                                                                                                                       2021 Citizen Survey | City of Winnipeg           36
Satisfaction with Planning, Property & Development
                                                                                 Satisfaction with Individual Services
                                                                                                         (Very Satisfied/Somewhat Satisfied)

                                                                                                                                                                                   81%
  Efforts in preserving heritage                                                                                                                                                      84%
                                             (15) The City's efforts in preserving heritage buildings.
                                                                                                                                                                                            91%
                       buildings                                                                                                                                                     84%
                                                                                                                                                                                      85%

                                                                                                                                                                       72%
                                                                                                                                                                             77%
 Efforts in promoting economic             (6) The City's effort in promoting economic development
                                                                                                                                                                                80%
                   development                                                                                                                                                    82%
                                                                                                                                                                                80%

                                                                                                                                                              66%
                                                                                                                                                              66%
  Community planning to guide                  (5) Community planning to guide growth and change
                                                                                                                                                                             77%
          growth and change                                                                                                                                      69%
                                                                                                                                                           64%

                                                                                                                                                        62%
                                                                                                                                                              66%
         Zoning regulations and             (31) Zoning regulations and building permits to regulate
                                                       building & property development                                                                                  74%
               building permits                                                                                                                               66%
                                                                                                                                                                68%

                                                                                                                                                     59%
                                                                                                                                                                 68%
                                                                             (4) Downtown renewal
                                                                                                                                                                        74%
              Downtown renewal                                                                                                                                             77%
                                                                                                                                                                                      There are no
                                                                                                                                                                           77%        demographic
                                                                                                                                               53%                                    subgroups more likely
                                                                                                                                                       60%                            to be satisfied with
    Funding for improving inner                     (2) City funding for improving inner city housing
                                                                                                                                                        61%
                                                                                                                                                 56%
                                                                                                                                                                                      planning, property &
                   city housing                                                                                                                                                       development.
                                                                                                                                               54%

                                                                                                          2021     2020     2019    2018        2017
Q16/Q18/Q19/Q20/Q29/Q45 -- Now, I'm going to read you a list of services that are provided by the City of Winnipeg. Please tell me whether you are very dissatisfied, somewhat
dissatisfied, somewhat satisfied or very satisfied with each of the following services. Some of these services have been closed or suspended by the City due to the coronavirus, and
we would like you to think about these services while they were operating. ((excluding Don’t know/Refused). 2021 n=404-519)

                                                                                                                                                        2021 Citizen Survey | City of Winnipeg            37
Satisfaction with Water and Waste
                                                                       Satisfaction with Individual Services
                                                                                     (Very Satisfied/Somewhat Satisfied)

                                                                                                                                                        90%
                                                                                                                                                             94%
              Garbage collection                          (16) Garbage collection
                                                                                                                                                            94%
                                                                                                                                                           92%
                                                                                                                                                   87%

                                                                                                                                                        90%
                                                                                                                                                          93%
                                               (20) Protection from river flooding
                                                                                                                                                             96%
  Protection from river flooding
                                                                                                                                                            95%
                                                                                                                                                          93%

                                                                                                                                                  86%
                                                                                                                                                    88%
                                              (19) Protection from sewer back-up
                                                                                                                                                 85%
Protection from sewer back-up
                                                                                                                                                    88%
                                                                                                                                                 85%

                                                                                                                                                84%
                                                                                                                                                     88%
                                                      (17) The Recycling program
                                                                                                                                                83%
        The Recycling Program                                                                                                                     85%
                                                                                                                                                   86%
                                                                                                                                                              There are no
                                                                                                                                                84%
                                                                                                                                                              demographic
                                                                                                                                                  86%
                                                (18) Quality of the drinking water
                                                                                                                                                 85%          subgroups more likely
   Quality of the drinking water                                                                                                                84%           to be satisfied with
                                                                                                                                                 85%          water and waste.
                                                                                     2021    2020    2019     2018      2017
Q30 to Q34 -- Now, I'm going to read you a list of services that are provided by the City of Winnipeg. Please tell me whether you are very dissatisfied, somewhat dissatisfied,
somewhat satisfied or very satisfied with each of the following services. Some of these services have been closed or suspended by the City due to the coronavirus, and we would like
you to think about these services while they were operating. ((excluding Don’t know/Refused). 2021 n=479-591)

                                                                                                                                   2021 Citizen Survey | City of Winnipeg              38
Satisfaction with Transit / SOAs
                                                       Satisfaction with Individual Services
                                                                           (Very Satisfied/Somewhat Satisfied)

                                                                                                                                                              85%
                                                                                                                                                                     91%
       Animal services
                                                        Animal Services
                                                                                                                                                                       93%
                                                                                                                                                                     91%
                                                                                                                                                                87%

                                                                                                                                             69%
                                                                                                                                 59%
            Public transit
    (among those who used it)                             Public Transit
                                                                                                                                             69%
                                                                                                                                           66%
                                                                                                                                                   75%

                                                                                                                                           66%
                                                                                                                                                         There are no
      Availability and                                                                                                          58%                      demographic
      convenience of                                            Parking
                                                                                                                                     62%                 subgroups more likely
     on-street parking                                                                                                                                   to be satisfied with
                                                                                                                                     61%
                                                                                                                                                         transit / SOAs.
                                                                                                                               57%

                                                                             2021      2020           2019            2018             2017
Q26/Q43/Q50 -- Now, I'm going to read you a list of services that are provided by the City of Winnipeg. Please tell me whether you are very dissatisfied, somewhat dissatisfied,
somewhat satisfied or very satisfied with each of the following services. Some of these services have been closed or suspended by the City due to the coronavirus, and we would like
you to think about these services while they were operating. ((excluding Don’t know/Refused). 2021 n=121-569)

                                                                                                                                   2021 Citizen Survey | City of Winnipeg              39
USE OF CITY SERVICES

        Contact Person Name – Click to Edit
        Phone Number – Click to Edit
        Email Address – Click to Edit
        Website Address – Click to Edit

                          2021 Citizen Survey | City of Winnipeg   40
Usage of City Services
                                                                                                 Used in the past year
                                                                                                                                                               83%              69%:
Usage of City Services
                                                                                                           Used in the past year

                                                                                                                          24%
  Been involved in a emergency                                                                                               27%
                                                 In the past year, have you or a family member been
                                                  involved in an emergency medical incident where
                                                                                                                        22%
               medical incident                              paramedics were requested?

                                                                                                                          24%
                                                                                                                         23%

                                                                                                                         23%
       Participated in a Community                                                                                              29%
                                                Have you or your family participated in a Community
                                               Centre Program like hockey or soccer in the past year?                           29%
                   Centre Program                                                                                                30%
                                                                                                                                  31%
                                                                                                                                                                         34%: 18 to 34
                                                                                                                        21%                                              31%: Rent home
                                                                                                                                29%
                                                                                                                                                                         14%: White/Caucasian
          Regularly use City Transit               Do you regularly use the City Transit (for example,
                                                         seasonally or at least once a week)?                                  28%
                                                                                                                                     34%
                                                                                                                                   32%

                                                                                                                  18%                                                    38%: Indigenous
       Been involved in an incident                                                                                  21%
                                                                 911
                                                  In the past year, have you personally used, or been

         where a 911 call of police                involved in an incident where a 911 call for police
                                                                 response was needed?
                                                                                                                  18%
                                                                                                                     21%
            response was needed                                                                                    19%

                                                                                                           6%                                                            1%:
Key Findings
QUALITY OF LIFE
•   The majority of Winnipeggers (89%, lower than 97% in 2020) rate the overall quality of
    life in the City as very good or good, while 11% rate it as poor or very poor.
           • Winnipeggers find it easy to get around by car (91%) and to a lesser extent by
              walking (77%). Fewer find it easy to get around by bicycle (66%) or by transit
              (62%).
           • Although two-thirds of citizens feel safe walking alone at night in their
              neighbourhood (66%), few feel safe walking alone at night downtown (14%).
           • Many Winnipeggers are able to find information from the website (85%), and
              most find the City of Winnipeg to be a trustworthy source of information
              (87%).
           • While many believe the City acts in the best interest of citizens (71%), fewer
              Winnipeggers believe that they can influence the decisions or direction of the
              City (43%). Additionally, over two-thirds believe that the City of Winnipeg is
              making a positive impact through their actions towards reconciliation with
              Indigenous peoples (70%).
•   The most common actions cited to improve the quality of life in Winnipeg are related
    to housing / social programs (24%), roads and infrastructure (23%), crime / policing
    (23%), improvement of services (22%), and active living / transit (20%). Compared to
    2020, housing / social programs has seen an increase from 15%, while other areas
    remain similar.
•   Just over one-quarter of citizens (27%) are promoters of the City of Winnipeg, but the
    overall 2021 Net Promoter Score sits at +1, which is down significantly from 2020
    (+17).

                                                                 2021 Citizen Survey | City of Winnipeg   43
Key Findings
VALUE FOR TAX DOLLARS
• About two-thirds (64%) of citizens feel that they receive good or very good value for their
  property tax dollars. This is down from 78% in 2020.
• The most common reasons for finding good value for property tax dollars are satisfaction
  with services (48%), having general satisfaction (35%), and satisfaction with roads (10%).
• The most common reasons finding poor value for property tax dollars are dissatisfaction
  with roads (40%), dissatisfaction with services (18%), and dissatisfaction with taxes (17%).

CUSTOMER SERVICE
• Just over half (55%) of Winnipeggers contacted the City in the past year and those
  who did so, most commonly used the phone (85%) and email (17%). Since 2017,
  there has been a consistent decline from 73% of Winnipeggers contacting the City.
• Satisfaction with customer service remains high at 78%.
• The majority of Winnipeggers (92%) agree that city staff are courteous, helpful, and
  knowledgeable while fewer (61%) agree that City staff are easy to get a hold of when
  they need them.
• The top suggestions to improve customer service include having more staff to answer
  phones (22%), responding more quickly (18%), and having more knowledgeable staff (18%).

                                                                   2021 Citizen Survey | City of Winnipeg   44
Key Findings
CITY SERVICES
• Overall satisfaction with city services remains high at 87%.
• Usage of city services varies by service, with the majority having visited a local (83%) or
   major park (71%), but only 21% regularly use City Transit and 18% were involved in an
   incident where 911 was called. Only 6% applied for a building permit.
• Public Safety remains the most important service area while Property and Development’s
   importance remains the lowest.
• Satisfaction with city services remains high for the majority of services.
• Individual city services that received over 90% satisfaction ratings:
             •       Fire and rescue service response to fire emergencies (93%)
             •       Public Library Services (93%)
• Individual city services that received under 60% satisfaction ratings:
             •       Downtown renewal (59%)
             •       Funding for improving inner city housing (53%)
             •       Condition of residential streets in your neighbourhood (51%)

                                                                   2021 Citizen Survey | City of Winnipeg   45
You can also read