Social Protection for Independent Workers in the Digital Age
←
→
Page content transcription
If your browser does not render page correctly, please read the page content below
Social Protection for Independent Workers
             in the Digital Age

                               Tito Boeri
       Bocconi University, INPS and London School of Economics

                         Giulia Giupponi
                    London School of Economics

                          Alan B. Krueger
                   Princeton University and NBER

                        Stephen J. Machin
                    London School of Economics

  XX European Conference of the Fondazione Rodolfo Debenedetti
                     Pavia May 26th, 2018

                                                                 1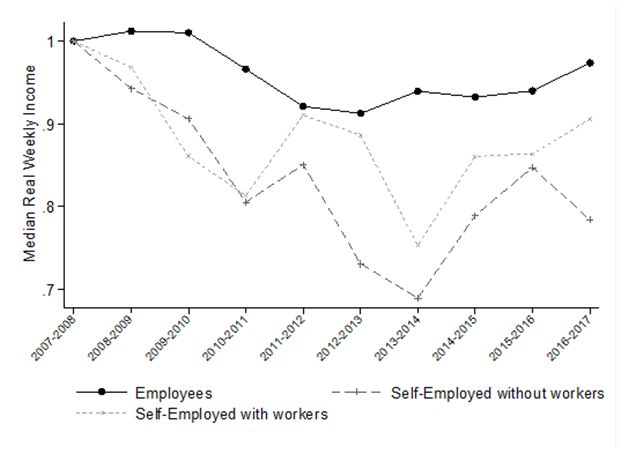
The rise of alternative work arrangements

• International labour markets recently characterised by rises in “atypical”
  work arrangements
    o Self-employment (freelance, contract workers, agency workers)
    o On-call jobs, zero hours contracts

• Drivers:
    o   Technological change (digitalisation)
    o   Fissuring of traditional workplace (Weil, 2014)
    o   Preferences for flexibility (Mas and Pallais, 2017)
    o   Weak labour markets (Katz and Krueger, 2017)
    o   Labour market policies (Datta, Giupponi and Machin, 2018)

                                                                           2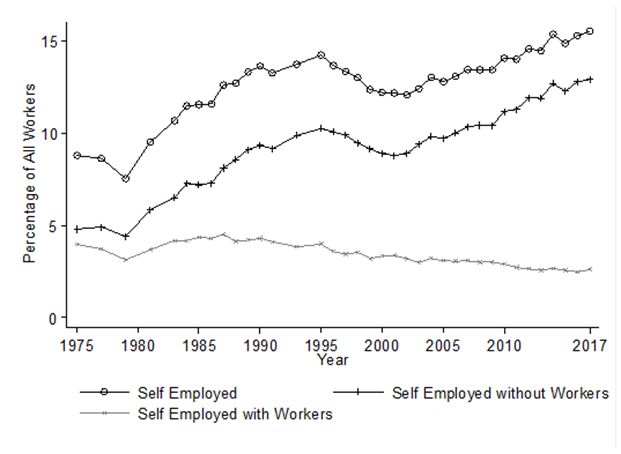
___________________________
Source: OECD and IFS          3
The rise of the «dependent-independent»
                  (Euro area)

          % of employment in working age (15-64)
20%
18%
16%
14%
12%
10%
8%
6%
4%
2%
0%
               2010                                     2015
          self employed   self employed with one contractor

                                                               4
Challenges for economists and policy makers
• Understand employment conditions of independent workers
o Need for flexibility vs. hour constraints
o Protection against labour market risk
o Degree of business risk taking
• Provision of social protection
o Reform of social security to increase coverage of social insurance and extend social
insurance benefits to independent workers
• Macroeconomic implications
o Labour market slack may no longer be captured by unemployment alone
o Larger “reserve army” of underemployed workers potentially undercutting wages
o Intensive margin of employment and degree of employment protection is becoming
increasingly important in European and US labour markets
o Minimum wages are no longer a wage floor
5Outline
1. Evidence from comparable surveys in three countries
o Italy
o UK
o US
2. Social protection for non-standard workers
3. Wage setting (macro implications)
6Three surveys of independent workers
• Comparable surveys of self-employment, alternative work arrangements
and the gig economy
o Italy
o UK
o US
• Collect novel data on:
o Demographics
o Job characteristics, contractual conditions
o Preferences for flexibility
o Need for social protection
7How many self-employed and gig-workers?
% of self-employed
Self-employed as % Gig-workers as % of
who are also gig-
of WAPOP WAPOP
workers
Italy 15 2.5 2.6
UK 12 8 3
US 12 14 -
___________________________
Source: The data on self-employed as % of WAPOP are from OECD for Italy and UK, and from IRS and OECD for US.
The data on gig-workers are from fRDB Survey (Italy), LSE-CEP survey (UK) and Princeton Self-employment
Survey (US). 8The Italian survey
• Demetra web panel. Representative of working age population
• On line survey with 15,000 respondents
• Carried out between May 8 and May 15 2018 (thanks to fRDB!)
• Focus on GIG workers (jobs organized via on line platforms)
• Elicited willingness to pay for social insurance
• Literacy about the social protection system
9Age distribution (self-employed) Age distribution (gig-economy)
15
20
15
10
Percent
Percent
10
5
5
0
0
20 25 30 35 40 45 50 55 60 65 20 25 30 35 40 45 50 55 60 65
Median=40 Median=37
___________________________
Source: fRDB Survey 10Education
Italy
30 20
Percent
10
0
Elementary Middle Professional High Bachelor Master Master PhD
school school degree (1 year)
Gig-economy Self-employed
___________________________
Source: fRDB Survey 11Type of Gig-economy worker
Italy
60
40
Percent
20
0
Gig as Gig as Gig worker
First Job Second Job but Unemployed
___________________________
Source: fRDB Survey 12Weekly hours for Self-employed Weekly hours for Gig-economy workers
Italy Italy
20
20
15
15
Percent
Percent
10
10
5
5
0
0
0 10 20 30 40 50 60 70 80 0 10 20 30 40 50 60 70 80
Weekly hours Weekly hours
___________________________
Source: fRDB Survey 13Weekly hours of work by type of Gig-economy worker
Italy
16
14 10 12
Weekly hours
6 8 4
2
0
Gig as Gig as Gig worker
First Job Second Job but Unemployed
___________________________
Source: fRDB Survey 14Desired hours of work for Self-employed Desired hours of work for Gig-economy Workers
Italy Italy
50
50
40
40
30
30
Percent
Percent
20
20
10
10
0
0
More hours Fewer hours Satisfied More hours Fewer hours Satisfied
___________________________
Source: fRDB Survey 15Reasons for working
Reasons for declared hours of work - Gig-economy workers
                                                        Italy
                    30
                    20
              Percent
                    10
                    0

                         Training No available Domestic Illness/   No need   Second   Other
                                     work commitments Disability              work

___________________________
Source: fRDB Survey                                                                           17
Job satisfaction - Self-employed Job satisfaction - Gig-economy workers
Italy Italy
40
40
30
30
Percent
Percent
20
20
10
10
0
0
Very Satisfied Neutral Dissatisfied Very Very Satisfied Neutral Dissatisfied Very
satisfied dissatisfied satisfied dissatisfied
___________________________
Source: fRDB Survey 18Main reason for working in the Gig economy
Italy
30
20
Percent
10
0
Incidental Complement Complement Only option Other
expenses income income
personal household
___________________________
Source: fRDB Survey 19Number of contractors/clients - Self-employed Share of revenues from main contractor - Self-employed
Italy Italy
50
25
40
20
30
15
Percent
Percent
20
10
10
5
0
0
1 2-5 6-15 16-50 > 50 < 25% 25%-50% >50%
___________________________
Source: fRDB Survey 20Income Insecurity
Self employed Gig-workers
Suppose you have an unexpected expense of 500 euros. Based on your current
economic situation, how would you cover it? % %
With the money currently i my checking/savings account or with cash 48.44 40.14
Pay it with my credit card 15.65 15.65
By starting a bank loan or a line of credit 2.6 4.42
By borrowing from a friend or a family member 15.45 19
By selling something 6.54 8.36
I wouldn't be able to pay for the expense right now 11.31 12.43
Total 100 100
___________________________
Source: fRDB Survey 21The UK survey
• Trends in self-employment with and without employees
• LSE-CEP Survey of Alternative work arrangements
o Online survey of 20,000 respondents
o Representative of the UK population 18-65
o Conducted between February 5 and March 2, 2018
• Focus on preferences for flexibility and social protection
o Self-employed and gig-economy workers
o Zero hours contracts (no minimum guaranteed hours)
22___________________________ Source: UK Quarterly LFS, ONS 23
___________________________
Source: Family Resources Survey (FRS)   24
Age distribution (self-employed)                             Age distribution (gig-economy)
      15

                                                                      25
                                                                      20
      10

                                                                         15
Percent

                                                                   Percent
                                                                      10
      5

                                                                      5
      0

                                                                      0
               20       30       40         50           60   70              20   30        40        50           60        70

                             Median=45                                                   Median=30

          ___________________________
          Source: LSE-CEP Survey                                                                                         25
Education
30
20
Percent
10
0
No Some GSCE 5+ GSCE Vocational A levels Bachelor Masters Doctorate
qualification O level O level training
Self-employed Gig-economy worker
___________________________
Source: LSE-CEP Survey 26Distribution of weekly hours for self-employed Distribution of weekly hours for gig-economy
15
15
10
10
Percent
Percent
5
5
0
0
0 20 40 60 80 0 10 20 30 40 50
Weekly hours Weekly hours
___________________________
Source: LSE-CEP Survey 27Desired hours of work for self-employed Desired hours of work for gig-economy workers
60
50
40
40
Percent
Percent
30
20
20
10
0
0
More hours Fewer hours Satisfied More hours Fewer hours Satisfied
___________________________
Source: LSE-CEP Survey 28Reason for not working more hours (self-employed)
60 40
Percent
20 0
d
k
y
ts
er
or
ilit
ifie
en
th
w
ab
O
al
itm
e
is
qu
bl
m
D
la
r
/
de
m
ss
ai
co
Un
ne
av
tic
Ill
o
N
es
m
Do
___________________________
Source: LSE-CEP Survey 29Reason for not working more hours (gig-economy)
60 40
Percent
20 0
d
k
y
ts
er
or
ilit
ifie
en
th
w
ab
O
al
itm
e
is
qu
bl
m
D
la
r
/
de
m
ss
ai
co
Un
ne
av
tic
Ill
o
N
es
m
Do
___________________________
Source: LSE-CEP Survey 30Reason for wanting fewer hours (self-employed)
50
40 30
Percent
20 10
0
e
y
t
ts
rk
er
en
ilit
ur
en
wo
th
ud
ab
is
O
itm
Le
of
St
is
m
D
es
s/
m
yp
es
co
t
Illn
er
tic
th
es
O
om
D
___________________________
Source: LSE-CEP Survey 31Reason for wanting fewer hours (gig-economy)
40
30
Percent
2010
0
e
y
t
ts
rk
er
en
ilit
ur
en
wo
th
ud
ab
is
O
itm
Le
of
St
is
m
D
es
s/
m
yp
es
co
t
Illn
er
tic
th
es
O
om
D
___________________________
Source: LSE-CEP Survey 32Percent
0 10 20 30 40
Ve
ry
sa
tis
fie
d
Sa
tis
fie
Source: LSE-CEP Survey
d
N
eu
___________________________
t ra
l
D
is
sa
tis
fie
d
Ve
ry
Job satisfaction of self-employed
di
ss
at
isf
ie
d
Percent
0 10 20 30 40
Ve
ry
sa
tis
fie
d
Sa
tis
fie
d
N
eu
t ra
l
D
is
sa
tis
fie
d
Ve
ry
di
ss
at
Job satisfaction of gig-economy workers
isf
ie
d
33Percent
Source: LSE-CEP Survey
0 10 20 30 40
O
C nl
an y
op
w
___________________________
tio
or
k n
Pr fro
ef m
er ho
w m
or
k e
fro
m
ho
m
e
Be
tte
C rp
om ay
pl
em
Ea en
rn tp
w ay
hi
le
st
ud
yi
ng
Fl
ex
ib
ilit
y
Main reason for being self-employed
O
th
er
34Percent
Source: LSE-CEP Survey
0 5 10 15 20 25
O
C nl
an y
op
w
___________________________
tio
or
k n
Pr fro
ef m
er ho
w m
or
k e
fro
m
ho
m
e
Be
tte
C rp
om ay
pl
em
Ea en
rn tp
w ay
hi
le
st
Gig-economy workers
ud
yi
ng
Fl
ex
ib
ilit
y
Main reason for being self-employed
O
th
er
35Percent
Source: LSE-CEP Survey
0 10 20 30 40 50
Si
ng
le
in
di
___________________________
vi
C du
om al
pa
n y
1-
10
C em
om
pl
pa
ny .
11
-1
C 00
om em
pa pl
ny .
10
1-
50
0
C em
om pl
pa .
ny
>5
00
em
pl
.
Main client, contractor or customer
O
th
er
36Income insecurity
How would you pay for an emergency expense of £500,00?
Self-employed Gig-workers
Put it on my credit card and pay it off in full at the next statement 0.19 0.28
Put it on my credit card and pay it off over time 0.19 0.29
With the money currently in my checking/savings account or with cash 0.37 0.29
Using money from a bank loan or line of credit 0.06 0.17
By borrowing from a friend or family member 0.13 0.16
Using a payday loan, deposit advance, or overdraft 0.02 0.07
By selling something 0.08 0.07
I wouldn’t be able to pay for the expense right now 0.19 0.09
Total 2,131 535
___________________________
Source: LSE-CEP Survey 37Zero hours contracts
• Contracts with no guaranteed hours or times of work
• Around 2.7% of all workers are recorded as being on ZHC (LFS, 2017)
o More likely to be younger, female and lower tenure
o Work 10 hours less than average employee + work unpaid hours
o Low pay, large proportion on minimum wage
o Concentrated on accommodation/food, retail, education and health care industries
• Zero hours contracts: necessity or choice?
o Stark dichotomy between workers who value flexibility provided by ZHC jobs, and
workers who would rather work more and more regular hours
38Desired hours of work for ZHC
50
40 30
Percent
20 10
0
More hours Fewer hours Satisfied
___________________________
Source: LSE-CEP Survey 39Reason for not working more hours (ZHC)
80
60
Percent
4020
0
d
k
y
ts
er
or
ilit
ifie
en
th
w
ab
O
al
itm
e
is
qu
bl
m
D
la
r
/
de
m
ss
ai
co
Un
ne
av
tic
Ill
o
N
es
m
Do
___________________________
Source: LSE-CEP Survey 40Percent
Source: LSE-CEP Survey
0 10 20 30 40
___________________________
St
ud
en
t
Ill
ne
ss
/ D
D isa
bi
om lit
es y
tic
co
m
m
itm
en
ts
Le
isu
O re
th
er
t yp
es
of
w
or
k
Reason for wanting fewer hours (ZHC)
O
th
er
41Main reason for being on ZHC
30
20
Percent
10
0
ay
y
y
n
ng
er
ilit
pa
tio
th
rp
yi
ib
op
O
ud
t
en
ex
tte
st
y
Fl
em
Be
nl
le
O
pl
hi
om
w
rn
C
Ea
___________________________
Source: LSE-CEP Survey 42The US survey
• Survey using Qualtrics software and panel of respondents conducted
April 24-27, 2017 (week after Tax Day)
• Sample of 10,368 respondents recruited mainly from online ads and
social media drawn from 4 million
• Paid $1.50 each to participate
• Drop those outside of U.S., whose only work was filling out surveys,
jibberish responses, & speeders
• Weight sample to match 2011-15 ACS distribution of self-employed
workers in terms of Age, Sex, Education, Race and Household Income
• A/B Experiment on CWS self-employment question
43IRS vs. CPS data on Self-Employment
as a Share of CPS Total Employment
18
16
2014
14
Income Tax Data –
Schedule C
12
10
8
6
CPS Household 2015
4 Survey – Self Employed
Unincorporated
2
0
1979 1983 1987 1991 1995 1999 2003 2007 2011 2015
___________________________
Source: Current Population Survey; IRS Statistics of Income Publication 1304 (Table 1.3)
Note: Shading denotes recession 44Hours constraints • 40% worked less than 35 hours in self-employment last week • 33% would have preferred to work more hours last week • 15% were part-time for economic reasons (
Summary

• GIG workers are more constrained in the choice of hours than other
  persons classified as self-employed

• For the most they would like to work more hours

• Lower degree of satisfaction with the job in Italy

• Main reasons to accept gig jobs are to complement pay, work from
  home and have flexibility in hours

• Evidence of liquidity constraints for these workers (mainly in Italy)

                                                                          46
Outline
1. Evidence from comparable surveys in three countries
o Italy
o UK
o US
2. Social protection for non-standard workers
3. Wage setting (macro implications)
47Coverage of social security
• Usually self-employed workers not covered by contributory social
protection against unemployment risk, and sometimes maternity and
sickness
• Moral hazard (and adverse selection) stand on the way of social
insurance for independent workers
• How strong is the demand for social protection among self-employed
people and platform workers? Which type of insurance are they willing
to buy?
• Back to the surveys
48Ranking of various benefits - Self-employed
Italy
40
30
Percent
2010
0
Paid maternity Paid sick Workplace Family Unemployment Retirement
leave leave injuries insurance allowance benefit savings
1 2 3 4 5 6
___________________________
Source: fRDB Survey 49Ranking of various benefits - Gig-economy workers
Italy
40
30
Percent
2010
0
Paid maternity Paid sick Workplace Family Unemployment Retirement
leave leave injuries insurance allowance benefit savings
1 2 3 4 5 6
___________________________
Source: fRDB Survey 50Ranking of various benefits
40
30
Percent
2010
0
UK
Retirement UI Paid sick Health Life Worker Paid family Disability
savings leave insurance insurance compens. leave insurance
insurance
1 2 3 4 5 6 7 8
___________________________
Source: LSE-CEP Survey 51Ranking of various benefits
Gig-economy workers
40
UK
30
Percent
2010
0
Retirement UI Paid sick Health Life Worker Paid family Disability
savings leave insurance insurance compens. leave insurance
insurance
1 2 3 4 5 6 7 8
___________________________
Source: LSE-CEP Survey 52Rankings of Various Benefits
US
60
50
40
30
20
10
0
Retirement UI Sick Leave Health Ins. Life Ins. Workers' Comp Family Leave Disability Ins.
Savings
___________________________
Source: Princeton Self-Employment Survey 53Willingness to pay for sickness insurance (RCT)
Respondents asked to choose Share choosing paid sick leave
between:
100
Option 1: No paid sick leave
90
Option 2: Paid sick leave
Percent
provided by social security
(INPS) conditional on social 80
insurance contribution at tax
rate X% (varied randomly
70
across individuals) .05.25 .5 1 1.5 2 3 5
Tax rate
Self-employed Gig-worker
___________________________
Source: fRDB Survey 54Summary
• Demand varies from country to country
• In Italy and UK stronger demand for retirement savings and
unemployment insurance, in the US for health insurance
• In Italy GIG workers have much lower WTP for sickness insurance than
self-employed.
• Stronger demand for work injury insurance (case of riders)
55Policy options
• Very difficult to extend compulsory unemployment insurance to the
self-employed and the GIG workers (limited examples)
o Voluntary schemes? Adverse selection
o Unemployment insurance with no employer?
o Means-tested benefits with volatile labour earnings?
• Problems of moral hazard even with sickness insurance
• Draw on subsidized occupational insurance?
• Change the status of gig workers and self-employed with just one
contractor into dependent employment?
• Use the traceability of on-line matching to enforce social security
contributions and prevent abuse?
56How to define unemployment for the self-
employed?
• Sweden: closure of their business
• Austria: contribution to the unemployment insurance required since the
startup
• Belgium: company should go bankrupt and they did not reach minimum
income threshold in the previous two year
• Italy: short unemployment insurance for exclusive collaborators
«collaborazioni coordinate e continuative» (DISCOLL)
57Experience with the DISCOLL
• Unemployment benefit for exclusive collaborators who involuntarily
lose their job
o Extended to PhD students and researchers on temporary contracts
• Concerns about moral hazard, but low take up
Potential Claimants as %
Claimants
beneficiaries of beneficiaries
2015 18403 232000 8%
2016 9864 121000 8%
2017(*) 12481 156000 8%
___________________________
Notes: (*) Provisional data
Source: INPS 58Pro’s and Con’s of Shared Security Account
where Broker (or Hirer) of Indep. Contractors
Pays Into a Benefits Fund
Pro’s Con’s
• Independent workers covered by • Workers likely to bear the costs of
safety net benefits through lower fees
• Scale economies and reduced • Risk of adverse selection in
administrative burdens from “cafeteria” plan
pooling workers to provide
benefits • Hours proration is problematic
because workers can work on
• Prevents free riding by requiring multiple jobs at once or devote
hiring party to contribute to effort to personal tasks during
benefits work time (WA: 25% of fee up to
• Comprehensive solution that $6/hour)
maintains flexibility and creates • Only affects a small (but growing)
new social contract for 21st slice of self-employed workers if
Century economy, especially if confined to brokers
applied to all workers
• Part of Independent Contractors’
fee is a return on capital
59Pros and cons dependent employment status
Pro’s Con’s
• Link social security contribution • Payment on a hourly basis rather
to employer than linked to productivity (but
• Easier to define unemployment possible to have piece rate pay
spells and to tie means tested and enforce accordingly hourly
benefits to earnings minima)
• Possibly less adverse selection? • May not satisfy individual’s
preferences/need for flexibility
• Mitigates transfer of
demand/productivity risk from • Risk of worsening of employment
employer to independent worker conditions (e.g. zero hours
contracts)
60Pros and cons social security platforms
Pro’s Con’s
• They can reduce administrative • May be costly for liquidity
costs for employers constrained and/or small firms
• Improve risk sharing if payments • Hard to implement/monitor given
are deposited at social security evolving nature of online
before the task is carried out economy
• Improve collection of social • Relationship with umbrella
security contributions and companies to be defined
awareness of workers that
contributions are not taxes but
insurance premia
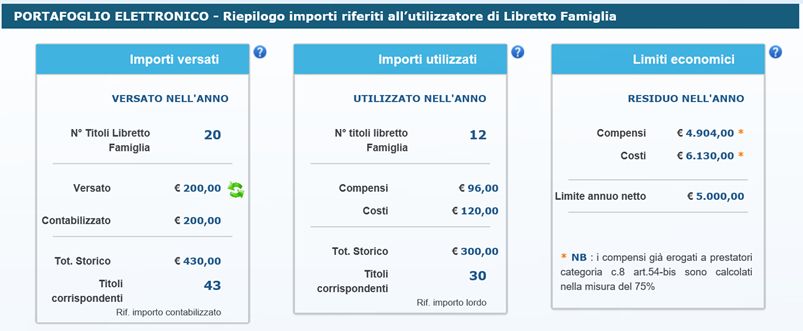
61Example of the INPS platform for occasional
workers
62Outline
1. Evidence from comparable surveys in three countries
o Italy
o UK
o US
2. Social protection for non-standard workers
3. Wage setting (macro implications)
63Does spread of alternative forms of
employment explain why do wages not grow
during the recovery?
• Alternative work arrangements responsible for almost all of net employment
growth in US from 2005 to 2015
64Wages are not coping with productivity growth
(and unemployment declines)
Variations in Wages and TFP Variations in Wages and Unemployment
2012-2016 2012-2016
Bisecting line
1,0
4
Annual average variations in wages
DE
0,5 FR
Annual average variations in average wages
3 NL IT
ES AT FI
0,0
2 -8,0 -6,0 -4,0 -2,0 0,0 2,0
-0,5 BE
1
ES FR DE
NL -1,0
AT IT
0
0 1 2 3 4 -1,5
BE FI
PT
-1
-2,0
PT IE
-2 IE -2,5
-3 -3,0
Δ TFP Δ Unemployment rate
___________________________
Source: Eurostat 65Median hourly wage by type of Gig-economy worker
Italy
12
10 8
Euros
6 4
2
0
Gig as Gig as Gig worker
First Job Second Job but Unemployed
___________________________
Source: fRDB Survey 66Minimum wages and zero hours contracts
• Are ZHCs inherently low-paid jobs (tasks, skills, flexibility…) or are minimum
wage uprates responsible for increased ZHC utilization?
o ZHCs can help employers buffer wage cost shock due to minimum wage increases
o Transfer burden of insecurity onto employees, potentially worsening their
employment conditions in spite of wage increase
• Study causal effect of National Living Wage introduction on ZHC utilisation(1)
o NLW increased minimum hourly rate for adult workers to £7.20 from April 1, 2016
o Context of English adult social care sector (care homes and domiciliary care)
• For a domiciliary care worker paid at MW, hourly wage up by 7.5% and
probability of being on ZHC up by 4.7%
o Should we have a higher minimum wage for ZHC workers (Taylor Review, 2017)?
___________________________
Notes: (1) Datta, Giupponi and Machin (2018) 67Distribution of ZHC jobs by hourly wage
25 Number of jobs:
Below £7.2 (Pre-NLW)= 29510
Below £7.2 (Post-NLW)= 8140
Between £7.2-£8.8 (Pre-NLW)= 25885
20
Between £7.2-£8.8 (Post-NLW)= 52251
Number of ZHC jobs
Total change in ZHC jobs below £8.8
(Post-Pre) = 4996 ZHC jobs (+9%)
5 10 0 15
5 6 7 8 9 10
Hourly wage
Pre-NLW Post-NLW
___________________________
Source: National Minimum Dataset for Social Care (NMDS-SC) 68Distribution of jobs by hourly wage
25
Number of jobs:
Below £7.2 (Pre-NLW)= 115693
Below £7.2 (Post-NLW)= 41580
Between £7.2-£8.8 (Pre-NLW)= 81315
20
Between £7.2-£8.8 (Post-NLW)= 157428
Total change in jobs below £8.8
Number of jobs
(Post-Pre) = 2000 jobs (1%)
10 5
0 15
5 6 7 8 9 10
Hourly wage
Pre-NLW Post-NLW
___________________________
Source: National Minimum Dataset for Social Care (NMDS-SC) 69Final remarks
• Alternative work arrangements have increased in recent years, even in countries
in which traditional self-employment is declining (e.g. Italy)
• Evidence that new self-employed are particularly hourly constrained and would
like to work more hours
• Heterogeneity in pay, but significant component with low pay
• Strong demand for social protection, notably unemployment and retirement in
Europe and health insurance in US
• Need to redesign social transfers and wage floors
70You can also read