Sustainable Seafood: A Global Benchmark - INTRODUCTION - Certification & Ratings ...

Page created by William Norman
 
CONTINUE READING
Sustainable Seafood: A Global Benchmark - INTRODUCTION - Certification & Ratings ...
Sustainable Seafood:
A Global Benchmark

INTRODUCTION
The Seafood Certification & Ratings Collaboration brings together five global programs – Aquaculture Stewardship
Council, Fair Trade USA, Marine Stewardship Council, Monterey Bay Aquarium Seafood Watch, and Sustainable Fisheries
Partnership – working to help seafood buyers make more sustainable choices and guide seafood producers along a clear
path toward environmental sustainability and social responsibility. Through the Collaboration, we aim to coordinate our
tools, consolidate our data, and increase our impact.

Certification and ratings programs play complementary roles to drive improvement and meet a range of market needs. Ratings
focus on assessing as many seafood sources as possible in key markets to provide information on the full spectrum from low
to high performance. This information can be used to identify opportunities for producers to pursue improvement projects
and certifications, as well as help businesses evaluate sourcing options. Certifications directly engage with fisheries and farms
and require them to address social and environmental challenges to reach a verified level of performance. Certifications also
engage with the supply chain to verify the sustainability and origin of certified products.

A prerequisite for increasing our impact is understanding the progress certifications and ratings have made to date. Since the
Collaboration launched in 2015, one of our objectives has been to consolidate our programs’ data for the purpose of developing
a global analysis of the sustainable seafood landscape. We envision this as a series of annual analyses, giving seafood buyers,
mid-chain suppliers, producers, and other stakeholders a means to track progress toward worldwide sustainability. This initial
edition is intended as a benchmark, illustrating the current level of performance and identifying the improvements needed
going forward. We plan to supplement this analysis with a second edition later this year, highlighting further progress and
challenges in key seafood sectors, followed by an online tool that will make global production, demand, and engagement data
more accessible.

Our analysis begins with an overview of the major components of worldwide seafood production. It then overlays the reach of
certification and ratings programs that are members of this Collaboration, describing:

  ‡‡ The share of global production that has already been certified or rated;
  ‡‡ The proportion engaged in assessment or improvement and, thus, on the path toward sustainability; and
  ‡‡ The remaining proportion representing fisheries and farms not yet engaged in our ratings or certification programs.

SUSTAINABLE SEAFOOD: A GLOBAL BENCHMARK                                                                                        1
Sustainable Seafood: A Global Benchmark - INTRODUCTION - Certification & Ratings ...
This analysis is then broken down for wild capture fisheries and aquaculture, exploring the current status of each production
method, followed by additional details on the reach of each Collaboration member organization.

This report also includes snapshots of the current market demand for sustainable seafood, the global livelihoods impacted
by the seafood industry, and improvement priorities for wild fisheries. Continuing to build demand for sustainable products,
addressing social responsibility, and using the leverage of buyers to support fisheries and aquaculture to improve their
performance are three priorities for further action in the sustainable seafood movement.

The Collaboration member organizations provided the data on certification and rating programs and their reach. This analysis
focuses on the impact of Collaboration member programs and does not include information on the reach of other certification
or rating systems. We are grateful to MRAG Americas for its work to consolidate this information with the Food and Agriculture
Organization of the United Nations fishery and aquaculture statistics and contribute to this analysis. Additional information
on the methodology, data sources, and limitations of this analysis is available in the technical appendix at the end.

What this analysis finds is that the sustainable seafood movement has made significant progress during its first two decades.
Production in regions of the world with more mature and robust management regimes is largely certified, rated, or engaged
along the path toward environmental sustainability and social responsibility. This is no small accomplishment, given that
these same regions had no certified or rated fisheries or farms as recently as 2000. It is a credit to the seafood industry at
all levels from producer to end buyer for making sound but not easy decisions to forego immediate-term revenue in favor of
long-term viability, as well as to the many sustainability NGOs – including but extending far beyond those participating in this
Collaboration – who have worked to support businesses committed to improvement.

Much of the progress to date has been driven by European and North American market interest. While this demand will sustain
continued engagement of some farms and fisheries globally, more work is needed to engage markets in other regions of the
world. Accelerating market progress in Asia, Latin America, and Africa is critical, not only because farms and fisheries there
account for the largest share of global seafood production, but also because they account for the largest share of seafood
industry livelihoods. While critical work has begun in these regions, industry and NGO efforts to promote the demand for
sustainable seafood must intensify to improve a greater share of seafood production.

To engage these and other markets on the path toward environmental sustainability and social responsibility will is a significant
task. Overcoming the challenges ahead will require continued and expanded engagement by seafood businesses, as well as
creativity, tenacity, and collaboration by the many NGOs that share our commitment to a future where all the world’s seafood
is fished and farmed sustainably.

SUSTAINABLE SEAFOOD: A GLOBAL BENCHMARK                                                                                        2
Sustainable Seafood: A Global Benchmark - INTRODUCTION - Certification & Ratings ...
STATUS OF GLOBAL SEAFOOD
SUSTAINABILITY STATUS OF GLOBAL SEAFOOD PRODUCTION

Globally, approximately 200 million metric tons of seafood was produced in 2016, the most recent year for which data is
available. About 45 percent, or 90 million metric tons, is wild caught while 40 percent, or 80 million metric tons, is farmed. The
remainder, 15 percent or 30 million metric tons, is seaweed and aquatic plants.

   WILD 45%
   90,921,223 metric tons

   FARMED 40%
   80,068,829 metric tons

   SEAWEED & AQUATIC PLANTS 15%
   30,139,389 metric tons

Annual production has been steadily increasing for the past 65 years. From the 1950s through the 1980s, production growth
was driven by increased fishing and processing technology. Wild fisheries have biological and ecological limits to their
production. Since the 1990s, wild seafood production has been largely stable with, until recently, an increasing trend in the
proportion of overexploited stocks. The dramatic rise in aquaculture production has been sustaining more recent seafood
production growth. A fluctuating (20-35 percent) but significant proportion of wild production is used to make fishmeal and
fish oil, important feed ingredients for animal and fish farming.

SUSTAINABLE SEAFOOD: A GLOBAL BENCHMARK                                                                                         3
Sustainable Seafood: A Global Benchmark - INTRODUCTION - Certification & Ratings ...
SUSTAINABILITY STATUS OF GLOBAL SEAFOOD PRODUCTION (CONTINUED)

25 percent of global production is certified or rated sustainable by Collaboration members
Of total global production, one-third is rated or certified by members of the Collaboration. One-quarter of global production
is certified or green-rated, indicating a high level of environmental sustainability.

75 percent of global production is not yet sustainable or status unknown
An additional 9 percent of global production is rated red or yellow, indicating that improvements are needed to achieve
sustainability. Three percent of global production is currently engaged in a public fishery improvement project, but 63 percent
of global seafood production remains unassessed or not yet engaged in improvements by members of the Collaboration.

Priorities for assessment and improvement
As a Collaboration, we are working to prioritize fisheries and aquaculture in that remaining 63 percent for assessment and
improvement based on where there is high environmental or social risk and where there is market support for improvements.
Nearly 14 percent of global production is undergoing assessment for ratings by Monterey Bay Aquarium Seafood Watch or
undergoing assessment for certification by the Aquaculture Stewardship Council or Marine Stewardship Council. In addition,
12 percent of global seafood production is prioritized for improvement in Sustainable Fisheries Partnership’s Target 75
initiative. Target 75 is an effort to mobilize improvements in fisheries and aquaculture so that 75 percent of global production
in key sectors is sustainable or making regular, verified improvements by 2020.

                                                                                         GLOBAL SEAFOOD PRODUCTION

                                                                                                       IFIED
                                                                                                C E R T .4 M mt
                                                                                                     % 13
                                                                                               6.64
                                                                                                                                                           NO
                                                                        mt                                                                                       TY
                                                               M
                                                       9
                                                     6.
                                                                                                                                                                        ET
                                                3
                                               %

                                                                                                          mt                                                                   AS
                                         . 36

                                                                                                   .3 M                                                                        SE
                                                                                              74
                                       18

                                                                                                                                                                                SS
                                                                                         4%                                                                                         ED
                                   TED

                                                                               .9
                                                                             36

                                                                                                                                                                                    36.
                                 N -R A

                                                                   FIP

                                                                                                                                                                                       14%
                                                                                                                                                           mt
                                                           NA
                              GREE

                                                                                                                                                               3.06% 126.8 M

                                                                                                                                                                                           74.2
                                                   I F I E D, R E D, O R I

                                                                                                                                                                                           M mt
                                                               AT

YELLOW- RATED
                                                                                                                                                           FIP 6

2.17% 4.4 M mt
                            6.47%
                             R E D- R 0 M mt

                                                           T

                                                                                                                                                          NA
                                                             CER

                                                                                                                                                          RI
                                     13.
                                      AT E

                                                                                                                                                      ,O
                                                                                                                                                 ED

                                                                                                                                                      T
                                           D

                                                                                                                                             ,   RA
                                                                                                                                     F   IED
                                                                                                                              RT I
                                                       TA                                                          N OT C E
                                                                                                                                                                     NT

                                                                 RG
                                                                                                                                                              S       ME
                                                                             ET                                                                            ES
                                                                                  75                                                        SS                                                    UNDER CERTIFICATION
                       FIPS                                                          S   CO
                                                                                              PE 1                                   I N G A M mt                                                 ASSESSMENT
                       3.30% 6.6 M mt                                                                                              T
                                                                                                     2.28                     R RA        26
                                                                                                                                            .8                                                    0.55% 1.1 M mt
                                                                                                         % 24.7 M mt   U N D E . 33 %
                                                                                                                               13

FAO fishery and aquaculture statistics for 2016 from FishStatJ (2018).
Certified and under assessment volumes provided by ASC, MSC and FTUSA; Ratings and under assessment volumes provided by MBA SFW; FIP and T75 scope
volumes provided by SFP; Not yet assessed volumes from FishStatJ.

SUSTAINABLE SEAFOOD: A GLOBAL BENCHMARK                                                                                                                                                                                 4
Sustainable Seafood: A Global Benchmark - INTRODUCTION - Certification & Ratings ...
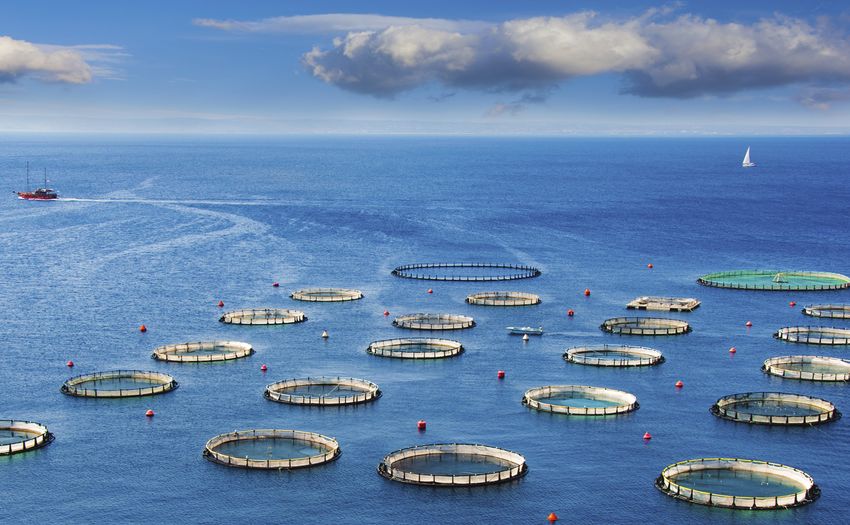
SUSTAINABILITY STATUS OF WILD SEAFOOD

14 percent of wild production is certified or rated sustainable by Collaboration members
Looking more specifically at wild seafood, 22 percent is rated or certified by members of the Collaboration. Approximately
14 percent of wild production is certified or green-rated, indicating a high level of environmental sustainability. Tuna and
whitefish are the majority of the green-rated wild seafood. Certified seafood includes whitefish (pollock and cod), tuna, and
demersal fishes, among others.

86 percent of wild production is not yet sustainable or status unknown
An additional 8 percent of wild production is rated red or yellow, indicating that improvements are needed to achieve
sustainability. Yellow-rated wild seafood includes some tuna, squid, octopus, and forage fish. Some tuna, squid, and octopus
are also red-rated along with whitefish. Seven percent of wild production is currently engaged in a public fishery improvement
project, but 71 percent of wild seafood production remains unassessed or not yet engaged in improvements by members of
the Collaboration.

Priorities for assessment and improvement
As a Collaboration, we are working to prioritize fisheries in that remaining 71 percent for assessment and improvement based
on where there is high environmental or social risk and where there is market support for improvements. Eleven percent of
wild production is undergoing assessment for ratings by Monterey Bay Aquarium Seafood Watch or undergoing assessment
for certification by the Marine Stewardship Council. In addition, 21 percent of wild seafood production is prioritized for
improvement in Sustainable Fisheries Partnership’s Target 75 initiative.

                                                                                                      WILD SEAFOOD PRODUCTION

                     GREEN - RATED                                                                            .9 M M
                                                                                                                    T
                                                                                                        11
                     0.87% 0.8 M mt                                                                  9%
                                                                                                  3.0
                                                                                                D1
                                                                                          FIE
               YELLOW- RATED                                              R          TI
               3.47% 3.2 M mt                                          CE
                                                                                                                                                                                NO

                                                                                                                    mt
                                                                                                              6.6 M
                                                                                                                                                                                    TY

                                                                                                           %2
                                                                                                        .70
                                                                                                                                                                                    ET

                                                                                                       9
                                                                                                     P2
                                                                                                                                                                                     AS

                                                                                                FI
                                                                                                                                                                                         SES

             RED-RATED
                                                                                      A
                                                                                     IN

             4.58% 4.2 M mt
                                                                                                                                                                                          SED
                                                                           OR

                                                                                                                                                                                           38.80
                                                                     E D,
                                                             C E RT I F I E D, RAT

                                                                                                                                                                                                %
                                                                                                                                                                        64.3 M mt
                                  F I P S 7.29%

                                                                                                                                                                                               35.3 M mt
                                             6.6 M mt

                                                                                                                                                                       0.30%
                                                                                                                                                                   IP 7
                                                                                                                                                                  AF
                                                                                                                                                                  IN
                                                                                                                                                         OR

                                                                                                                                                             D,
                                                                                                                                                        TE
                                                                                                                                                   RA
                                                        TA

                                                                                                                                         FI   E D,
                                                        RG

                                                                                                                         N OT C E RT I
                                                         ET

                                                             5
                                                                  SC
                                                             7

                                                                           OP
                                                                                     E2                                                             G
                                                                                       1.3                                                     T I N 7%
                                                                                                 6%                                        R RA
                                                                                                    1  9.4                         UNDE N T 9.6
                                                                                                             Mm                            ME
                                                                                                                  t
                                                                                                                                A S S E S S M mt
                                                                                                                                               8.8                                       UNDER CERTIFICATION
                                                                                                                                                                                         ASSESSMENT
                                                                                                                                                                                         0.86% 0.8 M mt

Certified and under assessment volumes provided by MSC and FTUSA; Ratings and under assessment volumes provided by MBA SFW; FIP and T75 scope volumes
provided by SFP; Not yet assessed volumes from FishStatJ.

SUSTAINABLE SEAFOOD: A GLOBAL BENCHMARK                                                                                                                                                                        5
Sustainable Seafood: A Global Benchmark - INTRODUCTION - Certification & Ratings ...
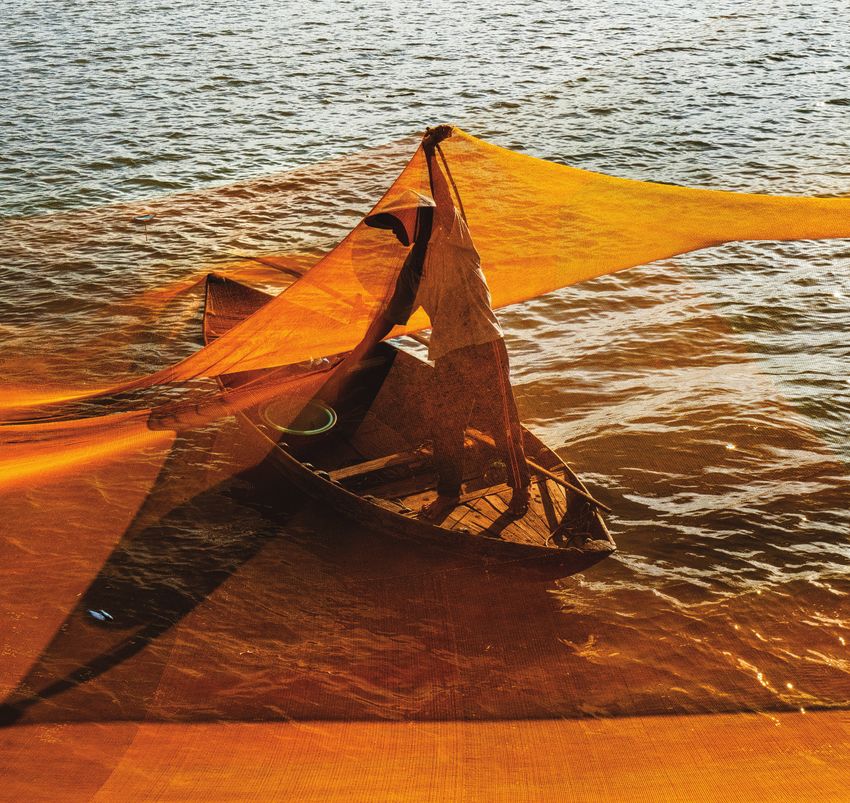
SUSTAINABILITY STATUS OF FARMED SEAFOOD

34 percent of farmed production is certified or rated sustainable by Collaboration members
Looking more specifically at farmed seafood (including seaweed), 43 percent is rated or certified by members of the
Collaboration. Approximately 34 percent of farmed production is certified or green-rated, indicating a high level of
environmental sustainability (and social responsibility for the certified products). Seaweed and bivalves are the majority of
the green-rated farmed seafood. Certified seafood includes best-performing salmon, trout, pangasius, and tilapia.

66 percent of farmed production is not yet sustainable or status unknown
An additional 9 percent of farmed production is rated red or yellow, indicating that improvements are needed to achieve
sustainability. Yellow-rated farmed seafood includes some shrimp, crustaceans, salmon, and trout. Some farmed salmon and
shrimp are red-rated, along with tilapia. Nearly 57 percent of farmed seafood production remains unassessed or not yet
engaged in improvements by members of the Collaboration, including significant volumes of Asian carp and milkfish.

Priorities for assessment and improvement
As a Collaboration, we are working to prioritize fisheries in that remaining 57 percent for assessment and improvement based
on where there is high environmental or social risk and where there is market support for improvements. Nearly 17 percent of
farmed production is undergoing assessment for ratings by Monterey Bay Aquarium Seafood Watch or undergoing assessment
for certification by the Aquaculture Stewardship Council. In addition, nearly 5 percent of farmed seafood production is
prioritized for improvement in Sustainable Fisheries Partnership’s Target 75 initiative.

                                                                                        FARMED SEAFOOD PRODUCTION
                                                     CERTIFIED 1.33% 1.5 M mt

                                                                                                                                             NO
                                                                  m
                                                                        t                                                                      TY
                                                              M                                                                                  E
                                                                                                                                                            TA
                                                         .1
                                                       36

                                                                                                                                                                SS
                                                     %

                                                                                                                                                                ESS

                                                                                                      mt
                                                   9
                                               2.7

                                                                                                                                                                 ED

                                                                                                  M
                                                                                             .7
                                                                                                                                                                    35.
                                             D3

                                                                                        47

                                                                                                                                      t
                                                                                                                                     m
                                                                            %

                                                                                                                                          6M

                                                                                                                                                                       3
                                         AT E

                                                                          24

                                                                                                                                                                      2% 3
                                                                                                                                      62.
                                                               I E D O R R AT E D 43.
                                      G R E E N -R

                                                                                                                                          R AT E D 56.76%

                                                                                                                                                                       8.9 M mt
                                                                     TIF

                                                                                                                                      OR
                                                                               R
                                                                            CE

                                                                                                                                     ED
                                                                                                                                 FI

                                                                                                                                ER
                                                                                                                            TI

                                                                                                                           TC
                                                                                                                      NO
                                                          D-
                                                     RE 2

                                                                                                                                                            T
                                                      8.

                                                         % R AT                                                                                       EN
                                                         0

                YELLOW- RATED                             8     E                D                                                           M
                                                              .8
                                                                 M                                                                   E    SS                                      UNDER CERTIFICATION
                1.10% 1.2 M mt                                           mt
                                                                                                                              G A S S mt                                          ASSESSMENT
                                                                                                                        T I N
                                                                                                           U N D E R RA
                                                                                                                                      M
                                                                                                                                  8.0                                             0.30% 0.3 M mt
                                                                                                                        . 3 5 %1
                                                                                                                     16

                                                                      TARGET 75 SCOPE
                                                                      4.79% 5.3 M mt

Certified and under assessment volumes provided by ASC; Ratings and under assessment volumes provided by MBA SFW; T75 scope volumes provided by SFP; Not
yet assessed volumes from FishStatJ.

SUSTAINABLE SEAFOOD: A GLOBAL BENCHMARK                                                                                                                                                                 6
Sustainable Seafood: A Global Benchmark - INTRODUCTION - Certification & Ratings ...
CURRENT REACH OF COLLABORATION MEMBER PROGRAMS
As shown above, one-third of global seafood production is currently certified or rated by members of the Certification &
Ratings Collaboration. The following infographic provides additional detail on the scope of each program’s engagement.

             AQUACULTURE STEWARDSHIP COUNCIL
             Aquaculture certification, environmental and social issues, certifies individual farms or groups of farms

   ‡‡ 832 FARM SITES in 39 countries producing 1.6 M                     ‡‡ More than 16,000 PRODUCTS carrying the ASC logo in
      metric tons of certified seafood.                                     75 countries.

   ‡‡ In a recent survey, 49 PERCENT of ASC-certified farms
      report that they have improved working conditions and              ‡‡ More than 1,800 BUSINESSES certified to the chain of
      46 percent report they have reduced their impact on the               custody standard in over 70 countries.
      environment since achieving certification.

             FAIR TRADE USA
             Wild capture certification, environmental and social issues, certifies small- to medium-scale fishermen

                                                                         ‡‡ Certified fisheries have generated over $1.25 M
   ‡‡ 9 FISHERIES in five countries producing 5,000 metric tons             IN COMMUNITY DEVELOPMENT FUNDS for local
      of certified seafood.                                                 environmental, educational, and other
                                                                            community projects.

             MARINE STEWARDSHIP COUNCIL
             Wild capture certification, environmental and forced/child labor issues, certifies groups defined by stocks, gears, and vessels

                                                                         ‡‡ More than 35,000 PRODUCTS carrying the MSC logo in 112
   ‡‡ 470+ FISHERIES certified in 53 countries producing 12.5 M
                                                                            countries representing more than 900,000 metric tons of
      metric tons of certified seafood.
                                                                            labeled products.

                                                                         ‡‡ More than 4,500 BUSINESSES certified to the chain of
   ‡‡ More than 1,400 IMPROVEMENTS delivered by
                                                                            custody standard in over 90 countries encompassing 32,000
      MSC-certified fisheries.
                                                                            restaurant outlets and 7,000 wet fish counters.

             MONTEREY BAY AQUARIUM SEAFOOD WATCH PROGRAM
             Wild capture and aquaculture ratings, environmental issues, rates specific fisheries and regional aquaculture

   ‡‡ 2,152 FISHERY AND AQUACULTURE                                      ‡‡ More than 25,400 BUSINESS LOCATIONS
      RECOMMENDATIONS, representing 394 species and 67                      worldwide use SFW recommendations to inform
      M metric tons of seafood.                                             purchasing decisions.

   ‡‡ Recommendations cover 33 PERCENT OF THE VOLUME
      OF GLOBAL WILD AND FARMED PRODUCTION and 85
      percent of the seafood by volume available on the U.S. and
      Canadian markets.

             SUSTAINABLE FISHERIES PARTNERSHIP FISHSOURCE
             Wild capture and aquaculture ratings, environmental issues, rates specific fisheries and aquaculture zones

                                                                         ‡‡ 49 AQUACULTURE PROFILES at the species/province level
   ‡‡ 3,600 FISHERIES with profiles in FishSource.
                                                                            since being added to FishSource in 2018.

SUSTAINABLE SEAFOOD: A GLOBAL BENCHMARK                                                                                                    7
GROWING GLOBAL DEMAND FOR SUSTAINABLE SEAFOOD
Over the past 20 years, demand for sustainable seafood products has grown across the world – creating the incentive for
much of the progress toward sustainable practice reflected on the previous pages. Products certified by the Aquaculture
Stewardship Council, Marine Stewardship Council, and Fair Trade USA are sold in 147 countries, while more than 5,400
companies around the world hold chain of custody certificates. Europe is home to the biggest concentration of both certified,
labeled products and chain of custody certificate holders.

  DISTRIBUTION OF CERTIFIED AND LABELED PRODUCTS AND CHAIN OF CUSTODY CERTIFICATE HOLDERS

           AFRICA
           8,888  21
            ASIA
         7,815   1,051
          EUROPE
        20,701   3,413
LATIN AMERICA & CARIBBEAN
         4,397    57
      NORTH AMERICA
        9,903   843
                                                  CERTIFIED AND LABELED PRODUCTS       CHAIN OF CUSTODY CERTIFICATE HOLDERS
          OCEANIA
          405     68

Companies in Northern Europe and North America began making commitments to sustainable seafood in the early 2000s, and
these commitments have expanded globally over time. Building on these efforts to increase demand for sustainable seafood
by companies in critical markets is essential. Increased demand would provide the support and incentives fisheries and farms
supplying these markets need to make improvements. Critical markets that purchase large volumes of key species prioritized
for improvement include Japan, China, and South Korea in Asia as well as Latin America, Africa, and Southern Europe.

SUSTAINABLE SEAFOOD: A GLOBAL BENCHMARK                                                                                    8
Seafood supply chains have responded to the demands of their customers to make improvements needed to expand the
supply of sustainable seafood. There are currently 134 supply chain companies participating in roundtables focused on
fisheries or aquaculture areas that need improvement. Supply chain roundtables are forums for processors, importers, and
others that buy directly from a specific seafood sector to work together in a precompetitive context to support seafood
sources to make improvements.

                               DISTRIBUTION OF BUSINESS COMMITMENTS AND BUSINESSES
                                     PARTICIPATING IN SUPPLY CHAIN ROUNDTABLES

                BUSINESS COMMITMENTS                        BUSINESSES PARTICIPATING IN                    BOTH BUSINESS COMMITMENTS
                                                            SUPPLY CHAIN ROUNDTABLES                       & SUPPLY CHAIN ROUNDTABLES

Number of certified and labeled products and chain of custody certificate holders provided by MSC, ASC, and FTUSA; business commitments and businesses in
supply chain roundtables provided by MBA SFW and SFP.

SUSTAINABLE SEAFOOD: A GLOBAL BENCHMARK                                                                                                                9
FISHERY IMPROVEMENT PRIORITIES

                                                               Northeast
                                                               Atlantic Ocean

Northeast
Pacific Ocean                               Northwest
                                            Atlantic Ocean

                                                                                                                                            Northwest Pacific
                                                                                 Mediterranean                                              Ocean
                                                                                 and Black Sea

                                Western Central
  Eastern                       Atlantic Ocean
                                                           Eastern Central
  Central Pacific Ocean                                    Atlantic Ocean

                                                                                                                                                   Western
                                                                                                                                                   Central Pacific
                                                                                                         Western                                   Ocean
                                                                                                         Indian Ocean
                                                                         Southeast
                     Southeast                                           Atlantic Ocean                                 Eastern
                     Pacific Ocean                    Southwest                                                                                      Southwest
                                                                                                                        Indian Ocean
                                                      Atlantic Ocean                                                                                 Pacific Ocean

                                                                                               NUMBER OF FISHERIES

                                                                                                                 19
  While significant progress has been made by some wild fisheries                                                            Target 75 marine fisheries
                                                                                                                 50
  in improving their sustainability over the past two decades,
  more work is needed to ensure global fisheries remain healthy                                                100           Fisheries engaged in FIPs
                                                                                                                             making verified improvements
  and productive for the future. This chart shows the number of                                                150
  marine fisheries in each FAO region that are 1) making verified                                              200
  improvements in a public fishery improvement project; or 2) are                                              233
  prioritized for improvement by SFP, because they are not yet
  certified by a member of this Collaboration or engaged in a FIP.

  2,380 marine fisheries are currently priorities for improvement through Sustainable Fisheries Partnership’s Target 75
  initiative. Seven percent of wild fisheries are engaged in public fishery improvement projects, multi-stakeholder efforts that
  use the power of the private sector to help fisheries make the improvements needed to move toward sustainability. There
  are currently 101 active fishery improvement projects around the world. Eighty-five of these FIPs, covering 165 fisheries, are
  making verified improvements.

  The seafood industry must use its leverage to get fisheries that are currently red- or yellow-rated by Monterey Bay Aquarium
  Seafood Watch or Target 75 priorities into credible fishery improvement projects. And they must actively support fisheries
  already in improvement projects to make regular progress toward their sustainability objectives.

  Data on fisheries within the T75 scope and fisheries engaged in FIPs demonstrating improvements provided by SFP.

   SUSTAINABLE SEAFOOD: A GLOBAL BENCHMARK                                                                                                                10
SOCIAL RESPONSIBILITY IN FISHERIES AND AQUACULTURE:
60 MILLION LIVELIHOODS AT STAKE

                                                          EUROPE
         NORTH AMERICA                                    446,600
            218,400
                                                                                                 ASIA*
                                                                                               50,467,900

                                                                                                                      OCEANIA
                        LATIN AMERICA & THE CARIBBEAN
                                                                                                                      341,500
                                  2,466,100                    AFRICA
                                                              5,670,500
     Men
     Women
     Unspecified                                                                * ASIA SCALED 50%

Globally, wild and farmed seafood production employs nearly 60 million people – almost 85 percent in Asia alone.

Environmental and social challenges within fisheries and aquaculture are often linked. Addressing environmental challenges
can help ensure livelihoods are sustainable over the long term, while maintaining a critical source of food. Addressing social
challenges can lead to environmental gains as producers are able to invest in stewardship of the resources they rely on. It
is essential for the sustainable seafood movement to address social challenges directly – especially labor and human rights
abuses, but also the full range of social issues that impact fisheries and aquaculture, including gender equity.

Within the Certification & Ratings Collaboration, both the Aquaculture Stewardship Council and Fair Trade USA include
rigorous social content within their standards and the Marine Stewardship Council requires all MSC-certified fisheries to detail
the measures they have in place to mitigate the presence of forced or child labor. Sustainable Fisheries Partnership has added
socioeconomic indicators to a few of its FishSource profiles. SFP and Monterey Bay Aquarium Seafood Watch contributed to
the development of the Seafood Slavery Risk Tool.

FAO 2018 fishery and aquaculture statistics.

SUSTAINABLE SEAFOOD: A GLOBAL BENCHMARK                                                                                      11
APPENDIX: DATA AND METHODOLOGY
Seafood production charts were generated using global production data for farmed and capture fisheries (for 2016) from FAO
publicly available statistics. Seafood production refers to the defined species groupings1 as recognized by FAO in the State
of World Fisheries and Aquaculture Reports.

Proportions of seafood attributed to certification, ratings, improvements, in assessment, and priorities were based on analyses
conducted by individual programs. Data attributed to these analyses were isolated from total global production; additional
analyses aligned common efforts across the programs to recognize comparable efforts and reduce overlaps across datasets.
Certified, rated, FIP, and under assessment volumes were removed from the T75 scope where we identified common fisheries
across the datasets. Additional overlaps between FIP, rated, and under assessment volumes were further isolated. Priority volumes
were assigned to certified fisheries, fisheries under assessment for certification, and FIPs. Data from the various programs do
not represent the same year of data, but the most current available from each program within a few years’ span (2014-2018).

Global demand for sustainable seafood tracks the global distribution of certified, consumer-facing products, chain of custody
clients, business commitments and supply chain roundtables. Relevant data was provided by the individual programs. These
data represent a current snapshot of activity as provided in 2018.

Fishery improvement priorities tracks global distribution of active improvement projects against defined priorities of the
Sustainable Fisheries Partnership Target-75 initiative by major fishing area. These data represent a current snapshot of activity
as provided in August 2018.

Livelihoods dependent on fisheries and aquaculture by gender and region are compiled annually by the FAO in the State of
World Fisheries and Aquaculture reports. The data is from 2016, the most recent year available.

Data sources:
  ‡‡ Fisheries and aquaculture software. FishStatJ-                                   ‡‡ Data on certified fisheries, fisheries in assessment,
     software for fishery statistical time series. In: FAO                               certified products and chain of custody clients
     Fisheries and Aquaculture Department [online].                                      provided by the Marine Stewardship Council,
     Rome. Updated 21 July 2016.                                                         Aquaculture Stewardship Council and Fair Trade
  ‡‡ FAO. 2018. The State of World Fisheries and                                         USA.
     Aquaculture 2018 - Meeting the sustainable                                       ‡‡ Data on rated fisheries, fisheries under ratings
     development goals. Rome. License: CC BY-NC-SA                                       assessment, business commitments and supply chain
     3.0 IGO.                                                                            roundtables provided by Monterey Bay Aquarium
  ‡‡ Data on Target 75 priorities, fishery improvement                                   Seafood Watch Program.
     projects, and business commitments and supply
     chain roundtables provided by Sustainable Fisheries
     Partnership.

1. For capture fisheries, “fish” includes fish, crustaceans, molluscs and other aquatic animals, but excludes aquatic mammals, reptiles, seaweeds and other aquatic
plants. Global aquaculture production includes aquatic plants and seaweeds.

SUSTAINABLE SEAFOOD: A GLOBAL BENCHMARK                                                                                                                        12
You can also read