Fertilizer Outlook 2014-2018 - 82nd IFA Annual Conference Sydney (Australia), 26-28 May 2014
←
→
Page content transcription
If your browser does not render page correctly, please read the page content below

A/14/65b
                                                                                   June 2014
                                                                                   Final Version

82nd IFA Annual Conference
Sydney (Australia), 26-28 May 2014

Fertilizer Outlook 2014-2018

Patrick Heffer and Michel Prud’homme
International Fertilizer Industry Association (IFA)

International Fertilizer Industry Association (IFA) – 28, rue Marbeuf – 75008 Paris – France
Tel. +33 1 53 93 05 00 – Fax +33 1 53 93 05 45/47 – ifa@fertilizer.org – www.fertilizer.org

Copyright © 2014 International Fertilizer Industry Association – All Rights Reserved
This public summary report was prepared by Patrick Heffer, Senior Director of the IFA
Agriculture Committee, and Michel Prud’homme, Senior Director of the IFA Production
and International Trade Committee. The first part looks at the global context and
agricultural situation. The second part provides global and regional fertilizer consumption
projections for the period 2013/14 to 2018/19. The third part provides projections of
fertilizer supply for the period 2014 to 2018.

This report is available to the general public on the IFA web site (http://www.fertilizer.org)
or by request to the IFA Secretariat.

The Fertilizer Outlook draws on the final versions of two reports presented at the 82nd IFA
Annual Conference held in Sydney, Australia in May 2014: the IFA report Medium-Term
Outlook for World Agriculture and Fertilizer Demand: 2013/14-2018/19 and the IFA report
Fertilizers and Raw Materials Global Supply: 2014-2018. These two comprehensive
reports are strictly reserved for IFA members.

   Copyright © 2014 International Fertilizer Industry Association - All Rights Reserved

                  Disclaimer of Liability for IFA Reports/Presentations
IFA endeavours to base its reports and presentations on accurate information, to the
extent reasonably possible under the circumstances. However, neither IFA nor its
members warrant or guarantee any information IFA publishes or presents, and they
disclaim any liability for any consequences, direct or indirect, arising from the use of or
reliance upon IFA publications or presentations by any person at any time.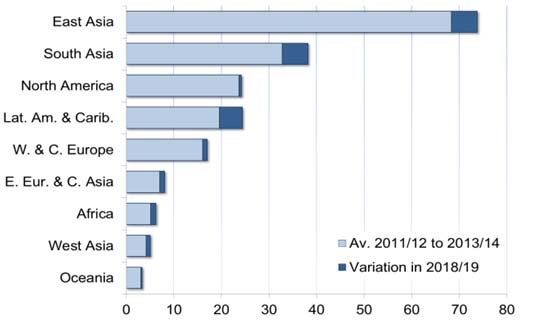
ECONOMIC AND POLICY                                              WORLD AGRICULTURE
CONTEXT
                                                                 Second largest crop ever in perspective for
                                                                 the 2014/15 campaign
The world economy has been recovering
since the second half of 2013                                    Favourable weather conditions across all the
                                                                 major producing areas and very attractive crop
World economic activity started to rebound in the                prices boosted the 2013 harvest. Record outputs
second half of 2013. Global GDP growth is                        were achieved for all cereal and oilseed crops.
expected to improve in 2014 and 2015, reflecting
progressive recovery in advanced economies.                      Global cereal inventories, as well as stocks held
                                                                 by the major exporters at the end of the 2013/14
In the medium term, the world output is projected                campaign, have been rebuilt, leading to declining
to rise by almost 4% annually, with rates slightly               prices. However, prices remain relatively
over 2% for advanced economies and over 5%                       attractive compared to historical trends.
for emerging and developing economies. The
medium-term outlook is characterized by a                        Preliminary forecasts for the 2014/15 campaign
slowdown of growth prospects in China                            indicate that the 2014 global cereal output would
compared to historical trends. Some of the main                  be the second largest ever. If cereal production
uncertainties in the outlook include public debt                 forecasts materialize, the campaign would be
and fiscal adjustment fatigue in advanced                        fairly balanced and the stock-to-use ratio would
economies, persisting high unemployment and                      remain comfortable compared to two years
the threat of deflation in the EU, the financial                 earlier.
vulnerabilities of some emerging economies, and                  There are, however, fears that the impact on
geopolitical tensions in the Middle East and in                  winter wheat of the drought in the southern
Ukraine.                                                         plains of the United States (US) may be
Commodity prices in general, and crude oil                       underestimated; and that rain-delayed maize
prices in particular, remained high in 2013 and                  plantings in the US Corn Belt might impact the
the beginning of 2014. Oil prices are seen as                    maize area and yield. These concerns are
remaining stable in 2014 and would slightly                      exacerbated by those about the geopolitical
contract in 2015.                                                situation in Ukraine and prospects for an El Niño
                                                                 event in 2014/15.
Faster improvements in nutrient management
performance may influence the outlook                            Agricultural markets would remain tight in
                                                                 the medium term
Fertilizer management is mostly influenced by
two sets of policies: fertilizer subsidies and                   Production of cereals and oilseeds is projected
nutrient management policies. In a five-year                     to expand steadily, with higher growth rates for
perspective, changes to fertilizer subsidy                       soybean and maize than for wheat and rice.
schemes can be anticipated in India to rebalance                 About two-thirds of the productivity gains would
fertilization; fertilizers are likely to be subsidized           come from higher productivity. Area expansion
in a larger number of Sub-Saharan African                        would mostly take place in South America and
countries to trigger adoption by smallholders;                   the Commonwealth of Independent States (CIS)
effective and efficient nutrient management may                  for annual crops, and in Southeast Asia for oil
become a policy goal of more and more                            palm.
countries, including some emerging economies;                    Because maize ethanol production is seen as
and food companies are increasingly setting their                growing modestly over the outlook, the increase
own nutrient management standards. All these                     in global cereal consumption in the next five
anticipated changes will influence future fertilizer             years is expected to be led by a strong rebound
demand.                                                          of feed uses. Utilization of maize is projected to
                                                                 rise faster than demand for wheat and rice,
                                                                 reflecting the contribution of feed uses. Trade
                                                                 volumes are seen as increasing strongly, led by
                                                                 rising imports by China to meet its feed
                                                                 requirements.

                                        nd
                                        82 IFA Annual Conference, Sydney, May 2014
                              “Fertilizer Outlook 2014-2018” P. Heffer and M. Prud’homme, IFA

                                                           -1-
The world stock-to-use ratio for rice would Short-term Forecasts for
contract from its current high, while the ratios for World Fertilizer Demand (Mt nutrients)
wheat and maize are expected to tighten slightly, N P2O5 K2O Total
raising concerns about the vulnerability of the 11/12 107.9 41.4 28.0 177.2
wheat and coarse grain markets. 12/13 108.8 41.1 28.7 178.6
13/14 (e) 112.2 41.7 30.2 184.0
With persisting tight market conditions, Change +3.1% +1.4% +5.3% +3.1%
international cereal prices are seen as firming 14/15 (f) 114.3 42.6 31.0 187.9
over the outlook and remaining attractive, well Change +1.9% +2.4% +2.5% +2.1%
above their pre-crisis levels. (e): estimate; (f): forecast
Source: P. Heffer, IFA, June 2014
Global fertilizer demand is anticipated to
FERTILIZER DEMAND reach 200 Mt in 2018/19
The medium-term outlook for agriculture remains
World fertilizer demand is seen as
favourable overall, with projected persisting tight
rebounding firmly in 2013/14
market conditions and firm prices for the main
Supported by strong crop prices in the first half agricultural commodities. Positive market
of the year and a rebound in South Asia, world fundamentals are expected to boost fertilizer
consumption in 2013/14 is seen as growing by use. Under the baseline scenario, world demand
3.1% year-on-year, to 184 Mt nutrients. would rise on average by 1.8% per annum (p.a.)
N demand would readjust following weak growth between the base year (average of the 2011/12
in 2012/13. It is expected to rise by 3.1% to to 2013/14 campaigns) and 2018/19. For the first
112.2 Mt. World demand for P fertilizers would time ever, aggregate global demand would
rebound modestly, by 1.4%, to 41.7 Mt, while exceed 200 Mt. Demand for K fertilizers would
K consumption is seen as sharply up, by 5.3%, expand faster (2.8% p.a. to 34 Mt) than that for P
to 30.2 Mt. (1.9% p.a. to 46 Mt) and N (1.5% p.a. to 120 Mt)
fertilizers.
Fertilizer demand in 2013/14 is anticipated to
contract slightly in North America as a result of Medium-term Forecasts for
declining crop prices and unfavourable weather World Fertilizer Demand (Mt nutrients)
at the beginning of 2014. Demand is seen as up N P2O5 K2O Total
in the rest of the world. It would rebound firmly in Av. 2011/12
109.6 41.4 29.0 179.9
South Asia, while high growth rates of 5% or to 2013/14 (e)
more are seen in Oceania, West Asia, Latin 2018/19 (f) 119.8 46.2 34.2 200.3
America and Africa. Demand would expand Av. Annual
+1.5% +1.9% +2.8% +1.8%
more modestly in the remaining regions. South Change
Asia, East Asia and Latin America would record Source: P. Heffer, IFA, June 2014
the largest year-on-year increases in volume.
The highest growth rates are forecast in Latin
The outlook for 2014/15 is relatively positive, America (3.7% p.a.), where cultivated land area
with declining but still fairly attractive prices for is expanding steadily, followed by Africa (3.4%
cereals and oilseeds, which are anticipated to
p.a.), where volumes are still very low and
stimulate fertilizer applications. Global fertilizer several countries subsidize fertilizers to stimulate
demand is forecast to expand by 2.1%, to 188 consumption, and West Asia (+3.1% p.a.), where
Mt. Demand for K would continue to grow firmly the geopolitical situation can be expected to
(+2.5%, to 31.0 Mt), while demand for P would improve. Demand is seen as progressively
rise faster than in the recent past (+2.4%, to rebounding in South Asia (2.6% p.a.), assuming
42.6 Mt), and demand for N would expand more transition to a more effective fertilizer subsidy
modestly (+1.9%, to 114.3 Mt). Fertilizer demand regime, while East Asian demand growth would
would increase in all the regions but Oceania,
continue to decelerate (+1.3% p.a.) as China’s N
where it would slightly retreat following a strong and P fertilizer demand reaches a plateau.
increase in the previous season. Demand would Demand expansion in the rest of the world would
rebound in North America and continuous growth
be modest. East Asia, South Asia and Latin
is seen in all the other regions, with rates above America are forecast to account for 27, 26 and
3% in Africa, South Asia and Latin America. The 24%, respectively, of the global increase in
largest increases in volume are anticipated in
demand.
East Asia, South Asia and Latin America.
nd
82 IFA Annual Conference, Sydney, May 2014
“Fertilizer Outlook 2014-2018” P. Heffer and M. Prud’homme, IFA
-2-Medium-term Outlook for Global fertilizer demand is growing
Total Regional Fertilizer Demand (Mt nutrients) moderately
In the medium term, global fertilizer consumption
would show moderate annual growth of 1.8% to
reach 199.4 Mt nutrients in 2018. Increases are
projected for all three major nutrients, with
average annual growth rates of 1.5% for
nitrogen, 2.0% for phosphorus and 2.9% for
potassium.
Total sales in the fertilizer and industrial sectors
in 2018 are forecast at 263 Mt nutrients,
representing a 12% increase over 2013.
Source: P. Heffer, IFA, June 2014
Positive effects from industry investments
Trends for the next five years show a
progressive slowdown of N demand growth, Investments in new capacity by the fertilizer
while P and K demand would continue to expand industry will have positive effects in the form of
linearly. This decline in N demand growth is new supply to secure growing fertilizer demand
driven by N use efficiency gains in developed and employment in the manufacturing and
countries and, more recently, in some emerging mining sectors. Close to 200 expansion projects
economies. are expected to come on stream in the next five
years, in addition to 30 projects related to
phosphate rock mining.
Global capacity of fertilizer products and raw
materials would increase by 146 Mt products, or
FERTILIZER SUPPLY 18%, over 2013. These developments equate to
a total investment of US$110 billion. Close to
40 thousand direct jobs and 60 thousand indirect
World nutrient sales were rather static in 2013 as jobs would be created through the fertilizer
a result of stagnant fertilizer demand. Fertilizer industry’s on-going investments in new
demand was depressed in South Asia, while productive capacity.
showing marginal growth in East Asia and North
America. The main depressing factors included Global and regional supply trends
variations in exchange rates and economic
uncertainties. Global fertilizer consumption would A number of developments would occur across
likely recover in 2014. regions, reinforcing some regional capacity
trends to benefit from abundant natural resource
endowments.
World Fertilizer Consumption
Calendar Year Basis Mutual interests in supporting and expanding
domestic consumption or securing access to
Mt nutrients 2013 2014(e) 2018(f)
feedstock for import will foster intra- and inter-
regional partnerships.
Nitrogen N 111.3 113.7 119.5
Polarization appears to emerge between
Phosphorus P2O5 41.8 42.2 45.9 exportable supply regions and import demand
Potassium K2O 29.7 30.8 34.0 regions. The optimization of operational and
environmental performance is leading the
Total 182.8 186.7 199.4 fertilizer industry towards more vertical and
Source: P. Heffer, IFA, June 2014 horizontal integration and inducing broad-based
consolidations in developed countries.
Global nutrient sales for all uses in 2013 were
estimated at 236 Mt nutrients, increasing 2.0%
over 2012. On average, the fertilizer industry
operated at 79% of installed capacity.
nd
82 IFA Annual Conference, Sydney, May 2014
“Fertilizer Outlook 2014-2018” P. Heffer and M. Prud’homme, IFA
-3-Nitrogen Outlook World Nitrogen
Potential Supply/Demand Balance
Large ammonia capacity increases expected (million metric tonnes N)
in East Asia and Africa
Global ammonia capacity is projected to grow 2014 2015 2016 2017 2018
16% over 2013, reaching 245 Mt NH3 in 2018. Supply
Capacity 178.37 187.02 193.78 199.73 201.47
The main additions to capacity will be in East
Potential Supply* 152.77 159.59 165.78 172.06 176.49
Asia (China, Indonesia), Africa (Algeria, Egypt,
Nigeria), West Asia (Saudi Arabia, Iran, Bahrain) Demand
and Latin America (Venezuela, Brazil). Fertilizer Demand 113.65 115.71 116.95 118.23 119.50
Non-fertilizer Demand 31.65 33.81 35.90 37.47 38.97
Moderate net growth of seaborne ammonia Distribution Losses 2.50 2.57 2.63 2.70 2.76
supply Total Demand 147.80 152.09 155.47 158.40 161.23
Global seaborne ammonia availability in 2018 Potential Balance 4.97 7.50 10.31 13.66 15.26
may increase 3-4% over 2013 to reach 19 Mt, % of Supply 3% 5% 6% 8% 9%
assuming a gradual ramp-up of new capacity.
The integration of new downstream capacity * Supply is effective capacity, equating to maximum
achievable production. It is derived by multiplying capacity
would reduce global seaborne ammonia by the highest achievable operating rate.
availability to below 18 Mt in 2015 and 2016. Source: M. Prud’homme, IFA, June 2014
Firm demand in nitrogen industrial segments New urea capacity emerging in East Asia,
supports global consumption Africa and North America
Global nitrogen supply in 2018 is projected at Close to 60 new urea units are planned to come
176 Mt N and demand at 161 Mt N. on stream between 2014 and 2018, of which 25
Significant growth in demand is seen in East would be located in China. Beyond 2016, all new
Asia (+9 Mt N, especially in industrial segments), urea capacity worldwide will be located outside
South Asia (+3.0 Mt N) and Latin America China, confirming the broadening of capacity
(+2.0 Mt N). In other regions demand would expansion to other countries.
increase by 0.4-1.0 Mt N. Global urea capacity would increase by 41 Mt
Global industrial nitrogen demand is projected to between 2013 and 2018, to 245 Mt. This
expand by an overall 30% between 2013 and corresponds to a compound annual growth rate
2018, compared with a 7.4% increase in the of 3%. East Asia would contribute 36% of the net
fertilizer sector. capacity increase, followed by Africa (22%
share) and North America (13%).
Growing potential nitrogen surplus after 2016 Global urea supply is estimated at 182 Mt in
2013, 188 Mt in 2014 and 216 Mt in 2018,
Global potential supply would be more than growing at a projected average annual rate of
adequate to meet growing demand. Potential 4% over 2013.
annual surpluses due to the difference in global
supply of and demand for nitrogen products Firm demand growth in industrial uses and
would accelerate from 7-10 Mt N in 2015-2016 to moderate growth in agriculture
exceed 13 Mt N by 2017.
Under a slow-growth supply scenario, all new Global demand for urea for all uses is forecast at
supply would be absorbed by the growth of 203 Mt in 2018, increasing 34 Mt over 2013 or at
demand until 2015. Expansion of supply would a 3.3% average annual growth rate over the next
start to exceed demand growth by 2016, five years. Significant increases in urea demand
resulting in higher potential surplus, which may are seen in East Asia (mostly industrial demand),
equate to 6% of potential supply in 2018. South Asia, and Latin America. These three
regions will account for 80% of the world’s urea
demand growth during the forecast period.
nd
82 IFA Annual Conference, Sydney, May 2014
“Fertilizer Outlook 2014-2018” P. Heffer and M. Prud’homme, IFA
-4-Stable balance in the near term as demand Moderate demand growth and new supply,
growth matches supply growth leading to a gradual increase of potential
surplus in the near term
Over the next five years the potential surplus will
remain relatively stable over the period from Global phosphoric acid demand is forecast to
2014 to 2015, see an upward correction in 2016- grow at an annual rate of 2% over 2013, to reach
17 and remain stable afterward. 48 Mt P2O5 in 2018. Global phosphoric acid
supply/demand potential conditions show a
A slow-growth scenario would suggest a gradual stable potential balance in the short term,
increase of potential surplus, with potential followed by a moderate increase starting in 2016
decreases in 2015 and 2018 as a result of and reaching 4.3 Mt P2O5 by 2018, representing
project delays. 8% of potential supply.
World Urea World Phosphoric Acid
Potential Supply/Demand Balance Potential Supply/Demand Balance
(million metric tonnes product) (million metric tonnes P2O5)
2014 2015 2016 2017 2018 2014 2015 2016 2017 2018
Supply
Capacity 212.17 224.64 237.13 244.33 244.98 Supply
Potential Supply* 188.17 195.84 204.74 211.41 215.97 Capacity 55.60 57.67 58.62 60.41 61.51
Potential Supply* 46.71 48.14 49.33 50.80 52.03
Demand
Demand
Fertilizer Demand 149.10 153.74 155.53 157.61 159.51 Fertilizer Demand 37.33 38.18 38.98 39.74 40.49
Non-fertilizer Demand 30.70 34.64 38.18 40.51 42.95 Non-fertilizer Use 5.59 5.88 5.95 6.15 6.28
Total Demand 179.80 188.38 193.71 198.12 202.46 Distribution Losses 0.86 0.88 0.90 0.92 0.94
Potential Balance 8.37 7.46 11.03 13.29 13.51 Total Demand 43.77 44.94 45.83 46.81 47.71
% of Supply 4% 4% 5% 6% 6% Potential Balance 2.93 3.20 3.50 3.99 4.32
% of Supply 6% 7% 7% 8% 8%
Source: M. Prud’homme, IFA, June 2014
Source: M. Prud’homme, IFA, June 2014
Phosphate Outlook A slow supply-growth scenario shows a
reduction of potential supply by 0.6 Mt P2O5 in
A large supply of phosphate rock emerging 2018, leading to a possible surplus of less than
in Africa and West Asia 3.8 Mt, equating to 7% of potential supply in
Global phosphate rock supply would grow 18% 2018.
over 2013, to 258 Mt in 2018. Together,
Morocco, China and Saudi Arabia will account Large DAP capacity expansions over the next
for 62% of this 40 Mt increment. five years, all earmarked for export
About 22 new units for processed phosphates
Growing phosphoric acid capacity in are planned between 2013 and 2018. China
Morocco, Saudi Arabia, China and Brazil would account for one-third of them. Morocco
The global phosphoric acid capacity in 2018 is and Saudi Arabia would add another seven new
projected at 61.5 Mt P2O5, representing a net facilities.
increase of 7.2 Mt over 2013. Between 2013 and Global capacity of the main processed
2018 a total of 30 new acid units are currently phosphate fertilizers would grow by 5.1 Mt P2O5
planned for completion, of which two-thirds will between 2013 and 2018, to 47.7 Mt P2O5.
be outside China. Large capacity additions will The expansion of DAP capacity would account
occur in Morocco, Saudi Arabia, China and for 80% of this increase.
Brazil.
Global supply of phosphoric acid is estimated at
52 Mt P2O5 in 2018. Between 2013 and 2018
global phosphoric acid supply would increase by
overall 6.7 Mt overall, representing an average
annual growth rate of 3.0% over 2013.
nd
82 IFA Annual Conference, Sydney, May 2014
“Fertilizer Outlook 2014-2018” P. Heffer and M. Prud’homme, IFA
-5-Potash Outlook
World Potash
Significant capacity additions over the next Potential Supply/Demand Balance
five years (million metric tonnes K2O)
Potash capacity has continued to be developed
worldwide, but at a slower pace since 2011. 2014 2015 2016 2017 2018
About 20 expansion projects are being carried
out by established producers for completion Supply
between 2014 and 2018. Capacity 50.53 54.69 56.70 60.26 60.72
Potential Supply* 43.57 45.17 46.97 49.74 51.44
Only three greenfield projects are planned for
completion before 2019, in Canada and Russia. Demand
Global potassium capacity is forecast to increase Fertilizer Demand 30.79 31.58 32.36 33.17 33.99
from 49.7 Mt K2O in 2013 to 60.7 Mt in 2018. Non-fertilizer Demand 2.84 2.92 3.01 3.10 3.19
Distribution Losses 0.99 1.02 1.04 1.07 1.10
North America and EECA to account for 88% Total Demand 34.62 35.51 36.41 37.34 38.28
of world incremental supply between 2013 Potential Balance 8.95 9.66 10.56 12.40 13.16
and 2018 % of Supply 21% 21% 22% 25% 26%
Global potential potassium supply would Source: M. Prud’homme, IFA, June 2014
increase to 51.4 Mt K2O in 2018, representing an
overall increment of 8.8 Mt, or 20.7% growth Under a slow-growth scenario, the five-year
over 2013. global supply and demand would show relatively
stable potential surpluses of 9-10 Mt K2O
Three regions would account for nearly all the
between 2013 and 2017, followed by an increase
projected increase of potential supply: North
to 11.5 Mt in 2018, equating to 23% of projected
America (mainly Canada), would contribute
supply.
4.6 Mt K2O, followed by Eastern Europe and
Central Asia (EECA) (Russia and Belarus) with
3.4 Mt and East Asia (China) with 0.8 Mt.
Expansions in the first two regions are Sulphur Outlook
earmarked for the export markets.
New supply of exportable sulphur in West
Sustained potash demand over five years Asia and lower import demand in China and
the United States
Global demand for potassium is estimated at
38.3 Mt K2O in 2018, equating to an average Global production of elemental sulphur would
annual growth rate of 3.0% between 2013 and grow by 31% over 2013, to reach 73.3 Mt S in
2018. 2018, on account of higher S recovery from the
oil and gas sectors. Large increases in
World potash demand would expand at an exportable output are anticipated in Abu Dhabi,
average annual rate of 1.6 Mt MOP p.a. between Turkmenistan and Saudi Arabia. Production
2013 and 2018. increases in China and the United States would
reduce their respective import demand in the
Short-term equilibrium moving towards a near term.
growing surplus in the long run
Firm sulphur demand in industrial sectors,
Global demand would grow in parallel with
and moderate growth in the fertilizer sector
supply until 2016. By 2017 the annual
incremental supply would accelerate and start to Global consumption of elemental sulphur is
exceed global demand growth. projected to grow at an annual rate of 3.8% over
2013, to 70.4 Mt S in 2018.
This increase would mainly be driven by firm
growth of sulphuric acid consumption in
industrial segments (particularly in ore leaching
operations) and by recovery in demand for
fertilizers.
nd
82 IFA Annual Conference, Sydney, May 2014
“Fertilizer Outlook 2014-2018” P. Heffer and M. Prud’homme, IFA
-6-Supply/demand deficit shifting to a potential
modest surplus
The global supply/demand situation of elemental
sulphur shows a resilient deficit in 2014, shifting
to a moderate surplus, with the potential to reach
about 3 Mt S in 2018.
World Elemental Sulphur
Potential Supply/Demand Balance
(million metric tonnes S)
2014 2015 2016 2017 2018
Sulphur Demand
Sulphur for sulphuric acid 53.44 55.36 57.48 59.83 62.04
Non-sulphuric acid uses 7.99 8.11 8.18 8.25 8.34
Total Demand 61.44 63.47 65.65 68.08 70.38
Sulphur Supply
Oil recovered 27.56 28.70 29.76 30.76 32.11
Gas recovered 28.05 31.52 33.96 35.84 36.38
Others, including Frasch 3.72 3.90 4.31 4.83 4.80
Total Supply 59.33 64.12 68.02 71.42 73.29
Potential Balance -2.11 0.65 2.37 3.35 2.91
% Balance/Supply -4% 1% 3% 5% 4%
Source: M. Prud’homme, IFA, June 2014
This slow-growth supply scenario equates to a
growth rate of 6% p.a. over 2013. Under this
slow-growth scenario, the supply/demand
situation would remain in deficit until 2016 and
then shift to a marginal surplus in 2017 and 2018
of less than 1.8 Mt S.
nd
82 IFA Annual Conference, Sydney, May 2014
“Fertilizer Outlook 2014-2018” P. Heffer and M. Prud’homme, IFA
-7-You can also read