Severe Acute Respiratory Syndrome Coronavirus 2 Transmission Potential, Iran, 2020 - CDC
←
→
Page content transcription
If your browser does not render page correctly, please read the page content below
RESEARCH LETTERS

Severe Acute Respiratory For method 1, we used a generalized growth
 model (2) with the growth rate and its scaling factor
Syndrome Coronavirus 2 to characterize the daily reported incidence. Next,
Transmission Potential, we simulated the calibrated generalized growth
Iran, 2020 model by using a discretized probability distribu-
 tion of the serial interval and assuming a Poisson er-
 ror structure (Appendix).
Kamalich Muniz-Rodriguez,1 Isaac Chun-Hai Fung,1 We based method 2 on calculation of the epi-
Shayesteh R. Ferdosi, Sylvia K. Ofori, Yiseul Lee, demic’s doubling times, which correspond to the
Amna Tariq, Gerardo Chowell times when the cumulative incidence doubles and are
Author affiliations: Georgia Southern University, Statesboro, estimated by using the curve of cumulative daily re-
Georgia, USA (K. Muniz-Rodriguez, I.C.-H. Fung, S.K. Ofori); ported cases. To quantify parameter uncertainty, we
The Translational Genomics Research Institute, Phoenix, used parametric bootstrapping with a Poisson error
Arizona, USA (S.R. Ferdosi); Georgia State University structure around the number of new reported cases to
School of Public Health, Atlanta, Georgia, USA (Y. Lee, A. Tariq, derive 95% CIs (3–5). Assuming exponential growth,
G. Chowell) the epidemic growth rate is equal to ln(2)/doubling
 time. Assuming that the preinfectious and infectious
DOI: https://doi.org/10.3201/eid2608.200536 periods follow an exponential distribution, R0 ≈ (1 +
 growth rate × serial interval) (Appendix) (6).
 To determine the transmission potential of severe acute For both methods, the serial interval was as-
 respiratory syndrome coronavirus 2 in Iran in 2020, we sumed to follow a gamma distribution; mean (±
 estimated the reproduction number as 4.4 (95% CI 3.9–
 SD) = 4.41 (± 3.17) days (7; C. You et al., unpub.
 4.9) by using a generalized growth model and 3.5 (95%
 CI 1.3–8.1) by using epidemic doubling time. The repro-
 data, https://www.medrxiv.org/content/10.1101
 duction number decreased to 1.55 after social distancing /2020.02.08.20021253v2). We used MATLAB ver-
 interventions were implemented. sion R2019b (https://www.mathworks.com) and R
 version 3.6.2 (https://www.r-project.org) for data

S ince early 2020, Iran has been experiencing a dev- analyses and creating figures. We determined that
 astating epidemic of coronavirus disease (COV- a priori α = 0.05.
ID-19) (1). To determine the transmission potential Using Wikipedia as a starting point, we double-
of severe acute respiratory syndrome coronavirus checked the daily reported new cases during Febru-
2 and thereby guide outbreak response efforts, we ary 19–March 19, 2020 (the day before the Iranian
calculated basic reproduction numbers (R0). Dur- New Year) against official Iran press releases and
ing the early transmission phase, R0 quantifies the other credible news sources and corrected the data
average number of secondary cases generated by a according to official data (Appendix Tables 2, 3, Fig-
primary case in a completely susceptible population, ure 1). Incident cases for the 5 regions were miss-
absent interventions or behavioral changes. R0>1 ing for 2 days (March 2–3), which we excluded from
indicates the possibility of sustained transmission; our analysis. Because the reported national number
R0
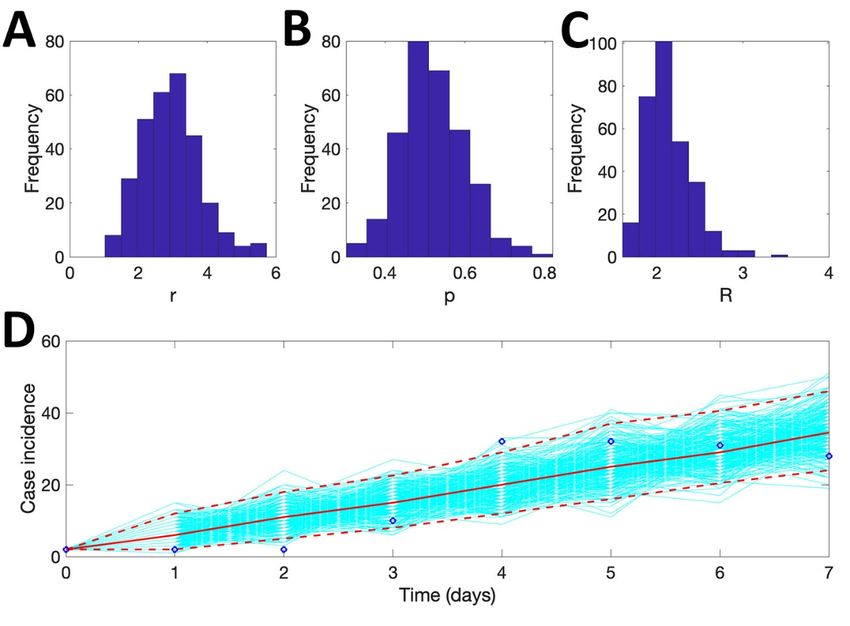
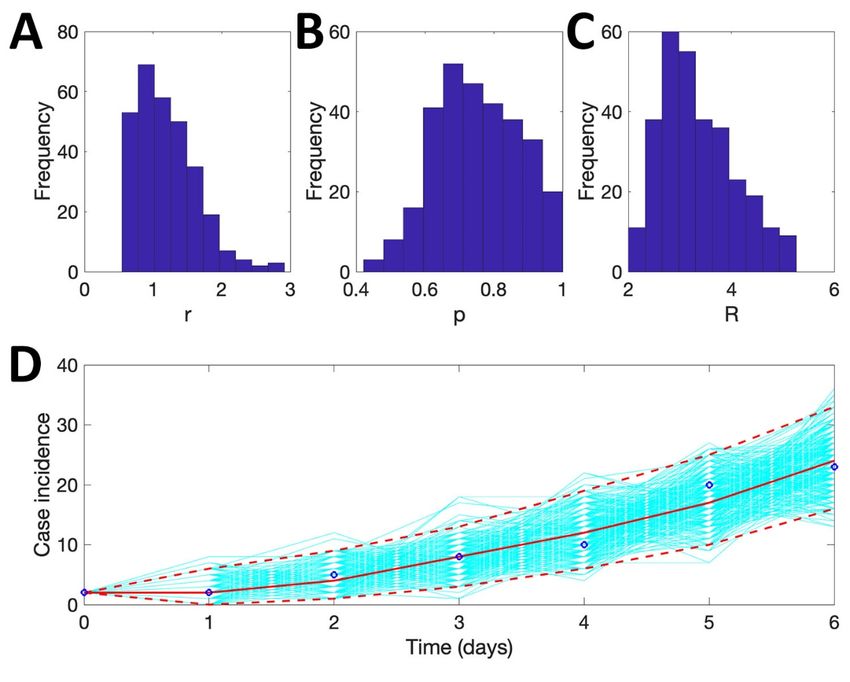
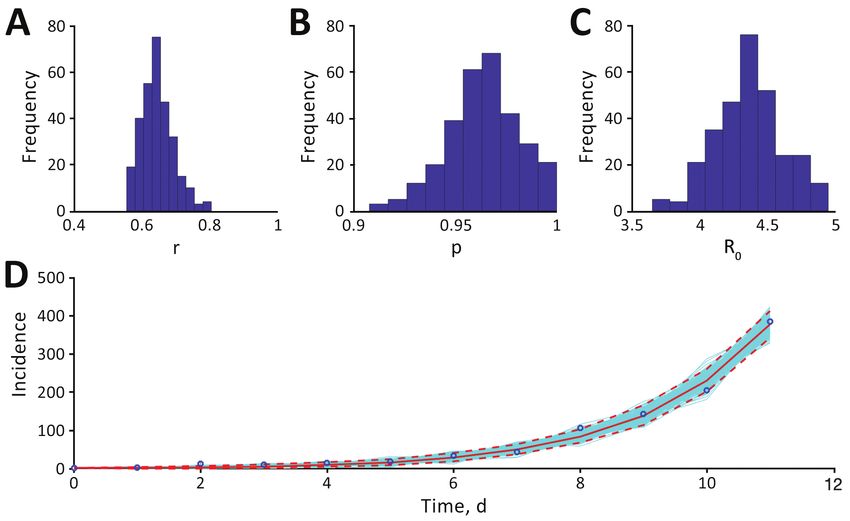
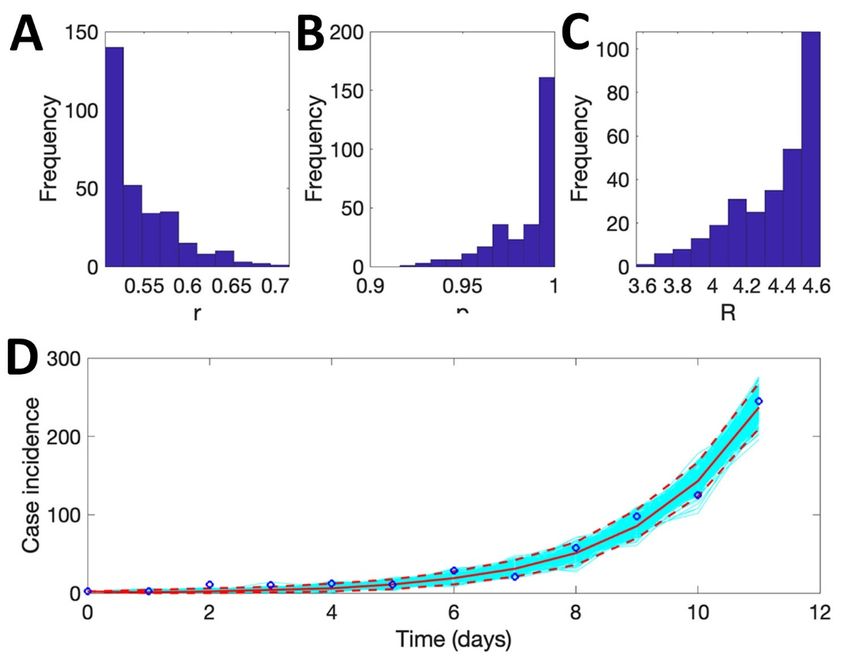
RESEARCH LETTERS

Figure. Estimates of transmission potential for severe acute respiratory syndrome coronavirus 2 in Iran, 2020. A) Growth rate, r; B)
scaling of the growth rate parameter, p; C) mean basic reproduction number, R0; and D) fit of the generalized growth model (method 1)
to the Iran data, assuming Poisson error structure as of March 1, 2020. Dashed lines indicate 95% CIs.

that during February 19–March 1, the cumulative subclinical or asymptomatic cases or limited testing
incidence of confirmed cases in Iran had doubled 8 capacity to test persons with mild illness. The rapid
times. The estimated epidemic doubling time was increase in case counts might represent a belated re-
1.20 (95% CI 1.05–1.45) days, and the correspond- alization of epidemic severity and rapid catching up
ing R0 estimate was 3.50 (95% CI 1.28–8.14). During and testing many persons with suspected cases. If
March 6–19, the cumulative incidence of confirmed the reporting ratio remains constant over the study
cases doubled 1 time; doubling time was 5.46 (95% CI period, and given the near-exponential growth of the
5.29–5.65) days. The corresponding Re estimate was epidemic’s trajectory, our estimates would remain re-
1.55 (95% CI 1.06–2.57) (Appendix Table 5, Figures 7, liable. Although data are not stratified according to
8). Our results are robust and consistent with Iran’s imported and local cases, we assumed that persons
COVID-19 R0 estimates of 4.7 (A. Ahmadi et al., un- were infected locally because transmission has prob-
pub. data, https://www.medrxiv.org/content/10.11 ably been ongoing in Iran for some time (8).
01/2020.03.17.20037671v3) and 4.86 (E. Sahafizadeh, Although the COVID-19 epidemic in Iran has
unpub. data, https://www.medrxiv.org/content/10 slowed substantially, the situation remains dire.
.1101/2020.03.20.20038422v2) but higher than the R0 Tighter social distancing interventions are needed to
of 2.72 estimated by N. Ghaffarzadegan and H. Rah- bring this epidemic under control.
mandad (unpub. data, https://www.medrxiv.org/
content/10.1101/2020.03.22.20040956v1). G.C. received support from NSF grant 1414374 as part of
 Our study has limitations. Our analysis is based on the joint NSF-NIH-USDA Ecology and Evolution of
the number of daily reported cases, whereas it would Infectious Diseases program. I.C.-H.F. received salary
be ideal to analyze case counts by dates of symptoms support from the Centers for Disease Control and
onset, which were not available. Case counts could Prevention (CDC) (19IPA1908208). This article is not part
be underreported because of underdiagnosis, given of I.C.-H.F’s CDC-sponsored projects.

1916 Emerging Infectious Diseases • www.cdc.gov/eid • Vol. 26, No. 8, August 2020
RESEARCH LETTERS

About the Authors Cluster of Coronavirus
Ms. Muniz-Rodriguez is a doctoral student in Disease Associated with
epidemiology and Dr. Fung is an associate professor of
epidemiology at Jiann-Ping Hsu College of Public Health, Fitness Dance Classes,
Georgia Southern University. Their research interests South Korea
include infectious disease epidemiology, digital health,
and disaster emergency responses.
 Sukbin Jang, Si Hyun Han, Ji-Young Rhee
 Author affiliation: Dankook University Hospital, Dankook University
References
 1. Wood G. Coronavirus could break Iranian society College of Medicine, Cheonan, South Korea
 [cited 2020 Feb 29]. https://www.theatlantic.com/ideas/
 DOI: https://doi.org/10.3201/eid2608.200633
 archive/2020/02/iran-cannot-handle-coronavirus/
 607150/ During 24 days in Cheonan, South Korea, 112 persons
 2. Viboud C, Simonsen L, Chowell G. A generalized-growth
 were infected with severe acute respiratory syndrome
 model to characterize the early ascending phase of
 infectious disease outbreaks. Epidemics. 2016;15:27–37. coronavirus 2 associated with fitness dance classes at
 https://doi.org/10.1016/j.epidem.2016.01.002 12 sports facilities. Intense physical exercise in densely
 3. Banks HT, Hu S, Thompson WC. Modeling and inverse populated sports facilities could increase risk for infec-
 problems in the presence of uncertainty: CRC Press; 2014. tion. Vigorous exercise in confined spaces should be
 4. Chowell G, Ammon CE, Hengartner NW, Hyman JM. minimized during outbreaks.
 Transmission dynamics of the great influenza pandemic
 of 1918 in Geneva, Switzerland: assessing the effects of
 hypothetical interventions. J Theor Biol. 2006;241:193–204.
 https://doi.org/10.1016/j.jtbi.2005.11.026
 B y April 30, 2020, South Korea had reported
 10,765 cases of coronavirus disease (COVID-19)
 (1); ≈76.2% of cases were from Daegu and North
 5. Chowell G, Shim E, Brauer F, Diaz-Dueñas P, Hyman JM,
 Castillo-Chavez C. Modelling the transmission dynamics Gyeongsang provinces. On February 25, a COVID-19
 of acute haemorrhagic conjunctivitis: application to the case was detected in Cheonan, a city ≈200 km from
 2003 outbreak in Mexico. Stat Med. 2006;25:1840–57. Daegu. In response, public health and government
 https://doi.org/10.1002/sim.2352
 6. Vynnycky E, White RG. An introduction to infectious officials from Cheonan and South Chungcheong
 disease modelling. Oxford (UK): Oxford University Press; Province activated the emergency response system.
 2010. We began active surveillance and focused on iden-
 7. Nishiura H, Linton NM, Akhmetzhanov AR. Serial tifying possible COVID-19 cases and contacts. We
 interval of novel coronavirus (COVID-19) infections.
 Int J Infect Dis. 2020;93:284–6. https://doi.org/10.1016/ interviewed consecutive confirmed cases and found
 j.ijid.2020.02.060 all had participated in a fitness dance class. We
 8. Tuite AR, Bogoch II, Sherbo R, Watts A, Fisman D, Khan K. traced contacts back to a nationwide fitness dance
 Estimation of coronavirus disease 2019 (COVID-19) burden instructor workshop that was held on February 15
 and potential for international dissemination of infection
 from Iran. Ann Intern Med. 2020. https://doi.org/10.7326/ in Cheonan.
 M20-0696 Fitness dance classes set to Latin rhythms have
 gained popularity in South Korea because of the high
Address for correspondence: Isaac Chun-Hai Fung, Department aerobic intensity (2). At the February 15 workshop,
of Biostatistics, Epidemiology and Environmental Health Sciences, instructors trained intensely for 4 hours. Among 27
Jiann-Ping Hsu College of Public Health, Georgia Southern instructors who participated in the workshop, 8 had
University, PO Box 7989, Statesboro, GA 30460-7989 USA; positive real-time reverse transcription PCR (RT-
email: cfung@georgiasouthern.edu; or Gerardo Chowell, PCR) results for severe acute respiratory syndrome
Department of Population Health Sciences, School of Public coronavirus 2, which causes COVID-19; 6 were from
Health, Georgia State University, Suite 662, Office 640B, Atlanta, Cheonan and 1 was from Daegu, which had the most
GA 30303, USA; email: gchowell@gsu.edu. reported COVID-19 cases in South Korea. All were as-
 ymptomatic on the day of the workshop.
 By March 9, we identified 112 COVID-19 cases
 associated with fitness dance classes in 12 differ-
 ent sports facilities in Cheonan (Figure). All cas-
 es were confirmed by RT-PCR; 82 (73.2%) were
 symptomatic and 30 (26.8%) were asymptomatic
 at the time of laboratory confirmation. Instructors
 with very mild symptoms, such as coughs, taught
 classes for ≈1 week after attending the workshop

 Emerging Infectious Diseases • www.cdc.gov/eid • Vol. 26, No. 8, August 2020 1917
Article DOI: https://doi.org/10.3201/eid2608.200536

 Severe Acute Respiratory Syndrome
 Coronavirus Transmission Potential, Iran,
 2020
Appendix

Estimate of reproduction number from daily reported cases (Method 1)

 Using the daily curve of reported cases in Iran, we estimate the reproduction number of
COVID-19 (Appendix Table 2, Figure 1). For this purpose, we first characterize the daily
reported incidence using the generalized growth model (GGM) (1). This model characterizes the
growth profile via two parameters: the growth rate parameter ( ) and the scaling of the growth
rate parameter ( ). The model captures diverse epidemic profiles ranging from constant
incidence ( = 0), sub-exponential or polynomial growth (0 < < 1), and exponential growth
( = 1) (1). The serial interval is assumed to follow a gamma distribution with a mean of 4.41
days and a standard deviation of 3.17 days based on recent reports ([2]; C. You et al., unpub.
data, https://www.medrxiv.org/content/10.1101/2020.02.08.20021253v2).

 Next, to estimate the most recent estimate of Rt, we simulate the progression of incident
reported cases from the calibrated GGM, and apply the discretized probability distribution ( )
of the serial interval using the renewal equation (3–5) given by

 = ∑ .
 =0( − )

 In the renewal equation we denote the total incidence at calendar time by . Here, the
denominator represents the total number of cases that contribute to the incidence cases at time .
Next, we estimate from 300 simulated curves assuming a Poisson error structure to derive the
uncertainty bounds around our estimate of the reproduction number (6) (Appendix Table 4).

 Page 1 of 15
Estimate of reproduction number from epidemic doubling times (Method 2)

 We ran simulation to generate 10,000 sets of estimates of epidemic doubling times for a
given time series of cumulative number of reported cases (Appendix Table 3), and to compute
the arithmetic mean of each set. Then, the harmonic mean of these estimates was calculated
across 10,000 sets of simulations and was reported as our estimated epidemic doubling time,
with 95% confidence interval (Appendix Table 5).

 Next, we drew 10,000 random values for the serial interval from a gamma distribution
with a mean of 4.41 days and a standard deviation of 3.17 days (2); C. You et al., unpub. data,
https://www.medrxiv.org/content/10.1101/2020.02.08.20021253v2). We generate 10,000 values
for the reproduction number by calculating the reproduction number for each pair of values
(arithmetic mean of epidemic doubling time and serial interval respectively) following the
equation as in Vynnycky and White (7), Table 4.1, Equation 4.14:

 Reproduction number = 1 + growth rate × serial interval

 We reported the mean and 95% confidence intervals (CI) of the 10,000 estimated values
of the reproduction number (Appendix Table 5).

Results for Regions of Iran

 Iran is geographically arranged into five regions, each of which contains a number of
provinces (see Appendix Table 1). In addition to estimating the reproduction number of COVID-
19 across Iran, we further analyzed the data for each of the five regions of Iran.

 Appendix Tables 4 and 5, and Figures 2–8, present our estimates for Regions 1 to 5 using
Methods 1 and 2. The estimates obtained from Method 1 had a smaller variance. The estimates
obtained from Method 2 had a larger variance, given the large variance of the serial interval
estimate that we used. Given that the 95% CIs of our reproduction number estimates obtained via
Method 2 were large, they overlapped with those obtained via Method 1.

 From February 19 through March 1, it appeared that whether it was for Iran as a whole,
or for its five regions, the point estimate of the estimated basic reproduction number for each
region was 2.0 or higher before the effect of social distancing interventions kicked in. From
March 6 through 19, the effective reproduction number for each region had dropped to a range

 Page 2 of 15
from 1.48 of Region 3 to 1.77 of Region 5. However, the 95% CI of each region’s estimate does
not overlap with 1. Therefore, the transmission of SARS-CoV-2 (that causes COVID-19)
remains active in all 5 regions of Iran (as effective reproduction number >1) before the Persian
New Year Day of March 20, 2020.

This study in the context of recent pre-print literature on the 2020 COVID-19
epidemic in Iran

 On April 2, 2020, we searched for “COVID-19” and “Iran” on medRXiv pre-print servers
and identified 6 manuscripts that fit mathematical or statistical models to COVID-19 case count
data obtained via official Iranian reports. See Appendix Table 6 for a summary. Three of these
papers provide reproduction number estimates (A. Ahmadi et al., unpub. data,
https://www.medrxiv.org/content/10.1101/2020.03.17.20037671v3; N. Ghaffarzadegan et al.,
unpub. data, ttps://www.medrxiv.org/content/10.1101/2020.03.22.20040956v1; Sahafizadeh et
al., unpub. data, https://www.medrxiv.org/content/10.1101/2020.03.20.20038422v2). Our
estimates of the basic reproduction number are comparable to theirs. These three papers also
identified a lower effective reproduction number for the Iranian epidemic once social distancing
interventions kicked in. However, only one paper suggested that the effective reproduction
number has dropped below unity by March 20, 2020 (N. Ghaffarzadegan et al., unpub. data,
ttps://www.medrxiv.org/content/10.1101/2020.03.22.20040956v1). The other two estimated an
effective reproduction number >1 (A. Ahmadi et al., unpub. data,
https://www.medrxiv.org/content/10.1101/2020.03.17.20037671v3; Sahafizadeh et al., unpub.
data, https://www.medrxiv.org/content/10.1101/2020.03.20.20038422v2), that is consistent with
our results.

References

1. Viboud C, Simonsen L, Chowell G. A generalized-growth model to characterize the early ascending
 phase of infectious disease outbreaks. Epidemics. 2016;15:27–37. PMID: 27266847

2. Nishiura H, Linton NM, Akhmetzhanov AR. Serial interval of novel coronavirus (COVID-19)
 infections. Int J Infect Dis. 2020;93:284–6. PubMed https://doi.org/10.1016/j.ijid.2020.02.060

 Page 3 of 15
3. Nishiura H, Chowell G. Early transmission dynamics of Ebola virus disease (EVD), West Africa,
 March to August 2014. Euro Surveill. 2014;19:20894. PubMed https://doi.org/10.2807/1560-
 7917.ES2014.19.36.20894

4. Nishiura H, Chowell G. The effective reproduction number as a prelude to statistical estimation of
 time-dependent epidemic trends. In: Chowell G, Hyman JM, Bettencourt LMA, Castillo-Chavez
 C, editors. Mathematical and Statistical Estimation Approaches in Epidemiology. 2009. p. 103–
 21.

5. Paine S, Mercer GN, Kelly PM, Bandaranayake D, Baker MG, Huang QS, et al. Transmissibility of
 2009 pandemic influenza A(H1N1) in New Zealand: effective reproduction number and influence
 of age, ethnicity and importations. Euro Surveill. 2010;15:19591. PubMed

6. Chowell G. Fitting dynamic models to epidemic outbreaks with quantified uncertainty: a primer for
 parameter uncertainty, identifiability, and forecasts. Infect Dis Model. 2017;2:379–98. PubMed
 https://doi.org/10.1016/j.idm.2017.08.001

7. Vynnycky E, White RG. An introduction to infectious disease modelling. Oxford: Oxford University
 Press; 2010.

Appendix Table 1. Regions and provinces of Iran.
Region Provinces
1 Qom Province (QOM), Tehran Province (TEH), Mazandaran
 Province (MAZ), Alborz Province (ALB), Semnan Province (SEM),
 Golestan Province (GOL), Qazvin Province (QAZ).
2 Esfahan (ESF), Fars (FRS), Hormozgan (HOR), Kohgiluyeh and
 Boyer-Ahmad (KOH), Chaharmahal and Bakhtiari (CHA), and
 Bushehr (BUS).
3 Gilan Province (GIL), Ardabil Province (ARD), East Azerbajian
 Province (AZS), West Azerbajian Province (AZG), Kurdistan (or
 Kordestan) Province (KUR).
4 Markazi (MAR), Hamedan (HAM), Khazistan (KHZ), Kermanshah
 (KRS), Lorestan (LOR), and Ilam (ILM).
5 Razavi Khorasan (KHR), Sistan and Baluchestan (SIS), Yazd (YAZ),
 South Khorasan (KHS), Kerman (KER), and North Khorasan (KHN).

 Page 4 of 15
Appendix Table 2. Daily number of new reported COVID-19 cases in Iran and its five regions*
Date (yyyy-mm-
dd) Iran Region 1 Region 2 Region 3 Region 4 Region 5
2020-02-19 2 2 - - - -
2020-02-20 3 2 - - 1 -
2020-02-21 13 11 - 2 - -
2020-02-22 10 10 - - - -
2020-02-23 15 12 - 2 1 -
2020-02-24 18 11 2 2 3 -
2020-02-25 34 29 2 2 0 1
2020-02-26 44 21 5 10 6 2
2020-02-27 106 58 8 32 6 2
2020-02-28 143 98 10 32 3 0
2020-02-29 205 125 20 31 23 6
2020-03-01 385 245 23 28 67 22
2020-03-02 523 422.1805† 20.9259† 30.8184† 42.1267† 11.1281†
2020-03-03 835 528.6418† 17.0741† 39.4146† 59.4522† 16.0099†
2020-03-04 586 424 15 54 62 31
2020-03-05 591‡ 256 150 122 49 69
2020-03-06 1234 693 180 175 112 74
2020-03-07 1076 663 126 99 82 106
2020-03-08 743 378 104 68 140 53
2020-03-09 595 265 89 119 92 30
2020-03-10 881 508 72 63 138 100
2020-03-11 958 485 200 90 78 105
2020-03-12 1075 605 62 150 183 75
2020-03-13 1289 614 147 237 121 170
2020-03-14 1365 624 173 272 186 110
2020-03-15 1209 562 149 156 126 216
2020-03-16 1053 480 189 160 97 127
2020-03-17 1178 566 118 203 134 157
2020-03-18 1192 505 255 199 120 113
2020-03-19 1046 359 160 210 140 177
*COVID-19, coronavirus disease.
†The daily new cases for each of the 5 regions on March 2 and 3, 2020, were interpolated using cubic spline. ‡The reported number of the national
total on March 5 does not match the sum of the 5 regions.

 Page 5 of 15
Appendix Table 3. Daily cumulative number of daily reported COVID-19 cases in Iran*
Date (yyyy-mm-
dd) Iran Region 1 Region 2 Region 3 Region 4 Region 5
2020-02-19 2 2 - - - -
2020-02-20 5 4 - - 1 -
2020-02-21 18 15 - 2 1 -
2020-02-22 28 25 - 2 1 -
2020-02-23 43 37 - 4 2 -
2020-02-24 61 48 2 6 5 -
2020-02-25 95 77 4 8 5 1
2020-02-26 139 98 9 18 11 3
2020-02-27 245 156 17 50 17 5
2020-02-28 388 254 27 82 20 5
2020-02-29 593 379 47 113 43 11
2020-03-01 978 624 70 141 110 33
2020-03-02 1501 NR NR NR NR NR
2020-03-03 2336 NR NR NR NR NR
2020-03-04 2922 1984 183 345 273 82
2020-03-05 3513 2240 333 467 322 151
2020-03-06 4747 2933 513 642 434 225
2020-03-07 5823 3596 639 741 516 331
2020-03-08 6566 3974 743 809 656 384
2020-03-09 7161 4239 832 928 748 414
2020-03-10 8042 4747 904 991 886 514
2020-03-11 9000 5232 1104 1081 964 619
2020-03-12 10075 5837 1166 1231 1147 694
2020-03-13 11364 6451 1313 1468 1268 864
2020-03-14 12729 7075 1486 1740 1454 974
2020-03-15 13938 7637 1635 1896 1580 1190
2020-03-16 14991 8117 1824 2056 1677 1317
2020-03-17 16169 8683 1942 2259 1811 1474
2020-03-18 17361 9188 2197 2458 1931 1587
2020-03-19 18407 9547 2357 2668 2071 1764
*NR, not reported by the Iranian Government.

Appendix Table 4. Method 1 (February 19 through March 1, 2020): Estimated epidemic growth rate (95% Confidence intervals, CI),
scaling parameter (95% CI) and basic reproduction number obtained via a generalized growth model.
 Location Epidemic growth rate (r, 95% CI) Scaling parameter, p Basic reproduction number (95% CI)
 Iran 0.65 (0.56, 0.75) 0.96 (0.93, 1) 4.4 (3.9, 4.9)
 Region 1 0.55 (0.51, 0.65) 0.99 (0.94, 1) 4.3 (3.8, 4.6)
 Region 2 1.20 (0.58, 2.20) 0.76 (0.52, 1) 3.4 (2.3, 5.0)
 Region 3 3.00 (1.50, 5.00) 0.52 (0.37, 0.69) 2.1 (1.7, 2.7)
 Region 4 0.75 (0.67, 0.96) 0.97 (0.87, 1) 5.8 (4.4, 6.4)
 Region 5 0.83 (0.68, 1.30) 0.94 (0.72, 1) 6.0 (3.8, 7.3)

 Page 6 of 15
Appendix Table 5. Method 2 (February 19 through March 1, and March 6 through 19, 2020): Estimated epidemic doubling time (95% Confidence intervals, CI), epidemic growth rate
(95% CI) and the basic (or effective) reproduction number (95% CI) obtained via Method 2. Epidemic growth rate (r) = ln(2)/doubling time. Reproduction number was calculated based
on equation: R0 = 1 + growth rate × serial interval, assuming serial interval following a gamma distribution with a mean of 4.41 days and a standard deviation of 3.17 days.
 Basic Reproduction Effective Reproduction number
 Estimated epidemic doubling times (95% CI)* Epidemic growth rate (r, 95% CI) number (95% CI) § (95% CI) §
 Location Feb 19 – Mar 1 Mar 6 – 19 Feb 19 – Mar 1 Mar 6 – 19 Feb 19 – Mar 1 Mar 6 – 19
 Iran 1.20 (1.05, 1.45) 5.46 (5.29, 5.65) 0.58 (0.48, 0.66) 0.13 (0.12, 0.13) 3.50 (1.28, 8.14) 1.55 (1.06, 2.57)
 Region 1 1.32 (1.16, 1.61) 6.04 (5.80, 6.29) 0.53 (0.43, 0.60) 0.11 (0.11, 0.12) 3.28 (1.26, 7.59) 1.50 (1.06, 2.42)
 Region 2 1.12 (0.87, 1.59) 5.71 (5.32, 6.04) 0.62 (0.44, 0.80) 0.12 (0.11, 0.13) 3.69 (1.29, 8.84) 1.53 (1.06, 2.50)
 Region 3 1.38 (1.12, 1.78) 6.23 (5.86, 6.51) 0.50 (0.39, 0.62) 0.11 (0.11, 0.12) 3.17 (1.24, 7.24) 1.48 (1.06, 2.37)
 Region 4 1.67 (1.43, 2.30) 5.19 (4.58, 5.79) 0.41 (0.30, 0.49) 0.13 (0.12, 0.15) 2.79 (1.20, 6.15) 1.58 (1.07, 2.65)
 Region 5 1.13 (0.92, 1.61) 3.92 (3.54, 4.32) 0.62 (0.43, 0.75) 0.18 (0.16, 0.20) 3.66 (1.30, 8.79) 1.77 (1.09, 3.19)
*Harmonic mean of the arithmetic means of 10,000 sets of simulated epidemic doubling times.
§Calculated based on the 10,000 arithmetic means of 10000 sets of simulated epidemic doubling times and 10,000 random numbers drawn from a gamma distribution with a mean serial interval of 4.41 days
(SD: 3.17 days).

 Page 7 of 15
Appendix Table 6. Manuscript pre-prints on the COVID-19 epidemic in Iran fit to Iranian official reports available on medRXiv as of April 2, 2020*
 Effective
 medRXiv Iranian official reproduction
 pre-print COVID-19 Basic number after
 version as of reports†: time Other data reproduction social distancing
Papers Apr 2, 2020 range sources Methods number implemented
A. Ahmadi et al., unpub. data, Pre-print February 19 Not applied Logistic differential 4.7 1.75 (Gompertz)
https://www.medrxiv.org/content/10.1101/2020.03.17.20037671v3 version 2 through March equation, Gompertz
 19, 2020 differential equation, Von
 Bertalanffy’s differential
 growth equation, Cubic
 Polynomial Polynomials
N. Ghaffarzadegan et al., unpub. data, Pre-print February 19 Unofficial reports; Compartmental (SEIR) 2.72 (90% CI,
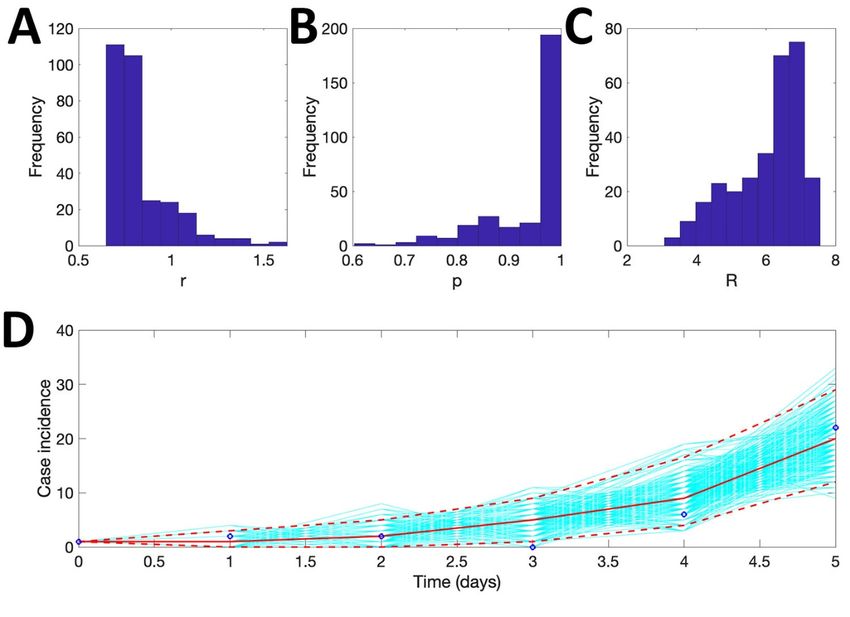
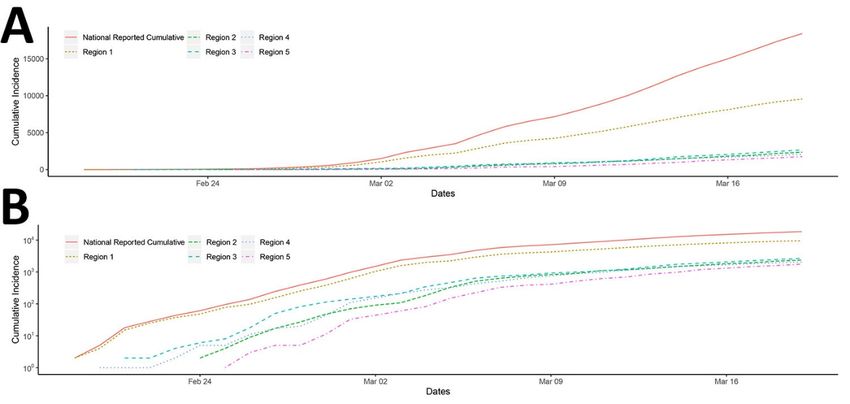
Appendix Figure 1. Cumulative incidence curve of Iran and its Regions 1 to 5. The data for the five
regions on March 2 and 3, 2020 were imputed.

Appendix Figure 2. Method 1: Region 1. The mean basic reproduction number of COVID-19 in Region 1,
Iran, with 95% confidence interval. Estimates for growth rate, r, and the scaling of the growth rate
parameter, p, are also provided. The plot in the lower panel depicts the fit of the Generalized Growth
Model to the Iranian data assuming Poisson error structure as of March 1, 2020.

 Page 9 of 15
Appendix Figure 3. Method 1: Region 2. The mean basic reproduction number of COVID-19 in Region 2,
Iran, with 95% confidence interval. Estimates for growth rate, r, and the scaling of the growth rate
parameter, p, are also provided. The plot in the lower panel depicts the fit of the Generalized Growth
Model to the Iranian data assuming Poisson error structure as of March 1, 2020.

 Page 10 of 15
Appendix Figure 4. Method 1: Region 3. The mean basic reproduction number of COVID-19 in Region 3,
Iran, with 95% confidence interval. Estimates for growth rate, r, and the scaling of the growth rate
parameter, p, are also provided. The plot in the lower panel depicts the fit of the Generalized Growth
Model to the Iranian data assuming Poisson error structure as of March 1, 2020.

 Page 11 of 15
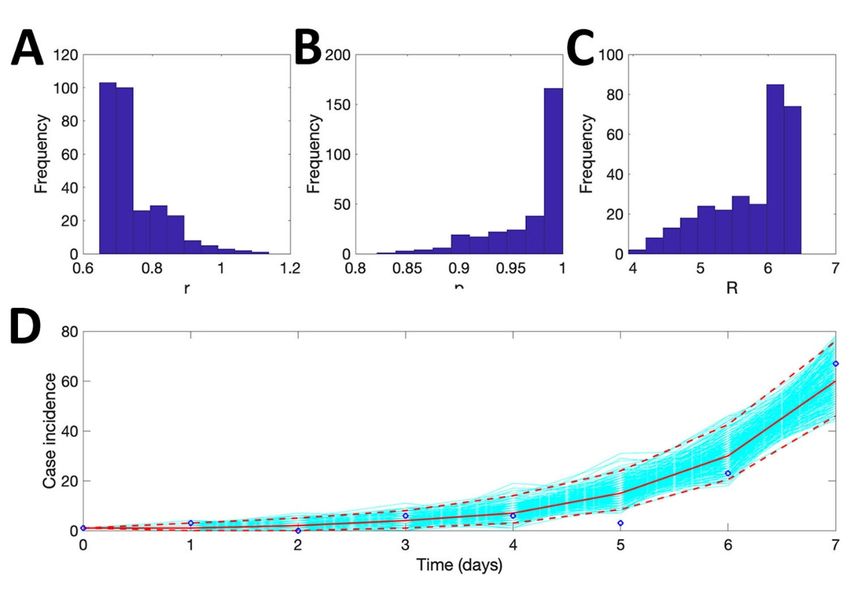
Appendix Figure 5. Method 1: Region 4. The mean basic reproduction number of COVID-19 in Region 4,
Iran, with 95% confidence interval. Estimates for growth rate, r, and the scaling of the growth rate
parameter, p, are also provided. The plot in the lower panel depicts the fit of the Generalized Growth
Model to the Iranian data assuming Poisson error structure as of March 1, 2020.

 Page 12 of 15
Appendix Figure 6. Method 1: Region 5. The mean basic reproduction number of COVID-19 in Region 5,
Iran, with 95% confidence interval. Estimates for growth rate, r, and the scaling of the growth rate
parameter, p, are also provided. The plot in the lower panel depicts the fit of the Generalized Growth
Model to the Iranian data assuming Poisson error structure as of March 1, 2020.

 Page 13 of 15
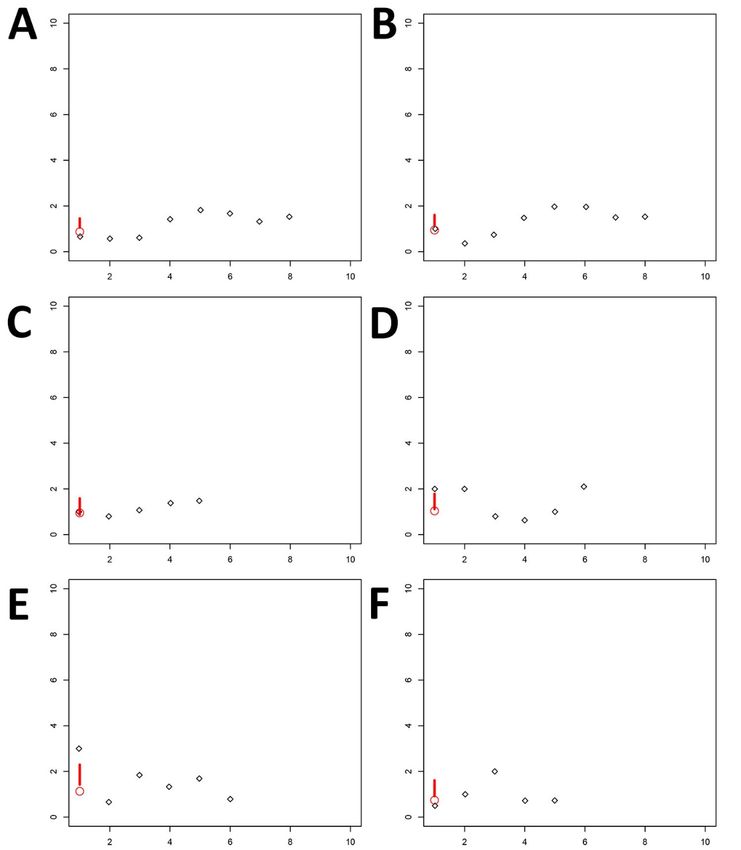
Appendix Figure 7. Method 2: Part 1 (February 19 through March 1, 2020): The COVID-19 epidemic
doubling time (black diamond) and the harmonic mean of the arithmetic means of 10,000 estimates with
95% confidence intervals (circle and bar) of Iran and its five regions.

 Page 14 of 15
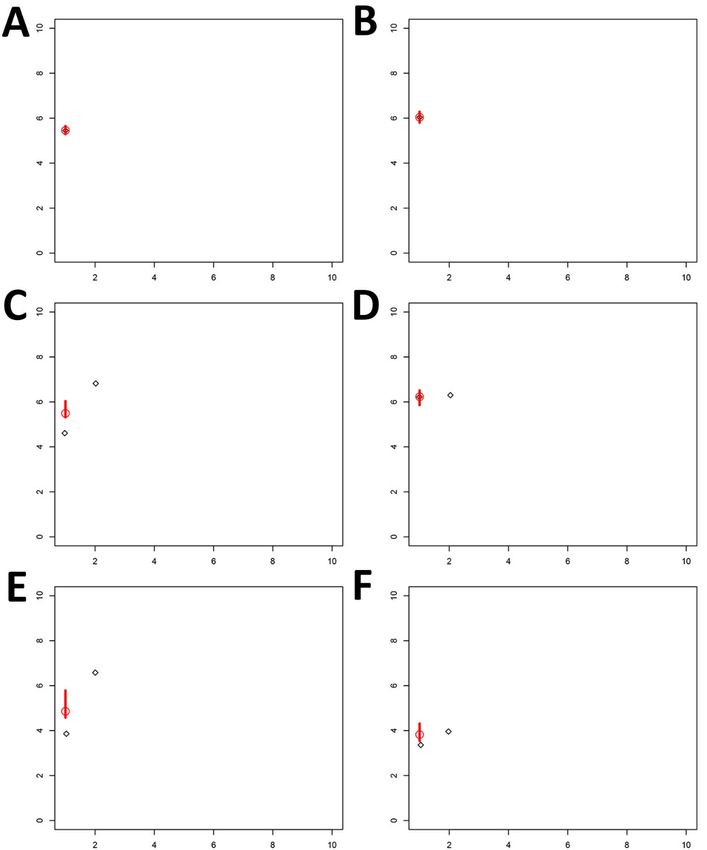
Appendix Figure 8. Method 2: Part 2 (March 6 through 19, 2020): The COVID-19 epidemic doubling time
(black diamond) and the harmonic mean of the arithmetic means of 10,000 estimates with 95%
confidence intervals (circle and bar) of Iran and its five regions.

 Page 15 of 15
You can also read