SEB 7 January, 2020 Frans Rydén, CFO - Cloetta

Page created by Frank Figueroa
 
CONTINUE READING
SEB 7 January, 2020 Frans Rydén, CFO - Cloetta
SEB 7 January, 2020
Frans Rydén, CFO
SEB 7 January, 2020 Frans Rydén, CFO - Cloetta
2

This is Cloetta

                  6.2
SEB 7 January, 2020 Frans Rydén, CFO - Cloetta
3

Cloetta’s strengths
Strong brand/category positions and scale in North Western Europe
        Cloetta’s strategic strengths        Market                 Category position
                                                                                                  Chewing             Pick &
                                                      Candy       Pastilles      Chocolate
                                                                                                    gum                mix

    • Strong leading local brands                       1             1                2                -               1
    • Locally tailored innovation
                                                        2             1                4                1               1
    • Core markets in growing North
      Western Europe                                    1             2                3                -               1
    • Own manufacturing network
                                                        2             1                3                -               1
    • Route to market with own sales force
    • Scale benefits in North Western                   1             -                 -              2                 -
      Europe vs local competition
                                                        -             -                 -               -               1
                                                      Based on Cloetta market share in respective category in 2018.
SEB 7 January, 2020 Frans Rydén, CFO - Cloetta
4

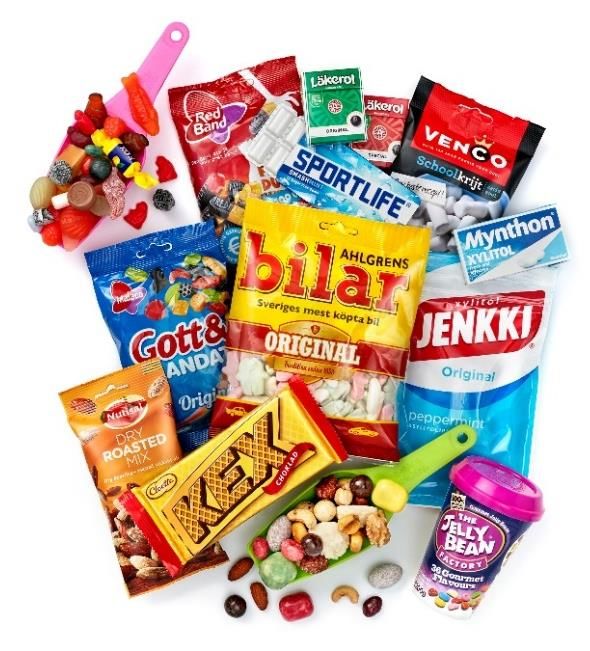
Strong heritage brands liked and trusted
by our consumers
           Local                                   Global

                            Local Global Balance
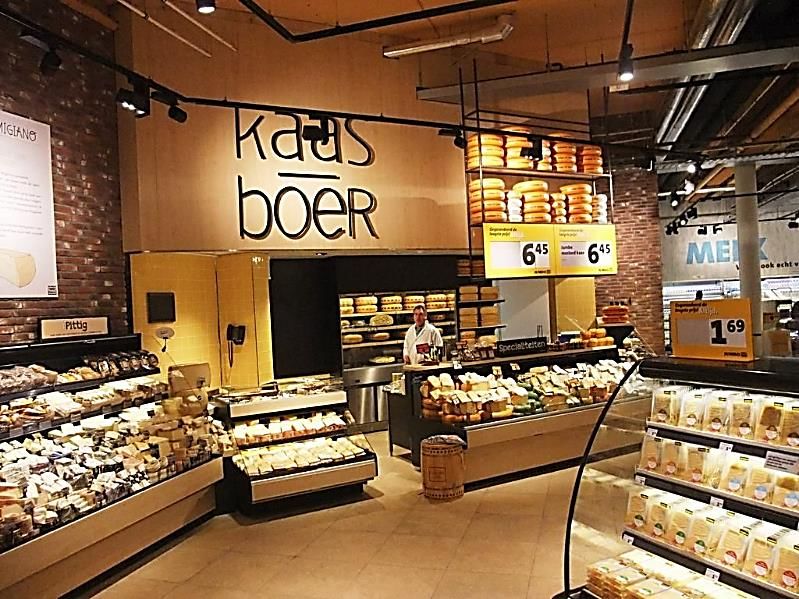
SEB 7 January, 2020 Frans Rydén, CFO - Cloetta
5

Stable growth in branded confectionery market
Value growth aided by premiumization
                                                                                                                                    160 gr
                                                                                                                            Index
                                                                           CAGR 1,6%
        70                                                                                                                   140

        60                                                                                                                   120

        50                                                                                                                   100

SEKbn   40                                                                                                                   80

        30                                                                                                                   60
                                                                                                                                    140 gr
        20                                                                                                                   40

        10                                                                                                                   20

         0                                                                                                                   0
             2006   2007     2008     2009      2010      2011      2012     2013     2014     2015    2016   2017   2018

                                              Total market value*          Index market value growth

                      *Source: Datamonitor/ Mintel
                      Markets: Sweden, Denmark, Norway, Finland and Netherlands
SEB 7 January, 2020 Frans Rydén, CFO - Cloetta
6

Responsible growth
Cloetta offering informed choice for consumer

•   Consumer as boss
•   NAF/NAC
•   Increased resource efficiency
•   Responsible sourcing of raw material (UTZ)
•   Employee development and health
•   Plastic reduction
•   “Choice for you” strategy
SEB 7 January, 2020 Frans Rydén, CFO - Cloetta
7

Focus on core markets and core categories
From acquiring new munchy moment categories to organic growth
SEB 7 January, 2020 Frans Rydén, CFO - Cloetta
8

Cloetta’s Financial Goals:
Organic growth positive YTD, VIP+ plan to deliver EBIT
                                               2017    2018      Targets

                                                                   1-2%
           Organic Growth*                     -1.2%   -2.8%   (In line with
                                                                  market)

           EBIT Margin, Adj                    10.4%   10.9%     ≥ 14%

                 Net Debt /
                  EBITDA
                                                2.4     2.3       ≤ 2.5

            Dividend Policy
                                               54%     60%       40-60%
            (share of profit)

          *Growth at constant exchange rates
SEB 7 January, 2020 Frans Rydén, CFO - Cloetta
9

Continue attractive dividend – doubled in 3 years
                   0,0             0,0               0,0    0,50   0,75    0,75     1,00
Dividend
per share, SEK
         70%

                                                                                     60%    Target
         60%
                                                                    53%     54%             Dividend payout
         50%                                                                                of 40–60 per
                                                                                            cent of profit for
         40%                                                37%                             the period
         30%

         20%

         10%

                      0              0                0
          0%
                    2012           2013              2014   2015    2016    2017*    2018

                 * 2017 excluding special dividend
SEB 7 January, 2020 Frans Rydén, CFO - Cloetta
10

Key Business Priorities
Cloetta to organic growth and 14% operating profit margin, adjusted

                                    •   Packaged sales back to organic growth, EBIT >14%
                  Branded
                                    •   Absolute higher media investments on top of efficiency
                  growth            •   Pricing needed to offset raw materials and FX

                                    •   Price increases implemented on 50% of the contracts in
                  Pick & mix
                                        Sweden: goal is to get to black from – 60 m SEK 2018
             to sustainable value   •   Assortment optimization to reduce complexity & costs

                Reduce costs        •   “Value Improvement Program+” and “Perfect Factory”
                     and            •   Five-year capacity investment plan to improve service
               drive efficiency         levels and fund further growth
11

Branded Growth: Organic growth now a trend
Seventh consecutive quarter of growth in branded packaged products
 Branded, % of Q3 '19 sales
                                                                                                                   3,6%
                                                                 2,4%
                                1,3%                                            1,6%     1,4%              1,4%
                                                                         0,6%                     0,6%

                                                         -0,8%

                                         -3,1%
         73%                                     -4,0%

                                           2017                            2018                            2019
                                 Q1       Q2  Q3         Q4      Q1       Q2  Q3          Q4       Q1       Q2     Q3
Pick & mix, % of Q3 '19 sales                                                                              18,1%

                                         10,5%
                                                         7,8%
                                                                                                                   6,4%
                 27%
                                                 1,5%

                                                                 -3,3%

                                                                                                  -11,4%
                                                                                         -13,5%
                                -18,1%                                   -19,4% -15,6%
12
12

     Pick & Mix to Sustainable Value
     Short term plan (by year-end 2020)
     • Turn around EBIT in pick & mix in Sweden from ~SEK
       -60m in 2018 to average pick & mix EBIT
     • Contract and price models being re-developed
     • Reduce distribution cost in Sweden
     • Continue to insource Candyking volumes
     • Drive merchandising efficiency
     • Optimize assortment
13

Pick & Mix to Sustainable Value
Medium term plan

• Drive penetration in Finland, Denmark, Norway
  and the UK
• Develop pick & mix category and brand offering
• Develop concepts to fit all markets
• Create “Shop in Shop” concept to increase value
• E-commerce:
    – Scale e-commerce
    – ‘In-store theatre’ needs
14

Reduce Cost and Drive Efficiency
Cloetta Leading Performance Program launched in 2019
The Perfect Factory programme creates
- Repeatable lines
- Measurable lines
- Capable lines
- Competent employees.
15

Reduce Cost and Drive Efficiency
Invest to Grow: Capacity investments ongoing

• 10% capacity increase in moulding technology

• Additional capacity will support
   – Growth in branded packaged products
   – Realization of additional Candyking synergies (insourcing)
   – Insourcing of volumes produced in previously Cloetta-owned Italian plants

• Investment approximately SEK 100m will debottleneck current lines in Turnhout and Levice

• New capacity will be available from mid-2020
16

  Reduce Cost and Drive Efficiency:
  Well-stocked road-map to deliver targeted 14% EBIT margin, adjusted

EBIT margin,
adjusted, %

                                                                       ONE Cloetta
                                                            Reduce      and other
                                                           indirects    programs
                                             Perfect      using ZBB
                                                                                     ≥ 14,0%
                                             Factory
                         Pick & mix
                          portfolio
               Branded
               growth
  10,9%
                                      Value Improvement Program+

   2018                                                                              Mid-term
17

“Navigating a Peak in the Business Cycle”
Cloetta in stable category/market, yet we keep reinventing ourselves
          Point of Departure            Working with Uncertainty

   2008               • Non-cyclical               • Professional approach to
                        category                     white-space markets
                      • North Western              • Capital deployment and
                        Europe                       acquisition strategy

                      • Strong                     • Choice that puts
                         heritage                    consumers first
                         consumer                  • Opportunities in
                         brands                      changing retail

                                                   • Agile manufacturing
                                                   • Cost concious culture
Core Strategy: Organic growth and 14% EBIT
Commercial focus on our brands whilst increasing cost consciousness

                 From                         To            Healthy

Topline
          Acquisition growth            Organic growth       1-2%

Bottom     Margins through
line                                    Organic margin
            synergies and
                                          expansion          14%
            restructuring
19

Q&A
20

Appendix
21

Group Management: New Team, relevant experience

          Unilever                 Mondelez                           L’Oreal
                                                     Cloetta                              Perfetti van Melle

Cloetta              Kraft Heinz              Mars             Mars             Cloetta                 Unilever
22

Cloetta’s Core Strategy
“To bring a smile to your Munchy Moments”

               • Strengthen the equity of our core                                                                       • Drive cost saving activities –

                                                     Facilitate growth
               brands                                                    • Zero tolerance for accidents                  ”VIP+”
Drive growth

                                                                                                           Fund growth
               • Focus on core categories and                            • Create “One Cloetta”                          • Embed ”Perfect Factory” and
               core markets, double international                        • Strengthen brand and category                 Lean in the supply chain

               • Fewer and stronger innovations to                       management competence                           • Insource production
               drive valorization                                        • CSR to drive consumer agenda                  • Improve profitability in pick &
               • Create value concepts and                               • Create a winning culture                      mix
               penetration in pick & mix
                                                                         • Develop, attract and retain                   • Improve marketing efficiency
               • Selective acquisitions on core                          skilled leaders and employees                   and internal systems and
               categories and markets                                                                                    processes

                         Target: Organic Sales growth in line with market and EBIT margin, adjusted – at least 14%
23

Sales growth historically driven by acquisitions
Shift to organic growth with selective acquisitions on top
                                                                                                                6,2

 SEKbn                                                                                               0,5

                                   0,1              0,3                               1,1
                 0,2                                                  -0,7
    4,9

   2012   Nutisal acquisition   Jelly Bean    Lonka acquisition   Italy Disposal   Candyking     Forex, Other   2018
                                acquisition                                        acquisition
                2014              2014              2015             2017            2017        2012-2018
24

Track record of margin gains through
restructuring and synergies
                                         Synergies and factory                                       Candyking margin
                                       restructuring from Cloetta                                   dilution, unfavorable
                                             LEAF merger                                            FX, production cost
SEKm
800
                                                                                     690                  695                          677     Margin
700
                                                           632
                                 585                                                                                             604           17,0%
600

500    432
                                                                                                                                                      14,0% Target
                                                                                                                                               13,0%
400                                                                                                      13,6%
                               12,0%                     11,9%                     12,2%
300
                                                                                                                                       10,9%
                                                                                                                             10,4%             9,0%
200
       8,9%
100

  0                                                                                                 *                                          5,0%
       2012                     2013                      2014                     2015                  2016                2017      2018
                                                Operating profit, adjusted                   Operating profit margin, adjusted
              *From 2016 and onwards, Italy is discontinued operations and excluded from result
25

Core Strategy: Organic growth and 14% EBIT
From acquisition growth to organic growth
                                                                                      2018: Shift to organic
                                                                                      growth
                                                                                      • Consumer as boss
                                                         2017: Structure change       • New management
                                                         • Disposal of Italy          • ONE Cloetta
                                                         • Acquisition Candyking      • Organic growth
                                                         • Overload moulded factory   • Sharpened strategy on the
                           2014: Harmonization                                          road to 14%
                                                           network
                           • One ERP system
                           • Factory rationalization &
2012: New company            LEAN
• Merger Cloetta-LEAF      • Smaller acquisitions
• Listed on Stock market
• HQ in Stockholm
26

Value Improvement Program Plus:
Holistic and company-wide program to safeguard delivery of the road to 14%

One program for value-creating initiatives, using industry-leading practices and
grounded in Zero Based Budgeting principles, launched in Q1 2019.
• Transparency to confirm effort and money is spent where it matters the most to deliver
  profitable growth and targeted EBIT
• Accountability for building blocks, with overlaps managed and no drill-sites missed
• Rigor in tracking of actuals and fulfillment of commitments

To help kick-start reduction of indirect spend in SG&A and Operations, Cloetta engaged
Accenture for spend analysis and value targeting including benchmarking and best practices
27

        Solid cash flow and healthy leverage
        Cash flow                                                                                                           Net debt/EBITDA ratio, x
        SEKm
1 000                                                          927                                                          6
                                                                           889
 900
                                                                     813                                  792                      4,9
                                                                                                                            5
 800
                                                         697                                712                                           4,2
 700                                                                                                                                             4,0
                                                                                                                628         4
 600                                                                                  532
                                        492 500                                                                                                         3,0
 500                                                                                                                        3
                       408                                                                                                                                     2,4    2,4         2,3
                                                                                                                      Target 2,5
 400          330
                                                                                                                            2
 300
 200    157                  131                                                                                            1
 100
   0                                                                                                                        0
         2012           2013              2014             2015       2016              2017              2018                     2012   2013   2014   2015   2016   2017        2018
          Cashflow from Operating activities, before changes in WC   Cashflow from Operating activities
28

Capital allocation principles
Supports growth and continues to prioritize dividends
                      •   Increased investments in working media to fuel branded growth
  Invest for growth   •   Investment in production capabilities for growth and future insourcing

                      •   Maintaining attractive dividend target of 40-60% of profit for the period
     Dividends        •   Maintaining attractive dividend target of 40-60% of profit for the period

                      •   Footprint in existing core geographies and categories of Cloetta
   Targeted M&A
                      •   Clear objective of synergy realization and solid financial returns

                      •   Keep stable debt ratio in line with target to maintain flexibility for M&A
 Repayment of debt
29

     Cash Flow supports temporary step-up in CAPEX
     in 2019-2020 including Candyking insourcing
CAPEX/
Deprecation ratio   1,6                    1,2                   0,9                    0,7                   0,8            0,7      0,8

                                                                                                       Temporary step-up, including
            350      5,5%                                                                                announced Candyking                             6,0%
                                                                                                          integration CAPEX*
            300                                                                                                                                          5,0%
                                           4,3%                                                                                                ~5,0%
            250       269
                                                                  3,5%                                                                                   4,0%
                                                                                                             3,3%
            200                             211                                                                                       3,0%
                                                                                        2,8%                                  2,7%              3,5%
                                                                   186                                                                 184               3,0%
            150                                                                          161                  170
                                                                                                                               157
                                                                                                                                                         2,0%
            100

             50                                                                                                                                          1,0%

              0                                                                                                                                          0,0%
                    2012                   2013                  2014                   2015                 2016             2017    2018     2019
                                                                                                                                             2019-2020
                                                                                               CAPEX       CAPEX/Sales

                    *Part of the previously announced Candyking integration cost of SEK 175m
31

Pick & mix – this is how it works
Service concept not only selling individual products and brands
                                Selling services

         Assortment                       Fixtures                    Merchandisers
   •   Wide range of products    •   Play an important role in   •   Fill up products into
   •   Consumer preferences          a successful pick & mix         fixtures
       vary by market                concept:                    •   Keep fixtures fresh and
   •   Mainly products from            ‒ Branding                    clean
       candy and chocolate                perspective +
       categories                      ‒ How products are
                                          displayed
32

Pick & mix strengths

► Geographical spread
                                                                 Norway               Finland
• Very strong position in the Nordic countries                   23%                  17%
• High share of total confectionary consumption   UK                         Sweden

                                                  1%       Denmark           30%
► Consumer trend: Individualization                        10%
• Pick & mix concept catering to consumers
  seeking to satisfy individual needs
• Consumers choosing products and services
  individually

                                                   Pick & mix share of confectionery market volume
33

Cloetta’s pick & mix sales by market
                                        Norway              Finland
                                        6%                  18 %
                                                   Sweden

                                      Denmark     38 %
                                      16 %
                             The UK

                             17 %

                                                  Other
                                                 markets

                                                 5%
34

Four pick & mix business models
                                                                   Bulk
• Full concept covers everything from branding,                    24%

  assortment and fixtures to merchandising
• Trade own concept is similar to full concept but with                   Business
                                                                                     Full concept
                                                                                          55%
  a retailers own branding                                Hybrid           models
                                                           7%
• In Hybrid models e.g. merchandising can be
  handled by the customer themselves
                                                           Trade own
• Bulk business is products sold to someone else’s            14%
  pick & mix solution
35

Offering consumers the choice

                                Functional &
 Indulgence                     conscious
                                23 % of Sales
36

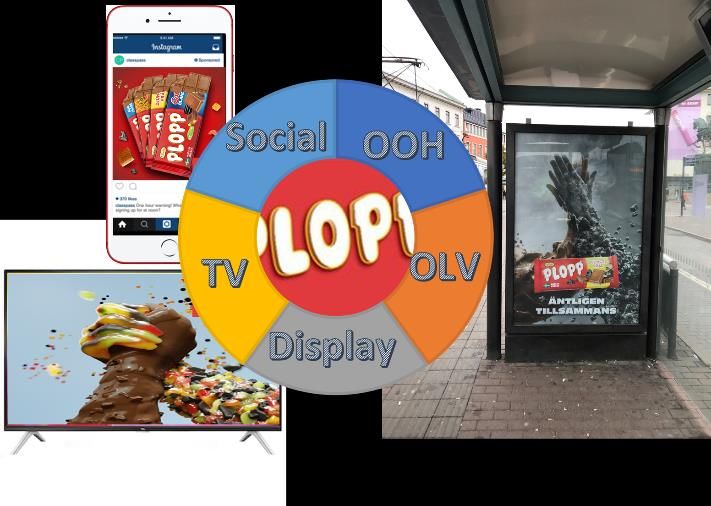
Accelerate Marketing Return On Investment
Step 1: make 70% of marketing                                                Step 2: Maximize effective pure media
spend visible to consumer                                                    70% (boost hard, measure fast)

          60%                                       60%
                        55%

                                 45%
   40%                                                         40%

     2017                   2018                         2019*
     Working Media %   Non-Working Media %        Linear (Working Media %)

                                             * Ambition for 2019
                                                                                                *Nielsen 2018, Sweden
37

Creating Centers of Excellence
Volume and technologies in 2018, tonnes
                       Nuts
         The Jelly Bean Factory

                Gum, Lozenges & Hard boiled

                                                Moulding, Extrusion, Hard boiled pastilles
    Toffees, Fudge, Nougat

        Moulding

        Moulding                              Moulded Foam, Chocolate
                                              Moulding & enrobing
38

Cost structure 2018
39

Disclaimer

•   This presentation has been prepared by Cloetta AB (publ) (the “Company”) solely for use at this presentation and is furnished to you solely for your information and may
    not be reproduced or redistributed, in whole or in part, to any other person. The presentation does not constitute an invitation or offer to acquire, purchase or subscribe for
    securities. By attending the meeting where this presentation is made, or by reading the presentation slides, you agree to be bound by the following limitations.
•   This presentation is not for presentation or transmission into the United States or to any U.S. person, as that term is defined under Regulation S promulgated under the
    Securities Act of 1933, as amended.
•   This presentation contains various forward-looking statements that reflect management’s current views with respect to future events and financial and operational
    performance. The words “believe,” “expect,” “anticipate,” “intend,” “may,” “plan,” “estimate,” “should,” “could,” “aim,” “target,” “might,” or, in each case, their negative, or
    similar expressions identify certain of these forward-looking statements. Others can be identified from the context in which the statements are made. These forward-looking
    statements involve known and unknown risks, uncertainties and other factors, which are in some cases beyond the Company’s control and may cause actual results or
    performance to differ materially from those expressed or implied from such forward-looking statements. These risks include but are not limited to the Company’s ability to
    operate profitably, maintain its competitive position, to promote and improve its reputation and the awareness of the brands in its portfolio, to successfully operate its
    growth strategy and the impact of changes in pricing policies, political and regulatory developments in the markets in which the Company operates, and other risks.
•   The information and opinions contained in this document are provided as at the date of this presentation and are subject to change without notice.
•   No representation or warranty (expressed or implied) is made as to, and no reliance should be placed on, the fairness, accuracy or completeness of the information
    contained herein. Accordingly, none of the Company, or any of its principal shareholders or subsidiary undertakings or any of such person’s officers or employees accepts
    any liability whatsoever arising directly or indirectly from the use of this document.
You can also read