FY2017 RESULTS ANNOUNCEMENT CORPORATE PRESENTATION! - 13 March 2018 ! LY CORPORATION LIMITED!

Page created by June Horton
 
CONTINUE READING
FY2017 RESULTS ANNOUNCEMENT CORPORATE PRESENTATION! - 13 March 2018 ! LY CORPORATION LIMITED!
FY2017 RESULTS ANNOUNCEMENT
     LY CORPORATION LIMITED                           !           CORPORATE PRESENTATION!
         Company Registration Number: 201629154K!
(Incorporated in the Republic of Singapore on 24 October 2016)!   13 March 2018 !
                                                                  !
FY2017 RESULTS ANNOUNCEMENT CORPORATE PRESENTATION! - 13 March 2018 ! LY CORPORATION LIMITED!
IMPORTANT NOTICE!                                                                                                                                 01!

LY Corporation Limited (“’the Company”’) was listed on the Catalist of the Singapore Exchange Securities Trading Limited ( the “’SGX-ST”’) on 31 January 2018.
The Initial public offering of the Company was sponsored by UOB KayHian Private Limited ( the “’Sponsor””).!
!
The presentation has been prepared by the Company and its contents have been reviewed by the Sponsor for compliance with the SGX-ST Listing Manual
Section B: Rules of Catalist. The Sponsor has not verified the contents of the presentation.!
!
The presentation has not been examined or approved by the SGX-ST. The Sponsor and SGX-ST assume no responsibility for the contents of this presentation,
including the accuracy, completeness and correctness of any of the information, statement or opinions made or reports contained in this presentation.!
!
The contact person for the Sponsor is Mr Lan Kang Ming, Vice President, at 8 Anthony Road, #01-01,Singapore 229957, telephone (65) 6590 6881.!
!
!
FY2017 RESULTS ANNOUNCEMENT CORPORATE PRESENTATION! - 13 March 2018 ! LY CORPORATION LIMITED!
CONTENTS!                         02!

1. First New Listco in SGX in 2018

2. Competitive Strengths

3. Financial Highlights

4. Investment Highlights

5. Prospects & Future Plans
FY2017 RESULTS ANNOUNCEMENT CORPORATE PRESENTATION! - 13 March 2018 ! LY CORPORATION LIMITED!
FIRST NEW LISTCO in SGX in 2018
FY2017 RESULTS ANNOUNCEMENT CORPORATE PRESENTATION! - 13 March 2018 ! LY CORPORATION LIMITED!
ESTABLISHED FURNITURE!                                                                                                       04!
MANUFACTURER LISTED ON
CATALIST in 2018!
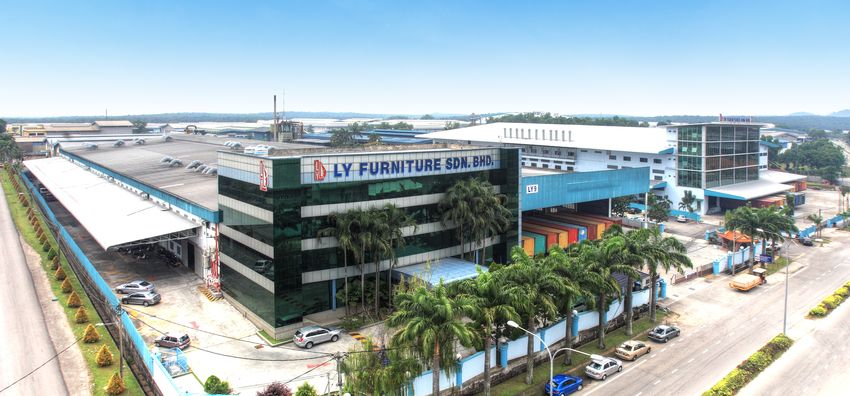
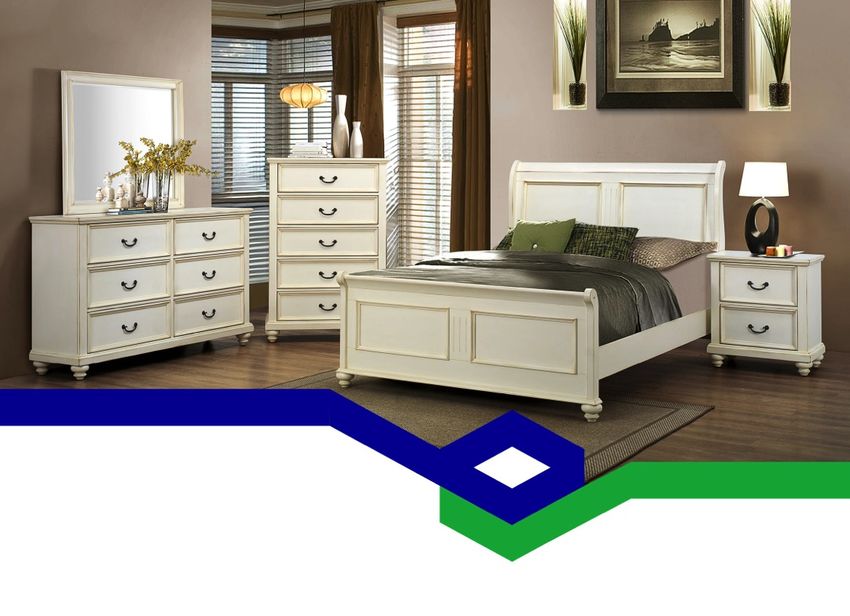
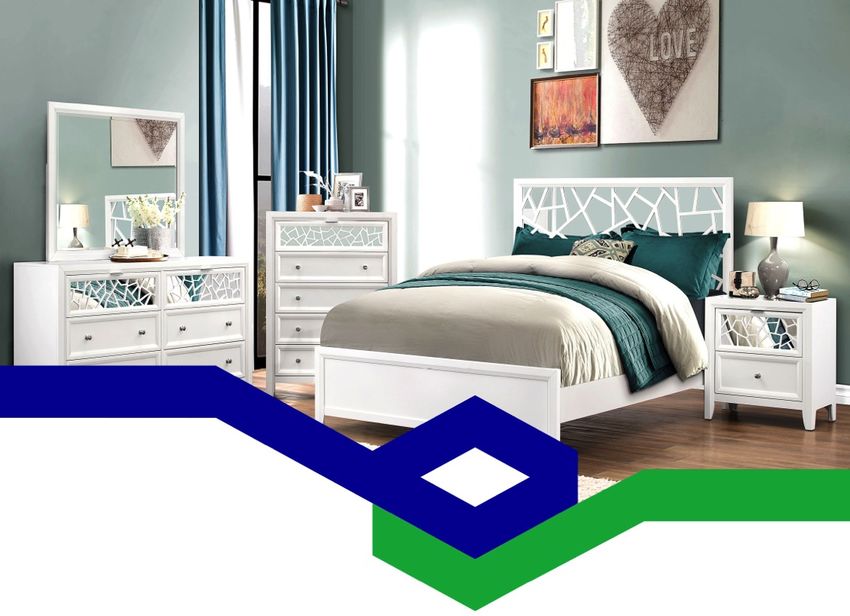
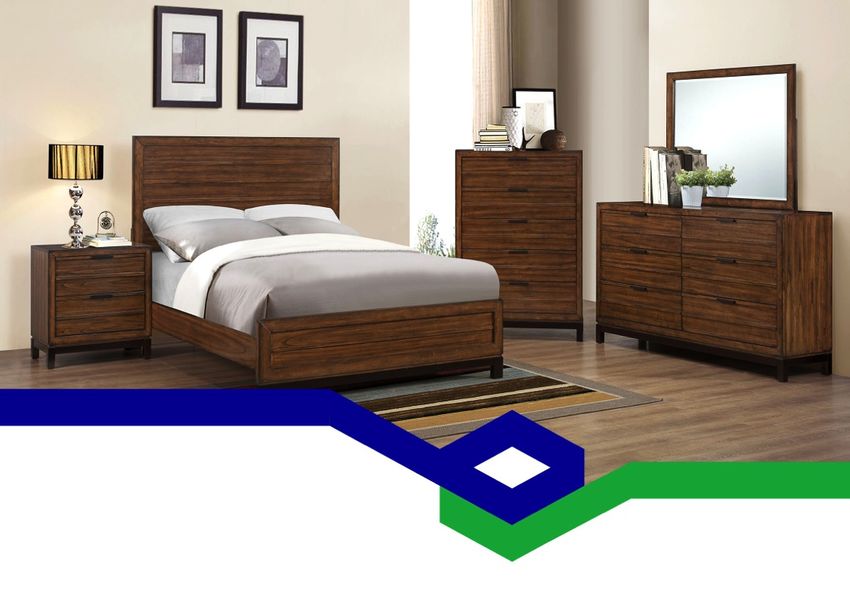
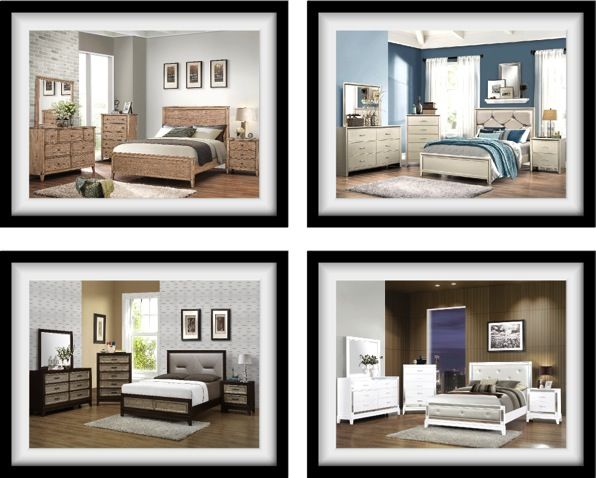
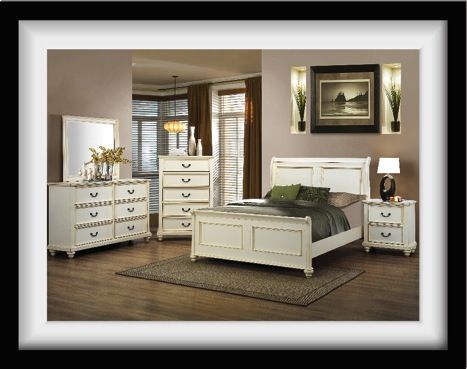
                     One of Malaysia’s leading manufacturers and exporters !
                                 of wooden bedroom furniture!
                                               !

     Track record of approximately 40 years of experience in the furniture industry!

                     An established Original Design Manufacturer (“ODM”) and
                            Original Equipment Manufacturer (“OEM”)!

    Market share of 9% in Malaysia’s wooden bedroom furniture export segment in 2016!

         As at 15 December 2017, we operate from 15 factories and warehouses,
           occupying a combined built-up area of approximately 1.4 million sq ft!

                     Annual production capacity (40-ft containers) in FY2016: 8,400!
                 Annual production capacity in FY2016: 8,400 (40-ft containers) !

     Source: !“Wood Furniture Manufacturing for Export in Malaysia” by Converging Knowledge Pte Ltd dated 19 October 2017!
FY2017 RESULTS ANNOUNCEMENT CORPORATE PRESENTATION! - 13 March 2018 ! LY CORPORATION LIMITED!
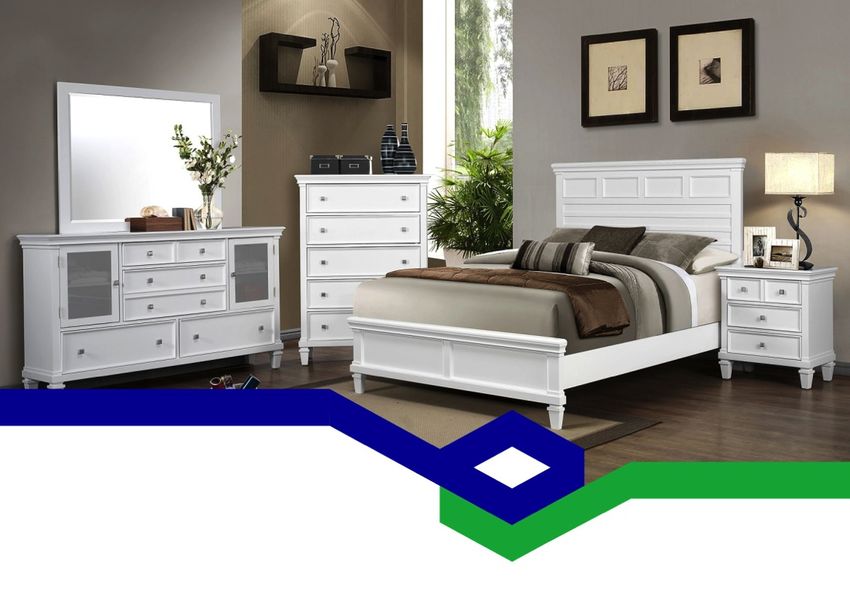
PROGRESSIVE GROWTH!                                                                                                                  05!

The Group was founded by     Made its first foray into     Identified opportunity to      Began the construction   Collaborated with a software            Publicly-listed
our Executive Chairman and   the export market with        enter into the U.S. market     of a factory equipped    company and began implementing          on the SGX
four other partners, and     its first order for export    due to favourable exchange     with additional spray    an integrated real-time monitoring      Catalist board
started selling customized   to the Singapore              rate during the financial      painting facilities!     and management system (LY-6M            in Singapore!
wooden home furniture in     market!                       crisis. Clinched first order                            system)!
Johor, Malaysia!                                           for export to the U.S.!

       1976                       1987                          1998                         2006                  2014/15                                   2018

                   1985                            1994                        1999                        2010                         2016

   Identified potential in the        Began its foray into other       Began building subcontractor    Set up a new factory with built-up   Completed acquisition
   bedroom furniture market in        international markets. !         network to support various      area of approximately 228, 479 sq    of a piece of leasehold
   Malaysia and began                 That year, the Group also        production processes!           ft complete with two automated       industrial land covering
   designing bedroom furniture        commenced construction of a                                      finishing line facilities spanning   an approximate area of
   sets for mass production!
                                      larger factory with a built-up                                   three storeys, increasing our        5.9 acres!
                                      area of approximately 45,000                                     production capacity by
                                      sq ft!                                                           approximately 60%!
FY2017 RESULTS ANNOUNCEMENT CORPORATE PRESENTATION! - 13 March 2018 ! LY CORPORATION LIMITED!
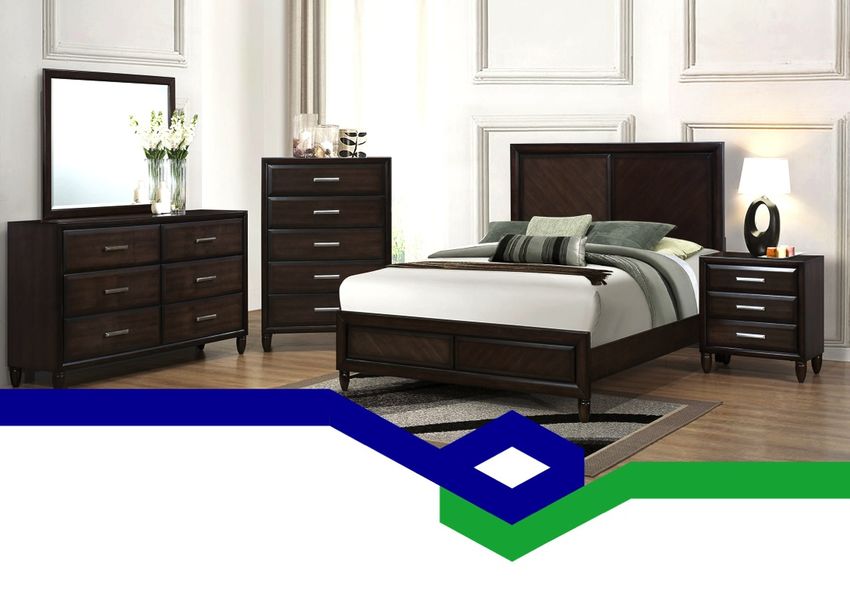
06!
GLOBAL REACH!

  EXPORT SALES
The Group’s products are sold
mainly to overseas dealers
such as furniture wholesalers
and retailers who generally
resell our products to end-
users through their respective
retail networks.!

DOMESTIC SALES

 Primarily third party agents who
 typically export and resell the
 Group’s products outside
 Malaysia, such as to the U.S.!
FY2017 RESULTS ANNOUNCEMENT CORPORATE PRESENTATION! - 13 March 2018 ! LY CORPORATION LIMITED!
AWARDS, ACCREDITATIONS                                                                                07!
AND CERTIFICATIONS!

 Year of Award                                              Award!
                 • Enterprise 50 Award (3rd Place ) !
 2002!
                 • Asia Pacific International Honesty Enterprise – Keris Award 2002!
                 • Global Top Enterprise Golden Rim Award!
 2003!           • Golden Bull Award for Malaysia’s 100 Outstanding SMEs (2nd Place)!
                 • Enterprise 50 Award (2nd Place)!
                 • ISO 9001:2000 for quality system related to manufacturing and trading of wooden made
 2004!
                   furniture!
 2006!           • Best Performing Company Award 2005!
                 • ISO 9001:2008 for the quality management system related to the manufacture of wooden
                   furniture!
 2008!
                 • ISO 9001:2008 for the quality management system applicable to the manufacture of
                   wooden furniture!
                 • Asian Furniture Leadership Award!
 2009!
                 • Corporate Social Responsibility Award!

 2013!           • Award of Industrial Excellence in the category of Furniture Factory!

 2015!           • Eminent Eagle Award (No Placement)!

 2016!           • Eminent Eagle Award (2nd Place)!
FY2017 RESULTS ANNOUNCEMENT CORPORATE PRESENTATION! - 13 March 2018 ! LY CORPORATION LIMITED!
COMPETITIVE STRENGTHS!
FY2017 RESULTS ANNOUNCEMENT CORPORATE PRESENTATION! - 13 March 2018 ! LY CORPORATION LIMITED!
COMPETITIVE STRENGTHS!                                           09!

1. Established track record in the furniture industry and well
   recognised for the quality of our furniture products!

                                                                    Core!
                                             Repeat !
  Track record !                                               competencies !
                       Long-standing        business !
of approximately !                                           in customisation, !
                     relationships with   accounted for !
    40 years in !                                               design and
                         customers!          > 80% !
   the furniture                                                manufacture!
                         and agents!       of FY2016 !
     industry!                                                   of wooden !
                                            revenue!
                                                                  furniture!
COMPETITIVE STRENGTHS!                                                10!

2. Strong in-house design and development capabilities!
   to cater to the requirements of our customers!
       In-house design team recruited based on stringent criteria,
       including market and industry knowledge and design skills!
       Aim to continually introduce unique and innovative designs
       which appeal to consumers!
       Constantly strive to improve products, product range and production
       processes to keep up with trends and developments in the market
       and stay competitive!

  Market                                                        Industry!
knowledge!                                                     knowledge!!

             Design !
              skills!
COMPETITIVE STRENGTHS!                                                                     11!

3.   Established subcontractor network!
       As at 15 December 2017, we work with 19 subcontractors,
       some of which have worked with us for more than 10 years!

                                   Reduces manpower reliance and costs!

                                   Supports various production processes!

  Established
 subcontractor                    Bulk purchases of raw materials required !
   network!                            by us and our subcontractors – !
                                 cost efficiencies and able to control quality !
        !                                    of raw materials used!

                                     Close proximity with our subcontractors –!
                           shorten transportation time of our semi-finished goods to and
                             from our subcontractors and ourselves, and allow close
                                 monitoring of product quality and work progress!
COMPETITIVE STRENGTHS!                                                              12!

4. ! Consistently strive to be cost-competitive, efficient and to turn
    around products quickly!

                                  educes manpower reliance and costs!

                                                                          Implementing !
        Maintaining !              Incorporating                     a real-time integrated !
       sufficient raw !           automation into                            process!
          material !                 production !                         management !
        inventories!                 processes!                          system (LY-6M
                                  Cost efficiencies from bulk purchases ! system)!
                                              of raw materials!

                                 Close proximity with our subcontractors!
                            shorten transportation time closely monitor quality!
COMPETITIVE STRENGTHS!                                                                              13!

  5.    Experienced and committed management team!
          The Group is led by a capable and experienced management
          team, helmed by our Executive Chairman!

                                          Executive Directors!
                                                  educes manpower reliance and costs!

       Mr Tan Kwee Chai!                    Mr Tan Yong Chuan!                     Ms Tan Ai Luang!
         Executive Chairman                 Executive Director and CEO               Executive Director
• One of the Group’s founders!         • Responsible for the overall        • Responsible for the sales and
                                         management, operations and           marketing activities of the Group,
• Approximately 40 years of              strategic planning of the Group!     including overseeing the prototype
  experience and in-depth knowledge                                           and industrial engineering,
  of the furniture manufacturing and                                          purchasing and procurement and
  design industry!                                                            exporting and shipping
                                                                              departments
• Responsible for overall
  management and operations
COMPETITIVE STRENGTHS!                                                                              14!

    5.     Experienced and committed management team!

                                          Executive Officers!
                                                 educes manpower reliance and costs!

         Mr Tan Kwee Lim!                    Mr Boo Ngek Hee!                      Ms Teo Gin Lian!
         Chief Operating Officer             Chief Quality Controller             Chief Financial Officer
• One of the Group’s founders!       • One of the Group’s founders!       •   Responsible for overseeing the
                                                                              financial reporting and accounting
• More than 30 years of experience   • More than 30 years of experience       as well as corporate matters of
  in the furniture industry!           in the furniture industry!             the Group

• Responsible for overseeing the • Responsible for the quality control
  Group’s general operations, in   and assurance process of the
  particular, the production and   Group!
  procurement processes!
INVESTMENT HIGHLIGHTS!
INVESTMENT HIGHLIGHTS!                                                                                                   16!

•   One of the leading Malaysian wooden furniture manufacturers. !
    Among the major Malaysian wooden bedroom furniture manufacturing:!
       1st in the net profit margin for FY2015 to FY2016!
       2nd in CAGR of after tax profit for FY2014 to FY2016!
       3rd in CAGR of revenue for FY2014 to FY2016!
       9.0% of market share of Malaysia’s wooden bedroom furniture export segment!

!   (Source: Wood Furniture Manufacturing for Export in Malaysia” by Converging Knowledge Pte Ltd dated 19 October 2017 )!

• Developed an integrated real-time monitoring and management system (“LY-6M
  system”) with a software company!
       Monitors the entire production process and is expected to significantly enhance our productivity and
       efficiency!

• Tax incentives from the Malaysian Investment Development Authority!
    Received approval from the Malaysian government for our applica7on to receive:
     (i)    Full income tax exemp7on on value-added income for five (5) years on Services and Trading income commencing
            on the 2018 year of assessment, and
     (i)    Extended income tax exemp7on on value-added income for five (5) years on the Services and Trading Income
            commencing on the 2023 year of assessment, subject to the terms of the leLer issued by the MIDA on 25 August
            2017.!
17!
    DIVIDEND POLICY!

•   Intend to recommend and distribute a special
    dividend for FY2017, representing a payout
    per share equivalent to 3.0% of the Placement
    Price, to be approved at a general meeting to
    be held within 3 months after Listing!

•   Subject to the above, our Directors intend to
    recommend and distribute dividends of not
    less than 40.0% of our net profits after tax
    attributable to our shareholders in respect of
    each of FY2018, FY2019 and FY2020*!
•   We intend to recommend and distribute a
    special dividend of S$0.0078 per share for
    FY2017, subject to shareholders’ approval at
    our upcoming annual general meeting!

     *Please note that these statements are merely statements of our present inten7on and shall not cons7tute legally binding
     statements in respect of our future dividends which may be subject to modifica7on (including reduc7on or non-declara7on
     thereof) at our Directors’ sole and absolute discre7on. Please refer to the sec7on en7tled “Dividend Policy” of the Offer Document
     for further details. Average dividend payout ra7o between FY2014 and FY2016 was 43.8%. !
     !
FINANCIAL HIGHLIGHTS!
FINANCIAL HIGHLIGHTS!                                                              19!

                                                  Audited!                   Unaudited!

                                                                                    Change!
    (RM’000)!                          FY2014!    FY2015!    FY2016!     2017!     ( FY2017
                                                                                   vs 2016)!

    Revenue!                           216,036!   313,569!   287,379!   350,644!     22.0%!

    Gross profit!                      35,731!     88,085!   74,876!    87,709!      17.1%!

    Gross profit margin!               16.5%!      28.1%!    26.1%!     25.0%!       (1.1%)!

    Profit before tax!                 22,327!     67,464!   56,314!    64,386!      14.3%!

    Profit for the year attributable
                                       17,336!     52,656!   43,446!    51,171!      17.8%!
    to owners of the Company!
FINANCIAL HIGHLIGHTS!                                                                                                                          20!

                                         Audited!                                 Unaudited!                                            Audited!                       Unaudited!

 (RM’000)!               FY2014!         FY2015!             FY2016!             FY2017!                                 FY2014!        FY2015!          FY2016!       FY2017!
 Malaysia!                32,099        ! 47,255!             38,410!             35,577!      Number of 40-ft
                                                                                                                          4,905!        5,923!           5,637!         6,620!
                                                                                               containers sold!
 United States of
                         181,104!        249,743!            221,897!            284,858!
 America!                                                                                      Average Selling
 Others!                  2,833!          16,571!             27,072!             30,209!      Price per 40-ft              44!           53!              51!            53!
                                                                                               container (RM’000)!
 Total!                  216,036!        313,569!            287,379!            350,644!
                         Revenue by Geography!                                                                    Number of 40-ft Containers Sold!
                                                                                                                                                                              (RM’000)!
                                                                RM350.6m!                      7’000!                                                        6,620 !

                             RM313.6m!                                  8.6%!                                                                                                   65!
                                             RM287.4m!                                                                   5,923!
                                  5.3%!                                                        6’000!                                     5,637!
300,000! CAGR: 15.3%!               15.1%!           9.4%!
                                                                        10.2%!
                                                                                                                                                                                60!
               RM216.0m!                                                                                 4,905!
250,000!                                             13.4%!                                    5’000!
                    1.3%!                                                                                                                                  53!
                                                                                                                                  53!              51!                          55!
                    14.9%!
200,000!                            79.6%!                              81.2%!                 4’000!
                                                                                                               44!                                                              50!
                                                     77.2%!
150,000!                                                                                       3’000!
                    83.8%!
                                                                                                                                                                                45!
100,000!                                                                                       2’000!
                                                                                                                                                                                40!
 50,000!                                                                                       1’000!
                                                                                                                                                                                35!

     -!                                                                                            0!                                                                           30!
               FY2014!       FY2015!         FY2016!             FY2017!                                FY2014!          FY2015!         FY2016!            FY2017!

                     United States of               Malaysia!                   Others!
                     America (U.S.)!
                                                                                                          Number of containers sold!        Average Selling Price per 40-ft
                                                                                                                                            container (RM’000)!
FINANCIAL HIGHLIGHTS!                                                                                                                  21!

                                         Audited!                          Unaudited!                                         Audited!                   Unaudited!

(RM’000)!                 FY2014!        FY2015!          FY2016!           2017!          (RM’000)!             FY2014!     FY2015!       FY2016!        2017!
Gross Profit!             35,731!         88,085!         74,876!          87,709!        Profit After Tax!       17,336!     52,656!       43,446!      51,171!
Gross Profit                                                                              Profit After Tax
                          16.5%!          28.1%!          26.1%!           25.0%!                                  8.0%!      16.8%!        15.1%!       14.6%!
Margin!                                                                                   Margin!

                    Gross Profit and Gross Profit Margin!                                         Profit After Tax and Profit After Tax Margin!

100,000!                                                                      35.0%!    60,000!                                                               18.0%!
                              88,085!                                                                             52,656!
                                                              87,709!
                                                                                                                                               51,171!
                                                                                        50,000!                                                               16.0%!
 80,000!                                       74,876!                        30.0%!                                            43,446!

                                                                                        40,000!                                                               14.0%!
 60,000!                                                                      25.0%!
                                                                                        30,000!                                                               12.0%!
                35,731!
 40,000!                                                                      20.0%!               17,336!
                                                                                        20,000!                                                               10.0%!

 20,000!                                                                      15.0%!
                                                                                        10,000!                                                               8.0%!

       0!                                                                     10.0%!         0!                                                               6.0%!
            FY2014!           FY2015!          FY2016!       FY2017!                               FY2014!       FY2015!       FY2016!        FY2017!

                               Gross profit!        Gross profit margin!                               Profit after tax!    Profit after tax margin!
FINANCIAL POSITION!                                              22!

                                              Audited!      Unaudited!

                                               As at          As at
(RM’000)!
                                            31 Dec 2016!   31 Dec 2017!

Non-current assets!                           117,074!       127,846!

Current assets!                                111,484!      107,738!

    Inventories!                               40,810!       41,351!

    Cash and cash equivalents !                49,468!       31,103!

Total Assets!                                 228,558!       235,584!

Current liabilities!                           42,351!       47,728!

Non-current liabilities!                       12,840!       13,818!

Total Liabilities!                             55,191!       61,546!

Total Equity!                                 173,367!       174,038!

!
•     A strong balance sheet and low gearing ratio.!
LIQUIDITY AND CAPITAL                                                                         24!
RESOURCES!
                                                                      Audited!               Unaudited!

(RM’000)!                                                FY2014!     FY2015!     FY2016!      FY2017!

Net cash generated from operating activities!            18,533!     61,195!     43,110!      44,959!

Net cash used in investing activities!                   (13,491)!   (9,991)!    (3,195)!    (15,399)!

Net cash used in financing activities !                  (12,168)!   (15,656)!   (64,447)!   (47,472)!

Net increase/(decrease) in cash and cash equivalents!    (7,126)!    35,548!     (24,532)!   (17,912)!

Effect of exchange rate changes on cash and cash
                                                           527!        239!       1,075!       (453)!
equivalents!

Cash and cash equivalents at beginning of year/period!   43,737!     37,138!     72,925!      49,468!

Cash and cash equivalents at end of year/period!         37,138!     72,925!     49,468!      31,103!
BUSINESS UPDATES!                                                                     25!

 Weakening Malaysian Ringgit against US$ Adjust selling prices

• Strengthening of Malaysian Ringgit against US$
                                           Increase hedging

• Increase in raw materials prices

• Received approval from Malaysian Ministry of Home Affairs for
 Increase in rawadditional
    further      materials priceshiring of Adjust selling prices
                                           486 foreign         workers on 4 January 2018

                                           Nego7ate with suppliers on bulk
                                           purchase, beLer cash payment terms
                                           and etc.
PROSPECTS !
     &!
FUTURE PLANS!
PROSPECTS!                                                                                                                         27!

• Given Malaysia is the 8th largest player in the world’s furniture !
  market, we expect the competitive advantage to be enhanced under !
  Belt & Road Initiative!
        Asia’s 3rd largest furniture exporter and ranked 8th globally, exporting RM 7.5 billion worth of
        furniture to 169 countries in 2016!
        Strong manufacturing foundation and proven capabilities in producing quality furniture for the
        global market!
        Access to rubberwood (a sustainable raw material) and tropical hardwoods !
                                                                                                                             UAE!
                                   India!                                                                                    RM206.7m!
                               RM211.2.m !                                                                                                 Saudi Arabia!
                                                                                                                             2.8%!         RM161.6m!
                                   2.8%!
                                                  Canada!
                                                                                                                              Philippines! 2.2%!
                                                RM242.4m!
                                                                                                                              RM184.0m!
                      United Kingdom!               3.2%!
                                                                                                                              2.5%!
                            RM392.1m!                                                                                                          Others!
                                 5.2%!                                                                                                         RM1,590.5
                                           Australia!                                                                                          m!
                                          RM511.0m!                                  Top 10 Export                                             21.3%!
                                              6.8%!                                  Destinations of!
                                       Singapore!                                      Malaysia’s !
                                       RM643.7m!                                      Furniture in !                                        U.S.!
                                            8.6%!
                                                                                          2016!                                             RM2,625.5
                                                                                                                                            m!
                                                    Japan!                                                                                  35.1%!
                                                 RM705.7m!
                                                     9.4%!
                                                                                                                         TOTAL = RM7,474.3m!

 Source: !“Wood Furniture Manufacturing for Export in Malaysia” by Converging Knowledge Pte Ltd dated 19 October 2017!
PROSPECTS!                                                                                                                                          28!
• Demand for wooden furniture manufactured in Malaysia is !
   projected to grow at a CAGR of 5.0% annually from 2017 to 2021!
     !    Malaysia is being recognised as a producer of quality furniture!
          With more than three decades of accumulated experience in furniture manufacturing, the furniture
          manufacturing industry in Malaysia is well-perceived as a producer of quality furniture!
          Support and incentives from the government and industry associations for Malaysian furniture
          manufacturers to boost their productivity!                  Forecast Estimates of Malaysia’s
    RM
     !! (Billion) !                                                           Growth!         RM (Billion) ! Wooden Furniture Exports from 2017 to 2021!
           8.0!        Malaysia’s Furniture Exports !                 4.9%!      20.0%!
     !!                                                                                                                                       .0%!
                            from 2011 to 2016! 16.4%!                                                  10.0!                        R: 5
                                                                                                                                 CAG
           7.0!
                              6.3%!                                              15.0%!
                                                  9.4%!
           6.0!     -1.5%!                                                                              8.0!
                                       -10.3%!                                   10.0%!
           5.0!                                                                                                                                             9.5!
                                                                                 5.0%!                  6.0!
           4.0!                                              7.1!                                                                                                  9.5!
                                                                                                                                                     9.1!
                                                                     7.5!        0.0%!
                                                   6.1!                                                                                   8.7!
           3.0!                6.2!                                                                     4.0!                  8.2!
                                         5.6!                                                                   7.9!
                                                                                 -5.0%!                                7.9!
           2.0!       5.9!
                                                                                                        2.0!
                                                                                 -10.0%!
           1.0!

           0.0!                                                                  -15.0%!                0.0!
                      2011!   2012!     2013!     2014!     2015!    2016!                                         2017f!     2018f!     2019f!      2020f!        2021f!
                                 Export Value!            Growth!                                                                      Export Market Size!

 Source: Wood Furniture Manufacturing for Export in Malaysia” by Converging Knowledge Pte Ltd dated 19 October 2017!
China: New Equation in Our !                                                                                            29!
       Growth Strategy!

•     BRI presents dynamic opportunity of expansion for wooden furniture
      players like LY Corporation because of :!
        •     Access to over 1 billion consumers based in China!
        •     Potential demand growth from PRC as PRC’s import of wooden furniture increased by
              79.8% from 2011 to US$563.6 million in 2016!
        •     In 2016, export value from Malaysia to China was RM116.2 million, which was 1.55% of the
              world's export value of RM7,474.3 million.

        !
•     We believe Malaysian furniture players have the cost advantage to compete
      competitively with the Chinese manufacturers.!
        •     Rising labor cost in China has resulted in furniture manufacturing which is labor intensive to
              become uncompetitive. Currently, the minimum wage of China is about 2 to 3 times more
              than that of Malaysia.!
        •     Target to grow our share of revenue from Chinese market in 3-5 years.!
Source:
1 Na7onal popula7on es7mates of China   2. IPO Prospectus, Industry report by Converging Knowledge   3. Converging Knowledge
China: New Equation in Our !                                                            30!
    Growth Strategy!

•   We intend to increase our brand awareness and products in the PRC, including
    (but not limited to) the promotion of our products through established e-
    commerce websites in which customers in the PRC can order our products
    online.
                                    REVENUE BY GEOGRAPHY!

                  13.40%!                                                                    10.3%!

                                                      8.6%!
         9.40%!

                            FY2016!                                               FY2017!    81.2%!

      77.20%!

                                Malaysia!   United States of America!   China/Others!
OUR FUTURE PLANS!                                                                             31!

• Expanding our sales network in the PRC!
     The Group believes there is high demand for our products in the PRC !
     due to the quality of our products and competitive prices we offer!

•   Upgrading our machinery and equipment and acquiring new technology!
     To increase productivity and achieve cost efficiency, as well as increase existing capability!
     To replace aging machinery with new machinery including advanced and automated
     woodworking machinery and robotic spraying arms!

• Construction of additional facilities!
     To enhance manufacturing and service capacity and capability by possibly acquiring new
     premises!
     A new hostel to house all our foreign workers: Allocated approximately 1.9 acres of land (within
     walking distance from our factories)!

• Explore investments, mergers and acquisitions, joint ventures and/or
  strategic collaborations!
     To expand and diversify our operations either through our own investments or through potential
     mergers and acquisitions, joint ventures and/or strategic collaborations. !
     We believe this will further enhance our core capabilities and give us access to new markets,
     customers and businesses!
THANK YOU!

 LY CORPORATION LIMITED!                                     Sponsor!                 Investor Relations Contact !
   Company Registration No.: 201629154K!
(Incorporated in the Republic of Singapore on!     UOB KayHian Private Limited!   Waterbrooks Consultants Pte Ltd!
              24 October 2016)!                                                            Tel: (65) 6100 2228!
You can also read