Q1 2020 BUSINESS UPDATE - INVESTOR RELATIONS | CARGURUS
←
→
Page content transcription
If your browser does not render page correctly, please read the page content below

Q1 2020 Business Update

                          © 2020 CarGurus, Inc. All Rights Reserved.
Cautionary Note Regarding Forward-Looking Statements
Certain information contained in this presentation, other matters discussed today and answers that may be given in response to questions may include “forward-looking statements.” We may,
in some cases, use terms such as “anticipates,” “believes,” “could,” “estimates,” “expects,” “intends,” “likely,” “may,” “might,” “plans,” “potential,” “predicts,” “projects,” “seeks,” “should,” “target,”
“will,” “would,” or other words that convey uncertainty of future events or outcomes to identify these forward-looking statements. In particular, statements in this presentation regarding:
industry trends; our market awareness; our business and growth strategy and our plans to execute on our growth strategy; the growth levers we expect to drive our business; our brand
awareness efforts, including investments in audience and brand building; our investments in and ability to drive adoption of new and existing products and their benefits, including revenue
growth opportunities; the attractiveness and value proposition of our current offerings and other product opportunities; the ability of our offerings to support dealer customers impacted by
the COVID-19 pandemic; our ability to maintain existing and acquire new customers; addressable opportunities; our success in international markets; our future financial and business
performance, including long-term financial targets; and other statements regarding our plans, prospects and expectations, are examples of such forward-looking statements. These forward-
looking statements are subject to a number of risks and uncertainties, including, without limitation, risks related to our growth and ability to grow our revenue, our relationships with dealers,
competition in the markets in which we operate, market growth, our ability to innovate, our ability to realize benefits from our acquisitions and successfully implement the integration
strategies in connection therewith, natural disasters, epidemics or pandemics, like COVID-19 that has negatively impacted our business, our ability to realize cost savings and achieve other
benefits for our business from our planned expense reduction efforts at the levels we expect, our ability to operate in compliance with applicable laws, as well as other risks and uncertainties
as may be detailed from time to time in our Annual Reports on Form 10-K and Quarterly Reports on Form 10-Q and other reports we file with the Securities and Exchange Commission. These
factors could cause actual results and developments to be materially different from those expressed in or implied by such statements. Forward-looking statements do not guarantee future
performance and actual results may differ materially from those projected. The forward-looking statements are made only as of the date of this presentation and we undertake no obligation
to update such forward-looking statements to reflect subsequent events or circumstance.

This presentation also contains estimates and other statistical data, including those relating to our industry and the market in which we operate, that we have obtained or derived from
internally-prepared studies and surveys, a well as industry publications and reports and other publicly available information prepared by a number of third-party sources. We rely on both
internal data and Google Analytics for data relating to our own key business metrics and, for consistency, we rely on Comscore for all data relating to comparisons with our competitors.
Google Analytics and Comscore use different methodologies to derive their data and therefore their data for similar statistics are not comparable. These industry publications and reports
generally indicate that they have obtained their information from sources believed to be reliable, but do not guarantee the accuracy and completeness of their information. This information
involves a number of assumptions and limitations, and you are cautioned not to give undue weight to these estimates, as there is no assurance that any of them will be reached. Based on our
experience, we believe that the publications and reports are reliable and that the conclusions contained therein are reasonable. In addition, you are cautioned not to rely on our extrapolations
of internally-prepared studies and surveys, as these are estimates involving a number of assumptions and limitations, which we are unable to ensure will be reached.

In addition to the financial measures contained in this presentation that are prepared in accordance with U.S. Generally Accepted Accounting Principles (GAAP), this presentation includes
certain non-GAAP financial measures and other business metrics. The presentation of non-GAAP financial information and other business metrics is not meant to be considered in isolation or
as a substitute for the directly comparable financial measures prepared in accordance with GAAP. While our non-GAAP financial measures and other business metrics are an important tool
for financial and operational decision-making and for evaluating our own operating results over different periods of time, we urge investors to review the reconciliation of the non-GAAP
financial measures to the comparable GAAP financial measure included above it in the Appendix to this presentation and not to rely on any single financial measure to evaluate our business.

CarGurus® is a registered trademark of CarGurus, Inc. All other product names, trademarks and registered trademarks are property of their respective owners.
  2    © 2020 CarGurus, Inc. All Rights Reserved.
Global Trusted Marketplace, Powerful Network Effect

             More                                                      More
                                                                                                                       Unbiased                                                       Price
          Car Shoppers                                              Engagement
                                                                                                                       Transparency                                                   Dealer Reputation
             38 M1                                                       65M                                                                                                          Vehicle Condition
            US unique                                                2019 US
             average
             monthly
                                                                    connections                                                                                                       Inventory Ranking
             visitors

                                                                                                                       Marketplace                                                    Dealers
                                                                                                                                                                                      and
              More                                                     More                                                                                                           Peer to Peer
            Inventory                                                 Dealers

              5+ M2                                                 40,000+3
      US Inventory listings                                    US listing dealers
                                                 1. Google Analytics, Q1 2020 2. As of 5/7/2020 3. As of 5/7/2020; CarGurus defines its active dealer network as consisting of all dealers based on a distinct
3   © 2020 CarGurus, Inc. All Rights Reserved.   associated inventory feed, to which CarGurus connected a user about a listing during the ninety-day period ending on the applicable measurement date.
Optimized for Consumer Relevance vs. Paid Inclusion

• How did Google disrupt Yahoo?
     • Relevance over economics
     • Algorithms provide best answers to consumer

• CarGurus ranks listings based
  on unbiased algorithms
     • Organic listings ranked by Deal Ratings
     • Instant Market Value considers
       make, model, trim, year, mileage, options and
       vehicle condition
     • Deal Rating incorporates Dealer Rating
       from CarGurus community

4   © 2020 CarGurus, Inc. All Rights Reserved.
Our Freemium Marketplace Can’t Be Replicated by Classified Models

            LARGEST US AUTO INVENTORY OF 5M+ LISTINGS1 FROM OVER 40,000 DEALERS1

                        Car                                                                         Price Information                                                                   Dealer
                        Information                                                                 • Instant Market
                                                                                                    • Deal Rating2
                                                                                                                              Value2
                                                                                                                                                                                        Information
                        • Vehicle History                                                           • Price History                                                                     • Qualified Dealer Reviews
                        • Time on Site2                                                                                                                                                 • Dealer Ratings

                                                 BEST-DEAL-FIRST ORGANIC SEARCH RESULTS

       92%                              ENGAGED, INFORMED, READY-TO-BUY CONSUMERS
                                                                                                                                                                                                     60%
       of users                                                                                                                                                                          more likely to visit CG vs. other
    are in-market3                                                                                                                                                                       sites within week of purchase4

                                                 1. As of 5/7/2020; compared to major US online auto marketplaces defined as CarGurus.com, Autotrader.com, Cars.com, and TrueCar.com. 2. Unique
                                                 among major US online auto marketplaces defined as CarGurus.com, Autotrader.com, Cars.com, and TrueCar.com. 3. Company survey of 1,000 US
                                                 CarGurus users during Q4 2019. 4. 2019 CarGurus Buyer Insight Report (January 2020); Comparative set includes: Autotrader.com, Cars.com, Edmunds,
5   © 2020 CarGurus, Inc. All Rights Reserved.   KBB, and TrueCar.com.
We are the #1 Online US Automotive Marketplace1
(MILLIONS)2
                                                                                            2
          US Monthly Average Sessions 2           US Monthly Average Visitors

105

                                                                                                                      62%
                                                                                              49%                       CAGR
                                                                                                CAGR

    -
        2008          2009           2010             2011              2012                2013                2014                 2015                2016                2017                2018           2019   2020
                                                       1.   As measured by total visits. Source: Comscore Media Metrix® Multi-Platform, Automotive – Information/Resources, Total Audience, Q1 2020, U.S.
6                                                           (Competitive set includes: CarGurus.com, Autotrader.com, Cars.com, TrueCar.com)
         © 2020 CarGurus, Inc. All Rights Reserved.    2.   Source: Google Analytics; Data from Q1 2020 includes sessions and users, as applicable, from the Autolist website from January 16, 2020 (the date
                                                            of the closing of our acquisition of Autolist) to March 31, 2020.
Consumer Value
Proposition and
Audience Makeup
© 2020 CarGurus, Inc. All Rights Reserved.Our Technology Drives Transparency for Consumers
UNSTRUCTURED CAR DATA FROM HUNDREDS OF Proprietary Algorithm
SOURCES ACROSS THOUSANDS OF DEALERS
52M
Used Car Data Points
Make BMW BMW
IMV
Model 3-Series Coupe 328
20+ Ranking Signals Instant
Year 2015 2015
100+ Normalization Rules Market Value
Trim 328 xi
Seller’s Comes with AWD, 2-door BMW with moon
Description sun roof, and more! roof in excellent condition
Analytics, Manual Penalties,
Bait & Switch Detection,
Both are a 2015 BMW 3-Series 328xi Coupe Non-standard Pricing, Photos
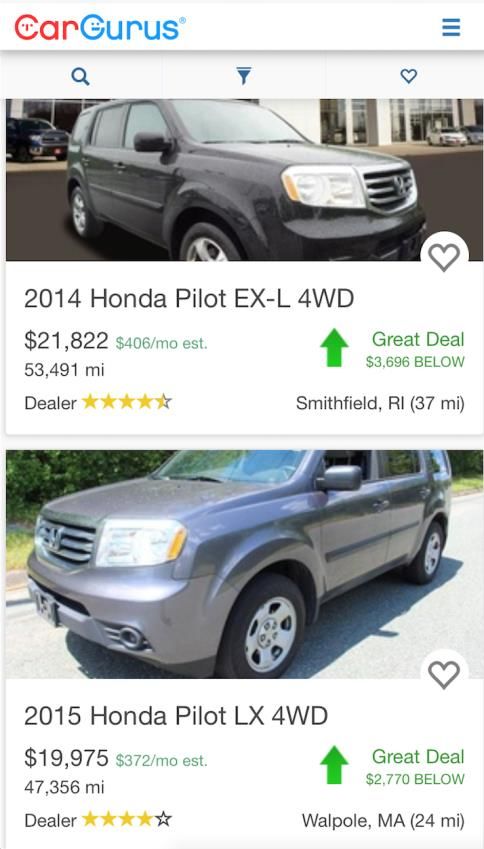
8 © 2020 CarGurus, Inc. All Rights Reserved.Our Technology Drives Transparency for Consumers
Deal Rating
$2,688 BELOW
CarGurus IMV of $28,142
IMV
$1,755 BELOW
+ =
CarGurus IMV of $46,482
Instant User Dealer $921 BELOW
Ratings
CarGurus IMV of $33,910
Market Value
$1,363 ABOVE
CarGurus IMV of $15,232
$3,947 ABOVE
CarGurus IMV of $18,351
9 © 2020 CarGurus, Inc. All Rights Reserved.Our Car Shopping Audience is Engaged and Ready to Purchase
CarGurus shoppers are decision makers And, they’re visiting CarGurus
and auto intenders who have right before making a purchase
the means to buy a new or used vehicle
% OF VISITS WITHIN A WEEK OF PURCHASE1
74%
are the sole
60% 70%
plan to purchase or
CarGurus 37% 1.4x
have a total higher
head of household income of lease a vehicle within Major US Automotive
household1 $75,000 or more1 the next three months1
Marketplaces
27%
10 © 2020 CarGurus, Inc. All Rights Reserved. 1. 2018 CarGurus Buyer Insight Report (February 2019); Comparative set includes Autotrader, Cars.com, Edmunds, KBB, and TrueCarDiverse Traffic Mix Limits Reliance on Any One Channel
US MONTHLY SESSIONS (MILLIONS)1
Impacted by COVID-19
110
We attract our audience
from more than 15 sources
0
2016 2017 2018 2019 2020
11 © 2020 CarGurus, Inc. All Rights Reserved. 1. CarGurus Internal DataDealer Business
Overview
© 2020 CarGurus, Inc. All Rights Reserved.Large Domestic Paying Dealer Base, Growing International
Opportunity
TOTAL PAYING DEALERS (THOUSANDS)1 LARGE DEALER ADDRESSABLE MARKET (THOUSANDS)2
U.S. International
36 35 21 64
34 35
33
30 31 31
29
28
25 27
23 43
Q1 2017 Q1 2018 Q1 2019 Q1 2020 U.S. Market International All Current
Markets Markets
1. Beginning in Q1 2019, includes paying dealers from PistonHeads. Beginning in Q1 2020, includes paying dealers from Autolist. 2. Estimates from NADA
14 © 2020 CarGurus, Inc. All Rights Reserved. (2019), NIADA (2019), Autobiz (2016), Investment bank research (2017).Our Dealer Offerings Unlock Digital Marketing Wallet Share
$
Restricted Paying Dealer RPM Marketing
Listing Dealers Dashboard Suite
Standard Listing Performance Summary Dealer Display
Enhanced Listing Dealer Insights Audience Retargeting
Featured Listing User Review Management SEM Plus
Featured Priority Pricing Tool Social Ads
Delivery Market Analysis
16 © 2020 CarGurus, Inc. All Rights Reserved.Offerings to Support Dealers Impacted by COVID-19
• Contactless Services
• Highlight socially distanced and virtual appointments, at-home test drives, home drop-off, and
contactless purchase capabilities.
• Delivery
• Expands a dealer’s reach by highlighting Delivery capabilities.
• Launched Delivery pilot programs in Canada and the UK.
• Driving Difference
• Resource center for dealers to share best practices and strategize for months ahead.
• Hosting virtual Dealer Councils to maintain dealer community engagement.
• Suspended Listings
• Temporarily maintain inventory visibility for formerly-paying dealers so our leading audience
can continue to express interest.
•
17 © 2020 CarGurus, Inc. All Rights Reserved.Introducing New Products to Unlock Large TAM
US NEW AND USED CAR RETAIL SALES: $1.4T1
INSURANCE
P2P FINANCE TRADE-IN
WARRANTY
$6B $3B
Total US Value2 US Used Car Loan
Commissions3
LISTINGS
CONSUMER LIFECYCLE DEALER MANAGEMENT
MARKETPLACE
Increase Consumer $13.9B $5.3B $3.3B
Retention US Dealer US Dealer US OEM
+ Digital Software Display Ad
Reduce Cost of Marketing Spend5 Spend6
Spend4
Customer Acquisition
MULTIPLE COUNTRIES
$23B
International Total Automotive Advertising Spend7
18 © 2020 CarGurus, Inc. All Rights Reserved. 1. BEA (2018), Edmunds (2018), Mannheim (2018) 2. Borrell (2018), Internal Estimates 3. Transunion (2018), Internal Estimates 4. Borrell (2018) 5.
Investment bank research (2019) 6. Borrell (2018) 7. Investment bank research (2019); spend includes Canada, UK, Germany, Italy and SpainGrowing US AARSD1 Through Three Levers
Grow Increase Unit
Connection Adoption Pricing and
and Lead of New Product
Volume Products Packaging
19 © 2020 CarGurus, Inc. All Rights Reserved. 1. Average annual revenue per subscribing dealer.We Have Rapidly Grown Connection Volume and Increased US
AARSD
OPTIMIZING FOR HIGH QUALITY LEADS (MILLIONS) US AARSD
US Connections US Leads
$20,000 21%
22% CAGR $18,393
12% CAGR $18,000
70 CAGR
$16,000 $15,440
60
$14,000
$12,470
50 $12,000
$10,000
40
$8,000
30
$6,000
20
$4,000
10 $2,000
0 $-
1
2017 2018 2019 Q1 2018 Q1 2019 Q1 2020
20 © 2020 CarGurus, Inc. All Rights Reserved. 1. Excludes revenue and dealers from the Autolist website as it was acquired on January 16, 2020, and therefore, data for the trailing 12-month revenue
calculation is not available.Scaling Our International Business
INTERNATIONAL AVERAGE
Core Market Successfully Launched
MONTHLY UNIQUE USERS (MILLIONS)1,2
71% 10.7
CAGR
Q1 2017 Q1 2018 Q1 2019 Q1 2020
INTERNATIONAL PAYING DEALERS2
7,434
96%
CAGR
Launched Launched
in 2014 in 2015 Q1 2017 Q1 2018 Q1 2019 Q1 2020
21 © 2020 CarGurus, Inc. All Rights Reserved. 1. Google Analytics 2. Beginning in Q1 2019, includes the impact of PistonHeads.Financial Overview
© 2020 CarGurus, Inc. All Rights Reserved.CarGurus Financial Highlights
Strong track High Proven Attractive Scalable
record of
quality
operating free cash model for
revenue revenue:
leverage and
flow replication in
growth recurring, high profitability generation Canada and the
in large total retention, and UK
addressable diversified
market
23 © 2020 CarGurus, Inc. All Rights Reserved.Significant Revenue Scale
17%
($ MILLIONS) YoY
Growth
$158 $158
U.S. International $150
$145
$135
44%
CAGR $589 $126
$119
$34 $110
$99
$454 $91
$17 $83
$76
$67
$317
$9
$198
Q1 Q2 Q3 Q4 Q1 Q2 Q3 Q4 Q1 Q2 Q3 Q4 Q1
FY2016 FY2017 FY2018 FY 2019
2017 2018 2019 2020
2019 guidance
24 © 2020 CarGurus, Inc. All Rights Reserved.Profitable US Business Driving Investments in International
US GAAP OPERATING INCOME ($ MILLIONS) CONSOLIDATED GAAP OPERATING INCOME
$74
$20 $34
$58 $17
$42
$12
$23
FY 2017 FY 2018 FY 2019 Q1 2019 Q1 2020
$7
% Margin 14% 13% 13% 14% 14%
$15
INT’L GAAP OPERATING INCOME ($ MILLIONS)
$(26) $(8)
$(35) $(10) FY 2017 FY 2018 FY 2019 Q1 2019 Q1 2020
$(40)
FY 2017 FY 2018 FY 2019 Q1 2019 Q1 2020 % Margin 5% 5% 6% 5% 8%
27 © 2020 CarGurus, Inc. All Rights Reserved.Long-Term Target Model Progression Since IPO
Long-Term
Percent of Revenue 2017 20181 20191 Q1 2020 1
Target
Gross Margin 94% 95% 94% 93% 93% – 95%
Sales & Marketing % 74% 69% 66% 59% 43% – 47%
Product, Technology, Development % 7% 11% 12% 15% 9% – 11%
G&A % 7% 9% 9% 10% 5% – 6%
Depreciation & Amortization % 1% 1% 1% 1% 1% – 2%
Adjusted EBITDA2 Margin 8% 11% 13% 18% 32% – 34%
GAAP Operating Margin 5% 5% 6% 8% 29% – 31%
U.S. Segment GAAP Operating
14% 13% 13% 14%
Margin
1. Reflects adoption and impact of Accounting Standards Certification Topic 606, Revenue from Contracts with Customers.
30 © 2020 CarGurus, Inc. All Rights Reserved. 2. Please see the Appendix to this presentation for a reconciliation of this non-GAAP measure.Appendix: Reconciliation of Net Income to Adjusted EBITDA
($ MILLIONS) 2017 2018 2019 Q1 2020
Net Income $13.2 $65.2 $42.1 $12.7
Depreciation and Amortization 3.8 5.0 7.8 3.0
Stock-based Compensation Expense 5.0 20.8 34.3 11.7
Acquisition-related Expenses - 0.6 0.5 0.9
Other Income, Net (0.6) (2.3) (4.4) (0.7)
Provision for/(Benefit from) Income Taxes 2.6 (39.7) (3.4) 0.1
Adjusted EBITDA $24.1 $49.7 $77.0 $27.6
Note: We define Adjusted EBITDA as GAAP net income, adjusted to exclude: depreciation and amortization, stock-based compensation expense, acquisition-related expenses, other income, net, and the (benefit from)
provision for income taxes. We have presented Adjusted EBITDA because it is a key measure used by our management and board of directors to understand and evaluate our operating performance, generate future
operating plans, and make strategic decisions regarding the allocation of capital. In particular, we believe that the exclusion of certain items in calculating Adjusted EBITDA can produce a useful measure for period-to-
period comparisons of our business.
32 © 2020 CarGurus, Inc. All Rights Reserved.You can also read