State of Digital Video - Breaking down video ad performance and audience behavior across YouTube, Facebook, Instagram, Twitter, and Snapchat ...
←
→
Page content transcription
If your browser does not render page correctly, please read the page content below
1
SECTION 01         INTRODUCTION

     INDUSTRY STUDY             2018

     State of Digital Video
     Breaking down video ad performance and audience behavior
     across YouTube, Facebook, Instagram, Twitter, and Snapchat

     Copyright 2018. Pixability, Inc. All rights reserved.

State of Digital Video | 2018                                     © 2018 Pixability, Inc. All rights reserved.
2
SECTION 01        INTRODUCTION

Welcome to Pixability’s third annual                                executed two campaigns on behalf of our partners across
                                                                    YouTube, Facebook, Instagram, Twitter, and Snapchat, and
analysis of audience behavior and                                   monitored the results.

video campaign performance across                                   In benchmarking how YouTube, Facebook, Instagram, et

the platforms that matter most.                                     al. deliver video performance across audiences, creative
                                                                    lengths, devices, and other factors, Pixability strives to
We sought to understand how YouTube, Facebook, Instagram,           give marketers confidence that they’re maximizing the
Twitter, and Snapchat continue to evolve, adding or refining        results of their video buys. Working with partners Moat and
their solutions to help advertisers make an impact on their         Nielsen, we also measured viewability and demographic
target consumers at scale. As these companies roll out new          data to help marketers understand the real impact of their
ad products and features, there remain many key differences         video ad dollars. Armed with this report, brand and agency
in view definitions, audience behaviors, targeting parameters,      marketers can make smarter video decisions that will impact
metrics — and ultimately video strategies — when driving            their overall business objectives — and ensure their video
performance. To better understand how marketers can best            strategy drives performance.
reach their audiences through digital video, Pixability’s experts

State of Digital Video | 2018                                                                      © 2018 Pixability, Inc. All rights reserved.
14%
                  of YouTube views occur
                  on OTT devices, as
                                                  98%
                                                  of impressions on Facebook
                                                  are demographically on-target,
                  measured by Nielsen             as measured by Nielsen

                  17%
                  higher view rate on Instagram
                  over last year’s analysis
                                                  8-9 AM
                                                  Twitter viewership peaks

State of Digital Video | 2018                                                © 2018 Pixability, Inc. All rights reserved.
4
SECTION 02 TRACKING PERFORMANCE
YouTube Expands Its Take Advantage Of Longer Watch Times On YouTube
With Long-Form Creative
Advantage In Watch Time YouTube Facebook Instagram Twitter Snapchat*
In previous analyses, Pixability found that YouTube drives 50%
the longest watch time — measured by highest view
40%
and view-to-completion rates — than other platforms.
And this year is no exception. Across creative lengths, 30%
the video powerhouse reigns supreme, as its 60-second
20%
view-to-completion rate clocks in at 22X higher than
runner-up Facebook. While Facebook, Instagram, and
10%
Twitter’s view-to-completion rates declined as creative
length increased, a 30-second creative achieved 15s 30s 60s
the highest view-to-completion rate performance on Source: Pixability, February 2018
* A completed view on Snapchat is 10 seconds in length.
YouTube. However, with only a slight decrease in view-
to-completion rate between 30 and 60 seconds, it’s clear
that the marketers should take advantage of the more
engaged audiences on YouTube, and utilize long-form
creative to maximize watch time.
State of Digital Video | 2018 © 2018 Pixability, Inc. All rights reserved.5
SECTION 02 TRACKING PERFORMANCE
While view rates appear more or less similar across on Facebook and Instagram was a 3-second view (to suitably
platforms, this is likely due to divergent view definitions: compare standard view rates), but selecting 10-second views
or clicks as the objective would likely have produced different
−− On YouTube, a view is measured by 30 seconds of
outcomes.
watch time or video completion.
−− On Facebook and Instagram, a video must be in view View Rates Appear Similar Due To Divergent
for 3 seconds (with 100% of pixels on-screen on View Definitions
desktop, or 50% on mobile). 15 Sec. 30 Sec. 60 Sec.
−− Twitter and Snapchat both follow the MRC standard,
60%
or 50% of pixels on-screen for two seconds.
50%
In order to understand the real impact of their media spend,
40%
it’s imperative that marketers normalize metrics for a cross-
platform, apples-to-apples view on how each platform is 30%
performing, highlighting opportunities to further drive reach
20%
and engagement among their audiences. Social video
10%
platforms are also constantly refining their ad algorithms, so
marketers should be careful to choose the right campaign
YouTube Facebook Instagram Twitter Snapchat
objectives. For example, the objective for Pixability’s test Source: Pixability, February 2018
State of Digital Video | 2018 © 2018 Pixability, Inc. All rights reserved.6
SECTION 02 TRACKING PERFORMANCE
View-To-Completion Rates Doubled On YouTube
Last year’s analysis indicated that Facebook, 50%
Instagram, and Twitter view-to-completion rates
were on the rise as users grew accustomed to
40%
viewing native video. This year, these platforms
again saw a rise in view-to-completion rates
due to a user base that increasingly sees these 30%
platforms as video destinations — and in fact,
YouTube doubled its view-to-completion rate,
continuing to command viewer attention. Across 20%
YouTube, Facebook, Instagram, and Twitter, the
continued rise in view-to-completion rates is
10%
driven by algorithmic refinements and advertiser
investment in more sophisticated, made-for-
digital creative.
Q1 2016 Q4 2016 Q1 2018
Source: Pixability, February 2018
State of Digital Video | 2018 © 2018 Pixability, Inc. All rights reserved.7
SECTION 02 TRACKING PERFORMANCE
YouTube, Facebook, and Twitter saw a 2X higher view rate than the
results of last year’s analysis, while Instagram saw a noticeable bump
of 17% over last year’s number.
View Rates Are Surging Across YouTube, Facebook,
Instagram, And Twitter
YouTube, Facebook,
Q1 2016 Q4 2016 Q1 2018 and Twitter saw a 2X
50% higher view rate than
40%
the results of last
year’s analysis ...
30%
20%
10%
YouTube Facebook Instagram Twitter
Source: Pixability, February 2018
State of Digital Video | 2018 © 2018 Pixability, Inc. All rights reserved.8
SECTION 01 TRACKING PERFORMANCE
Platforms Optimize Optimizing Toward Watch Time Results In Decreased Click-through Rates
Toward Longer
Q1 2016 Q4 2016 Q1 2018
0.6%
Watch Time 0.5%
As viewing experiences improve 0.4%
and platforms continue to optimize
0.3%
against longer watch times, click-
through rates declined across 0.2%
platforms. Our analysis found that 0.1%
consumers aren’t leaving video
YouTube Facebook Instagram Twitter
environments as often, which is
Source: Pixability, February 2018
reflected in longer view and view-
to-completion rates.
State of Digital Video | 2018 © 2018 Pixability, Inc. All rights reserved.9
SECTION 02 TRACKING PERFORMANCE
Advertisers that are looking to engage consumers on social
video would be wise to share long-form creative. The longer
the creative length, the higher the click-through rate, as users
have more time to interact or engage with a video ad.
Advertisers that are
Longer Creative Length Leads To Higher Click-Through Rates looking to engage
15 Sec. 30 Sec. 60 Sec. consumers on social
0.50%
video would be wise to
0.40% share long-form creative.
0.30%
0.20%
0.10%
YouTube Facebook Instagram Twitter Snapchat
Source: Pixability, February 2018
State of Digital Video | 2018 © 2018 Pixability, Inc. All rights reserved.10
SECTION 02 TRACKING PERFORMANCE
Performance Is Driven Targeting Type Drives Video Performance
By Targeting Type 60% (View Rate) 60% (View Rate) 40% (View Rate)
30%
Marketers can maximize the impact 40% 40%
of their ad spend by selecting the 20%
targeting parameters that drive peak 20% 20%
performance. However, there is no 10%
panacea for targeting — different
Keyword Interest Custom Placement Topic Behavior Interest Behavior Interest
targeting parameters can deliver Affinity
divergent results across video spaces,
60% (View Rate) 20% (View Rate)
or even across a brand’s campaigns.
The only way marketers can reach and 40%
15%
engage the most relevant audiences 40%
for their advertising is a sophisticated 20% 10%
video strategy: aggressively segmenting 20%
5%
campaigns to optimize in-flight and take 20%
advantage of the targeting parameters
Keyword Behavior Interest Follower Lifestyles Shoppers Visitors
that deliver the best performance. Source: Pixability, February 2018
State of Digital Video | 2018 © 2018 Pixability, Inc. All rights reserved.11
SECTION 03 UNDERSTANDING VIEWING BEHAVIOR
Distinct Viewing Patterns
Emerge Throughout Day
Pixability’s analysis of viewing behavior shows that daypart their campaigns — segmenting ad groups by time of day
consumers look to each platform at different hours of the — to drive reach during hours of high viewership, to maintain reach
day. Depending on campaign goals, marketers may want to throughout the day, or to engage viewers during key moments.
Consumers Have Developed Distinct Viewing Patterns
YouTube Facebook Instagram Twitter
4 PM
Waiting to clock out
5% (Share of Daily Viewership) 8-9 AM
9 PM
Unwinding before bed
#Commuting
6-9 PM
Primetime viewing
4%
3%
6-10 PM
Primetime viewing
2%
1%
1:00 AM 3:00 AM 5:00 AM 7:00 AM 9:00 AM 11:00 AM 1:00 PM 3:00 PM 5:00 PM 7:00 PM 9:00 PM 11:00 PM
Source: Pixability, February 2018
State of Digital Video | 2018 © 2018 Pixability, Inc. All rights reserved.12
SECTION 03 UNDERSTANDING VIEWING BEHAVIOR
View And Click-Through Rates View Rates Tend To Increase With Age Powered by
Across Facebook, Instagram, And Twitter
Tend To Increase With Age 18-24 25-34 35-44 45-54 55-64 65+
Pixability partnered with Nielsen to understand how 70%
different demographic segments engage with video 60%
ads. On Facebook, Instagram, and Twitter, older
50%
demographic segments are the most likely to view
40%
and click on video ads — Facebook in particular
30%
saw the most dramatic increase in view and click-
through performance among older audiences. 20%
YouTube sees relatively consistent performance 10%
across age segments, though younger audiences
Facebook Instagram Twitter
are slightly more likely to view and click than older Source: Nielsen Digital Ad Ratings
demographic segments.
State of Digital Video | 2018 © 2018 Pixability, Inc. All rights reserved.13
SECTION 03 UNDERSTANDING VIEWING BEHAVIOR
View-To-Completion Rates Tend To Increase With Age Across Facebook, Instagram, And Twitter
18-24 25-34 35-44 45-54 55-64 65+
12%
10%
8%
6%
4%
2%
Facebook Instagram Twitter
Click-through Rates Tend To Increase With Age Across Facebook, Instagram, And Twitter
18-24 25-34 35-44 45-54 55-64 65+
.5%
.4%
.3%
.2%
.1%
Facebook Instagram Twitter
Source: Pixability, February 2018
State of Digital Video | 2018 © 2018 Pixability, Inc. All rights reserved.14
SECTION 04 UNLOCKING VIDEO’S IMPACT
Facebook Leads In On-Target Facebook Leads In On-Target Impressions,* But All
Platforms Outpace The Open Web
Impressions, But All Platforms 100%
Outpace The Open Web 80%
Measured and verified by Nielsen, Pixability found
that the percent of on-target impressions — the rate 60%
of impressions delivered within the desired audience
40%
— were high across YouTube, Facebook, Instagram,
and Snapchat, outpacing open web benchmarks by a
20%
large margin. Facebook delivered the highest on-target
impression rate, in large part due to a high rate of
Facebook YouTube Snapchat Instagram Nielsen Open
logged-in users that shared a great deal of information Web Benchmark
Source: Nielsen Digital Ad Ratings, February 2018
directly with Facebook — whereas on some other * Twitter did not report on on-target impressions.
platforms, demographic information may have to be
inferred based on user behavior.
State of Digital Video | 2018 © 2018 Pixability, Inc. All rights reserved.15
SECTION 04 UNLOCKING VIDEO’S IMPACT
Moat Data Confirms Marketers marketers must consider the environment that their creative
will be consumed in. Moat’s analysis highlights that while
Must Consider Platform-Specific YouTube, Facebook, Instagram, and Twitter all drive high
Viewing Behaviors When rates of valid and viewable impressions via MRC standards,
a significant amount of video ads are consumed without the
Developing Strategies sound on. Instead of simply utilizing the same creative across
platforms, marketers should adopt a data-driven approach,
YouTube delivered the highest rate of valid and viewable
and refine their video strategy based on viewing behavior. For
impressions1 and the highest completion quality rate,2
example, Twitter’s completion quality is relatively low across
measured by Moat, which verifies viewability (a measurement
social video platforms, indicating that marketers should
of how visible ads are to users). This confirms that YouTube
produce video that doesn’t require sound to understand.
drove the highest share of views that were both audible and
visible to a human viewer — and Instagram delivered a 4X
higher rate of completion quality than Facebook.
When planning video strategies through 2019 and beyond,
1 The percentage of valid impressions that were viewable under the MRC standard
(50% of pixels in-view for at least 2 continuous seconds).
2 The percentage of video completions that were audible and visible.
State of Digital Video | 2018 © 2018 Pixability, Inc. All rights reserved.16
SECTION 04 UNLOCKING VIDEO’S IMPACT
YouTube Leads In Rate Of Valid And Viewable Impressions What Makes An Ad Viewable?
YouTube
Facebook Not Viewable
Instagram
Twitter
Snapchat
10% 20% 30% 40% 50% 60% 70% 80% 90% 100%
Instagram Delivers A High Video Completion Quality Rate Due To
Platform Refinements: Once Enabled, Audio Stays On Until App Is Closed*
Viewable
YouTube
Facebook
Instagram
Twitter
10% 20% 30% 40% 50% 60% 70% 80% 90% 100%
Source: Moat
* Snapchat does not currently report on video ad completion quality
State of Digital Video | 2018 © 2018 Pixability, Inc. All rights reserved.17
Data-Driven Creative Recommendations
Based on Moat’s analysis of how viewers are watching video ads
across platforms, Pixability isolated a number of recommendations to
make brand creative more impactful:
−− Across platforms, advertisers should ensure their video starts
with a compelling hook to encourage users to keep watching.
−− In addition, advertisers should aim to show a brand logo or
product shot within the first few seconds of a video ad —
making an impact before a user can keep scrolling or click
to skip an ad, and possibly reaching a consumer without
being charged for a view.
−− On Facebook and Twitter, marketers should produce video
with hardcoded subtitles to guarantee their message is
delivered, as Moat’s metrics indicate that a significant
number of viewers don’t watch ads with audio on.
State of Digital Video | 2018 © 2018 Pixability, Inc. All rights reserved.18
SECTION 04 UNLOCKING VIDEO’S IMPACT
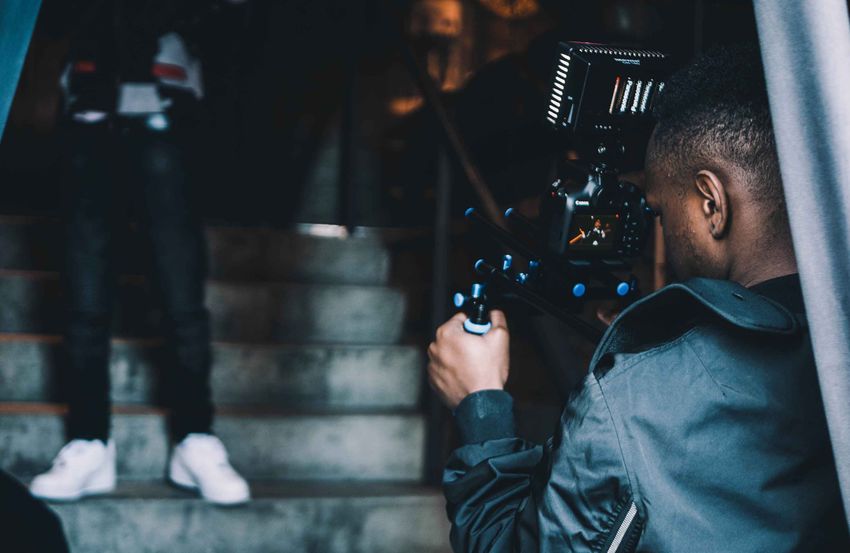
YouTube Is A Sleeping By segmenting by devices, marketers can drive reach evenly
across viewing environments — or optimize toward a certain
Giant In The OTT Space device, depending on their business objectives.
Our partnership with Nielsen uncovered that the OTT
audience (including connected TV devices such as OTT Comprises A Significant Percentage
Of The YouTube Viewership
Roku products, Apple TVs, Chromecasts, smart TVs,
Desktop Views Mobile Views OTT Views
etc.) comprises 14% of YouTube views. This shows that
advertisers are reaching leaned-back, engaged consumers 14%
in the living room for a fraction of the cost of linear TV.
24%
While YouTube is a sleeping giant in the living room viewing
space, the platform will upend the OTT industry when it
rolls out OTT reporting — until then, advertisers can only
measure their reach among living room audiences through
technology partners.
In addition, YouTube and Facebook video campaigns tend
to reach mobile users nearly 3X as often as desktop users. 62%
Source: Nielsen Digital Ad Ratings
State of Digital Video | 2018 © 2018 Pixability, Inc. All rights reserved.19
SECTION 04 UNLOCKING VIDEO’S IMPACT
Without Aggressive Segmentation, Platforms
Optimize Toward Certain Demographics and Locations
In our analysis, Pixability’s non-segmented and non-optimized campaigns served a majority of impressions to middle-aged and
older men in Boston. Marketers should aggressively segment their campaigns, particularly by age and location, and carefully
monitor in-flight performance to maintain control over which audiences they’re reaching.
Without Segmentation, Platforms Optimize Toward Certain Demographics Female Male
250,000 (Impressions)
200,000
150,000
100,000
50,000
18-20 21-24 25-29 30-34 35-39 40-44 45-49 50-54 55-64 65+
Source: Pixability, February 2018
State of Digital Video | 2018 © 2018 Pixability, Inc. All rights reserved.20
SECTION 04 UNLOCKING VIDEO’S IMPACT
Without Segmentation, Platforms Optimize Toward Certain Locations Campaign 1 Campaign 2
4,000 (Impressions)
3,500
3,000
2,500
2,000
1,500
1,000
500
New York City
Los Angeles
Chicago
Philadelphia
Dallas-Ft. Worth
San Francisco
Washington, D.C.
Houston
Atlanta
Boston
Phoenix
Seattle-Tacoma
Detroit
Minneapolis
Miami
Tampa
Denver
Sacramento
Cleveland
Orlando
Portland
St. Louis
San Diego
Charlotte
Raleigh
Baltimore
Indianapolis
Pittsburgh
Nashville
Hartford
Source: Pixability, February 2018
State of Digital Video | 2018 © 2018 Pixability, Inc. All rights reserved.21
SECTION 04 UNLOCKING VIDEO’S IMPACT
Next Steps: How To Approach YouTube
Longer viewing sessions and video completion rates make
Social Video In 2018 YouTube in-stream ads ideal for encouraging users —
particularly younger audiences — to lean in and engage with
Social video advertising is complicated by different
long-form, digital-first brand content, driving awareness.
view definitions, audience behaviors, and targeting
parameters. But these platforms still represent the best Facebook
channel for reaching and engaging audiences at scale. The platform’s high click-through rate performance, stellar on-
Advertisers have an opportunity to take advantage of target impression rate, and powerful audience targeting options
these complexities, developing sophisticated targeting empower marketers to drive lower-funnel metrics such as
strategies and optimizing in-flight based on desired product consideration, and purchase decisions.
outcomes to maximize impact across YouTube, Instagram
Facebook, Instagram, Twitter, and Snapchat. Instagram’s high completion quality rate makes it well-
suited for communicating medium- to long-form video ads
among engaged viewers, helping brands build equity and
awareness around new products, as well as drive click-through
performance.
State of Digital Video | 2018 © 2018 Pixability, Inc. All rights reserved.22
SECTION 04 UNLOCKING VIDEO’S IMPACT
Twitter Digital Media Planning Considerations
Advertisers can take advantage of Twitter’s
specialized ad products — targeting against 16x9 video
events, communities, and followers — and high
1x1 video
view rates to make an impact on audiences as
they’re contributing to the digital conversation. OTT viewing
Snapchat Long-form video
Snapchat’s high rate of on-target impressions
Vertical video
and young audience allows advertisers to
precisely reach Gen Z and Millennial consumers, Plan for audio off
particularly through lifestyles targeting. Plan for audio on
Brand logo or product shot within first 3 seconds
Brand logo or product shot within first 5 seconds
Plan for second screen
On-screen talent to speak direct to viewer
Face included in thumbnail
State of Digital Video | 2018 © 2018 Pixability, Inc. All rights reserved.23
SECTION 05 APPENDIX
Methodology placements and keywords was pulled from Pixability’s
patented insights technology platform. The platform
All insights are based on data analysis performed by harvests data about YouTube videos from the YouTube data
Pixability’s Customer Success Insights team. Using similar API, search API, and other relevant sources. Videos are
creative assets for two brands (electronics and fashion), analyzed based on a number of features, including metadata
Pixability created near-identical campaigns on YouTube, processing (title, description, tags), comment analysis, and
Facebook, Instagram, Twitter, and Snapchat using the time series tracking using historical data collected over the
targeting capabilities available within each platform. last few years. Topic spaces are defined by lists of keywords
that can be combined in multiple layers (e.g., base keywords
Campaign settings such as price to bid, budget, etc. were
describing a topic combined in Boolean OR plus an overlay
all kept consistent in order to deliver as close to an A/B test
of required keywords, such as a brand name).
as possible between the five platforms. The campaigns were
not broken out by age, gender, or device, in order to see how
each platforms handled delivering against these parameters.
Key Terms
The campaigns were executed in Q1 2018, and performance Click-through rate (CTR)
was compared to Pixability’s 2016 cross-platform tests, A measure of engagement, calculated by dividing the number
executed in Q1 and Q4 2016. of link clicks by overall impressions. On Snapchat, swipe-ups
are measured as link clicks.
In addition to using the available targeting options within
each platform, specifically on YouTube, a set of video
State of Digital Video | 2018 © 2018 Pixability, Inc. All rights reserved.24
SECTION 05 APPENDIX
Completion quality view for at least 2 continuous seconds).
Measured by Moat, the percentage of video completions that
View rate
were audible and visible.
The share of impressions that resulted in a viewer meeting
Over-the-top (OTT) each platform’s standard for a view:
Media distribution that allows a streaming content provider
−− On YouTube, a view is measured by 30 seconds of watch
to sell audio, video, and other media services directly to the
time or video completion.
consumer over the internet via streaming media as a stand-
−− On Facebook and Instagram, a video must be in view for
alone product, bypassing telecommunications, cable or
3 seconds (with 100% of pixels on-screen on desktop,
broadcast television service providers that traditionally act as
or 50% on mobile).
a controller or distributor of such content. Examples include
−− Twitter and Snapchat both follow the MRC standard, or
Apple TV, Roku, etc.
50% of pixels on-screen for two seconds.
Rate of on-target impressions View-to-completion rate
Measured by Nielsen, the percentage of total impressions The share of impressions that resulted in a viewer watching
delivered within the audience target of the campaign. 100% of a video ad.
Rate of valid and viewable impressions:
Measured by Moat, the percentage of valid impressions that
were viewable under the MRC standard (50% of pixels in-
State of Digital Video | 2018 © 2018 Pixability, Inc. All rights reserved.25
LON
SFO
CHI
BOS
NYC
Boston | HQ New York Chicago San Francisco London
77 N. Washington St. 119 W. 24th St. WeWork Kinzie 44 Tehama St. 1 Fore St.
2nd Floor 5th Floor 20 W. Kinzie St. San Francisco, CA 94105 London, UK
Boston, MA 02114 New York, NY 10011 Chicago, IL 60654 EC2Y 5EJ
State of Digital Video | 2018 © 2018 Pixability, Inc. All rights reserved.Boston | New York | Chicago | San Francisco | London
You can also read