2020 Earnings Guidance - December 18, 2019 - November 1, 2019 - PNM Resources

Page created by Judy Pratt
 
CONTINUE READING
2020 Earnings Guidance - December 18, 2019 - November 1, 2019 - PNM Resources
November 1, 2019

2020 Earnings Guidance
December 18, 2019
2020 Earnings Guidance - December 18, 2019 - November 1, 2019 - PNM Resources
Safe Harbor Statement

Statements made in this presentation for PNM Resources, Inc. (“PNMR”), Public Service Company of New Mexico
(“PNM”), or Texas‐New Mexico Power Company (“TNMP”) (collectively, the “Company”) that relate to future
events or expectations, projections, estimates, intentions, goals, targets, and strategies are made pursuant to the
Private Securities Litigation Reform Act of 1995. Readers are cautioned that all forward-looking statements are
based upon current expectations and estimates. PNMR, PNM, and TNMP assume no obligation to update this
information. Because actual results may differ materially from those expressed or implied by these forward-
looking statements, PNMR, PNM, and TNMP caution readers not to place undue reliance on these statements.
PNMR's, PNM's, and TNMP's business, financial condition, cash flow, and operating results are influenced by
many factors, which are often beyond their control, that can cause actual results to differ from those expressed
or implied by the forward-looking statements. For a discussion of risk factors and other important factors
affecting forward-looking statements, please see the Company’s Form 10-K and 10-Q filings with the Securities
and Exchange Commission, which factors are specifically incorporated by reference herein.

Non-GAAP Financial Measures
For an explanation of the non-GAAP financial measures that appear on certain slides in this presentation
(ongoing earnings, ongoing earnings per diluted share and ongoing earnings guidance measures), as well as a
reconciliation to GAAP measures, please refer to the Company’s website as follows:
http://www.pnmresources.com/investors/results.cfm.

                                                                                                                2
2020 Earnings Guidance - December 18, 2019 - November 1, 2019 - PNM Resources
Opening Remarks and Overview
        Pat Vincent-Collawn
       Chairman, President and CEO
2020 Earnings Guidance - December 18, 2019 - November 1, 2019 - PNM Resources
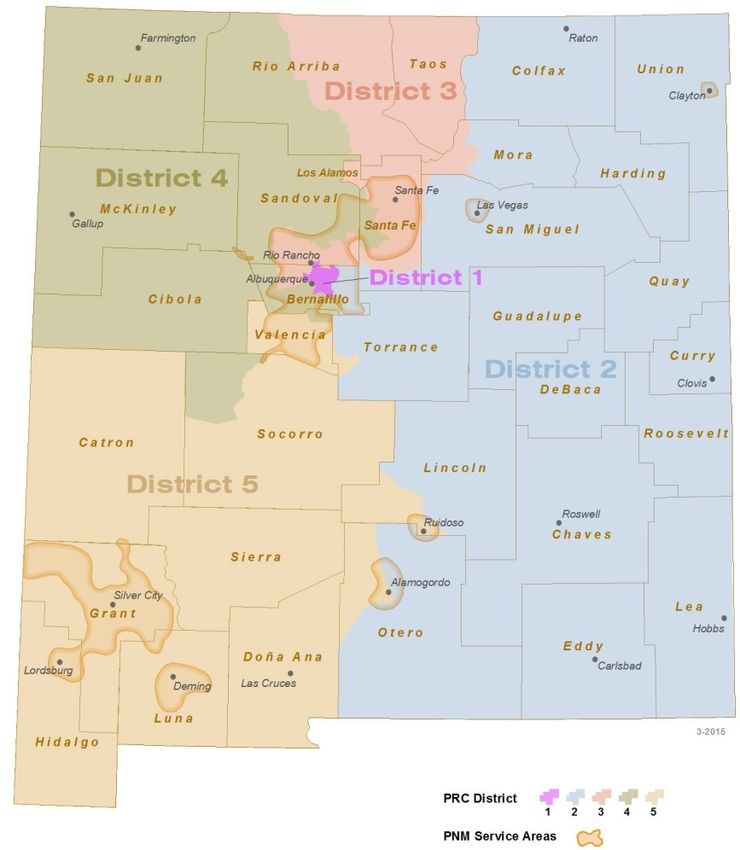
Earnings Guidance and Dividend Increase

Ongoing Earnings Guidance:
• Revised 2019 Ongoing EPS Guidance to $2.13 - $2.16
• 2020 Ongoing EPS Guidance of $2.16 - $2.26

Dividend Increase:
• Board increased common dividend by $0.07, a 6% increase, to
   indicated annual rate of $1.23 per share
    • 10th consecutive increase since 2012
    • 56% payout ratio based on 2020 guidance midpoint

                                                                4
2020 Earnings Guidance - December 18, 2019 - November 1, 2019 - PNM Resources
Regulatory Agenda

  Filing                           Action                                             Timing                               Docket No.
PNM:
                                 PNM filed July 1, 2019; NMPRC bifurcated
                                                                                     NMPRC decision on abandonment/
Consolidated Application for San application on July 10, 2019;
                                                                                     securitization expected by April 1,   19-00018-UT
Juan (Abandonment,               Abandonment/Securitization hearings scheduled
                                                                                     2020, decision on replacement power   19-00195-UT
Securitization and Replacement)  December 10-19, 2019; Replacement Power
                                                                                     expected by October 1, 2020
                                 hearings scheduled January 22-29, 2020
                                 PNM filed June 3, 2019; Hearings held October 24-
2020 Renewable Plan              25, 2019; Recommended Decision to approve plan      NMPRC decision expected in Q1 2020    19-00159-UT
                                 issued on December 2, 2019
                                 PNM filed May 31, 2019 for approval of voluntary
                                 renewable program expected to begin March 31,
Solar Direct Program                                                                 NMPRC decision expected in Q1 2020    19-00158-UT
                                 2021; Hearing held November 20, 2019, will
                                 continue January 9, 2020
                                 New Mexico Supreme Court issued opinion May 16,
Appeal of 2015 General Rate Case 2019 affirming NMPRC decision but denying the       No statutory timeline; oral arguments 15-00261-UT
to New Mexico Supreme Court      disallowance of future Palo Verde decommissioning   on remand held July 17, 2019          S-1-SC-36115
                                 costs; full order was remanded back to the NMPRC

    Upcoming activities:
    • PNM General Rate Review filing expected in Q2 2020
    • PNM annual FERC formula rate and PNM annual Renewable filing filed in Q2 2020
    • PNM 2020 IRP filing due July 1st
    • TNMP TCOS filings in Q1 and Q3 2020
    • TNMP DCOS filing expected in April 2020
    • New Mexico ballot initiative to move to appointed Commission
       in November 2020                                                                                                         5
2020 Earnings Guidance - December 18, 2019 - November 1, 2019 - PNM Resources
2020 Guidance
           Chuck Eldred
   Executive Vice President and CFO
             Don Tarry
Vice President, Controller and Treasurer
2020 Earnings Guidance - December 18, 2019 - November 1, 2019 - PNM Resources
Consolidated Earnings Guidance (Ongoing)

                        2019 Revised Earnings Guidance
               $2.13          Consolidated EPS      $2.16

            PNM                       TNMP             Corp/Other
        $1.64 – $1.65              $0.70 – $0.71     ($0.21) – ($0.20)

                           2020 Earnings Guidance

          $2.16              Consolidated EPS            $2.26

      PNM                            TNMP                   Corp/Other
  $1.67 – $1.73                   $0.72 – $0.74          ($0.23) – ($0.21)

                                                                             7
2020 Earnings Guidance - December 18, 2019 - November 1, 2019 - PNM Resources
Load and Economic Conditions

                                                                              PNM

Economic indicators continue to be positive                                                                 Q3 YTD 2019
     Customer growth driven by economic development                                     PNM                    vs.              2019E           2020E
     Higher data center load partially offset by Commercial                                                Q3 YTD 2018
      customer energy efficiency efforts                                        Total Retail Load(1)             0.0%        0.0% – 1.0% 0.5% – 1.5%
                                                                                PNM Avg. Customers               0.8%        0.8% – 1.0% 0.8% – 1.2%
                                                                                (1) Weather normalized and leap year adjusted, excludes Economy customers

                                                                              TNMP
                               Q3 YTD 2019                                        Texas growth drives infrastructure needs
         TNMP                      vs.                2019E             2020E
                                                                                         Residential customer growth driven by strong Texas
                               Q3 YTD 2018
                                                                                          economy across TNMP service territory
Demand-Based Load(2)                 4.3%         4.0% – 5.0% 4.0% – 5.0%                Demand-based load growth in Commercial and
TNMP Avg. End Users                  1.5%            ~1.5%       ~1.5%                    Industrial classes driven by energy sector in West
(2) Commercial and Industrial per-kw monthly peak billings; excludes retail               Texas and Gulf Coast regions; drives need for
     Transmission customers
                                                                                          infrastructure investment

                                                                                                                                                   8
2020 Earnings Guidance - December 18, 2019 - November 1, 2019 - PNM Resources
PNM Guidance (Ongoing)

                                PNM Ongoing EPS
                                                                      $1.67 - $1.73
                                       $1.64 - $1.65
             $1.54

            2018                           2019E                          2020E
  • Load growth and increased rate recovery from the retail renewable rider and the
    FERC formula rate more than offset increased depreciation expense from new
    investments:
      •   PNM’s first new transmission line constructed since 1985 to be completed in 2020 (BB2)
      •   Western Spirit interconnection projects begin; expected in-service mid-2021
  • Overall reduction in O&M costs driven by lower outage costs
      •   San Juan completed its final planned outage in 2019
      •   Non-outage O&M returns to normal levels in 2020

                                                                                            9
2020 Earnings Guidance - December 18, 2019 - November 1, 2019 - PNM Resources
TNMP Guidance (Ongoing)

                            TNMP Ongoing EPS
                                    $0.70 - $0.71               $0.72 - $0.74
             $0.65

             2018                       2019E                      2020E
  • 2019 EPS includes $0.04 of weather benefit
  • Continued TCOS filings to recover transmission investments twice per year; first
    utilization of annual DCOS filing to recover distribution investments
  • Continued growth across service territory drives additional investments, resulting
    in higher depreciation expense, property tax and interest expense from new long-
    term debt

                                                                                   10
2020 - 2023 Potential Earnings Power

                                                 Earnings Growth Target 5-6%
       Equity financing plans continue to be optimized; 2020 impacts within guidance range
                                    2020 Ongoing Earnings                          2021 Earnings                      2022 Earnings                  2023 Earnings
                      Allowed
                      Return /
                                     Guidance Midpoint                               Potential                          Potential                      Potential
                       Equity
                                 Avg Rate                                   Avg Rate                           Avg Rate                         Avg Rate
                       Ratio              Return               EPS                               EPS                                EPS                         EPS
                                   Base                                       Base                               Base                             Base
                      9.575% /
PNM Retail                        $2.5 B       9.5%           $1.47           $2.5 B            $1.52            $2.4 B            $1.48         $2.4 B        $1.48
                        50%
San Juan              9.575% /
                                                                                                                $150 M             $0.09        $280 M         $0.17
Replacement(1)          50%
                      9.575% /
PNM Renewables                   $150 M      9.575%           $0.09          $145 M             $0.09           $140 M             $0.08        $130 M         $0.07
                         50%
                       10% /
PNM FERC                         $340 M        7.5%           $0.15          $530 M         $0.26-$0.30         $740 M         $0.37-$0.42      $780 M      $0.39-$0.44
                        ~50%
Items not in Rates                                           ($0.01)                      ($0.03)-($0.01)                    ($0.03)-($0.01)               ($0.03)-($0.01)
   Total PNM                      $3.0 B                      $1.70           $3.2 B        $1.84-$1.90          $3.5 B        $1.99-$2.06       $3.6 B     $2.08-$2.15
                      9.65% /
TNMP                              $1.3 B      9.65%           $0.73           $1.5 B            $0.84            $1.6 B            $0.89         $1.9 B        $1.02
                        45%
Corporate/Other                                              ($0.22)                      ($0.21)-($0.19)                   ($0.19) - ($0.17)              ($0.23)-($0.21)
Equity Financing Plans                                   ($0.01)-$0.00                    ($0.10)-($0.09)                   ($0.20) - ($0.19)              ($0.24)-($0.23)
Total PNM Resources               $4.3 B                 $2.20 - $2.21        $4.7 B       $2.37 - $2.46         $5.1 B       $2.49 - $2.59      $5.6 B    $2.63 - $2.73

Note: 2018-2023 CAGR measured from 2018 Ongoing EPS of $2.00
(1) Assumes 2022 mid-year implementation

                                    This table is not intended to represent a forward-looking projection of 2021 - 2023 earnings guidance.
                                                                                                                                                                11
                                                             Refer to Slide 25 for additional details and disclosures.
Dividend Increase

                                                                                                                                            $2.68
                                                                                                              $2.42          $2.54
                                                                                $2.14           $2.21
                                                   $1.94          $2.00
                     $1.64          $1.65
      $1.49                                                                                  $1.23
                                                                              $1.16
                                                               $1.06                        Dec ‘19
                                  $0.88         $0.97                        Dec ‘18
                  $0.80                                       Dec ‘17
 $0.74                           Dec ‘15       Dec ‘16
Dec ‘13          Dec ‘14                                                        54%           56%
                                                                               payout        payout

       2014           2015           2016           2017          2018           2019E         2020E          2021E          2022E          2023E
                                                        (1)
                                      Ongoing EPS                              Indicated Annual Dividends

        • Board increased common dividend by $0.07 to indicated annual rate of
          $1.23 per share
           • Represents 6% increase, consistent with earnings growth target
           • Continue to target midpoint of 50% – 60% payout ratio
        • 10th consecutive increase since 2012
        • Next dividend review in December 2020
           • Expect future increases to be in alignment with targeted
             earnings growth (5-6%)
                                                                                                                                                         12
(1)   2014 – 2018 Ongoing EPS reflects actual results; 2019-2020 reflects ongoing earnings guidance, 2021-2023 reflects midpoint of earnings potential
Questions & Answers
Appendix
San Juan Abandonment, Securitization and Replacement Power

                 ● Requests                                                 ● $283M undepreciated                                      ● Recommended
  Abandonment

                                                                                                                   Replacement Power
                                                           Securitization
                    abandonment of San                                        investment in San Juan,                                    scenario balances
                    Juan coal plant after                                     proceeds available to                                      environment, cost and
                    participation                                             fund replacement                                           reliability
                    agreement and coal                                        power                                                    ● 350MW solar drives
                    supply contracts end                                    ● $29M decommissioning                                       62% reduction in
                    June 30, 2022                                             and reclamation costs                                      carbon emissions
                                                                            ● $20M job training and                                    ● 130MW battery
                                                                              severance costs                                            storage capacity
                                                                            ● $20M economic                                              responsibly integrates
                                                                              development funds                                          new technology
                                                                            ● $9M financing costs                                      ● 280MW natural gas
                                                                                                                                         peaking plants(1)
                                                                            Total $361M securitization                                   ensure reliability
                                                                                                                                         during energy
                                                                                                                                         transition, provides
                                                                                                                                         San Juan property tax
                                                                                                                                         base

                                                                                                                                       Total $298M investment

                                                                                                                                                            15
(1)   The natural gas peaking plants are proposed with a useful life through 2040, consistent with PNM’s 2040 goal of zero carbon emissions
NMPRC Commissioners and Districts

                                                                 Term
      District              Name                                             Party      NMPRC Districts and
                                                                 Ends
                                                                                         PNM Service Areas
      District 1            Cynthia Hall                         2020(1)   Democrat
      District 2            Jefferson Byrd                       2022(1)   Republican
                            Valerie Espinoza,
      District 3                                                 2020      Democrat
                            Vice-Chairman
                            Theresa Becenti-Aguilar,
      District 4                                                 2022(1)   Democrat
                            Chairman
      District 5            Stephen Fischmann                    2022(1)   Democrat
     (1) Eligible   for re-election to a second four-year term

2019 Legislative Update – Appointed vs Elected:
• A Senate Joint Resolution was passed in the New Mexico legislature to
  include a state constitutional amendment on the ballot in the next
  general election (2020) to move to a 3-member, appointed Commission
• If the amendment is passed by a simple majority:
   • The legislature defines the nominating committee and the
      requirements for Commissioners
   • The terms for Commissioners elected in Districts 1 and 3 in 2020 will
      be for a two-year term ending in 2022; the terms for Commissioners
      in Districts 2, 4 and 5 already expire in 2022
   • Three appointed Commissioners would begin new staggered terms                                            16
      on January 1, 2023
PNM Guidance (Ongoing)

                                PNM Ongoing EPS
                                        $1.63 - $1.65             $1.67 - $1.73
          $1.54

         2018                                2019E                     2020E
                                                                2019 vs 2020
         Key Year-over-Year EPS Performance Drivers
                                                                  Changes
        Retail load                                               $0.02 – $0.05
        2020 leap year impact                                         $0.01
        FERC transmission margin                                  $0.03 – $0.05
        Renewable rider                                               $0.02
        AFUDC                                                     $0.00 – $0.01
        Outage cost decreases                                     $0.06 – $0.08
        Decommissioning/reclamation trust income, net of fees    ($0.02) – $0.00
        Interest expense increases                               ($0.02) – $0.00
        2019 weather                                                 ($0.02)
        O&M increases                                           ($0.04) – ($0.02)
        Depreciation and property tax                           ($0.09) – ($0.06)

                                                                                    17
TNMP Guidance (Ongoing)

                           TNMP Ongoing EPS
                                        $0.70 - $0.71                 $0.72 - $0.74
         $0.65

         2018                              2019E                         2020E
                                                         2019 vs 2020
           Key Year-over-Year EPS Performance Drivers
                                                           Changes
           Rate relief (TCOS/DCOS)                       $0.15 – $0.20
           Load                                          $0.05 – $0.06
           2019 weather                                     ($0.04)
           O&M increases                                ($0.04) – ($0.02)
           Interest expense increases                   ($0.02) – ($0.01)
           Depreciation and property tax                ($0.12) – ($0.08)

                                                                                      18
Corporate and Other Guidance (Ongoing)

                  Corporate and Other Ongoing EPS

       ($0.19)                     ($0.21) – ($0.20)               ($0.23) – ($0.21)

        2018                             2019E                            2020E

                                                             2019 vs 2020
               Key Year-over-Year EPS Performance Drivers
                                                               Changes

               Interest expense                             ($0.02) – ($0.01)

                                                                                       19
2020 Assumptions

                  amounts shown are before tax                                                           2020E
                 PNM
                   Weather                                                                             $0 (normal)
                   Retail Load                                                                         1% = $0.03
                   Outage costs                                                                       $11M - $13M
                   Decommissioning/reclamation trust income, net of fees                              $15M - $17M
                   Anticipated Ongoing effective tax rate (Statutory rate = 25.4%)
                                                                                                          25.3%
                      before amortization of excess deferred income taxes
                   Amortization of excess deferred income taxes                                          $21.4M
                 TNMP
                   Weather                                                                            $0 (normal)
                                                                                                      1% = $700k
                     Demand-Based Load
                                                                                                    ($0.01 rounded)
                     Anticipated Ongoing effective tax rate (Statutory rate = 21.0%)
                                                                                                          23.6%
                     before amortization of excess deferred income taxes
                   Amortization of excess deferred income taxes                                           $9.2M
                 Consolidated PNM Resources
                   Anticipated Ongoing effective tax rate(1)
                     before amortization of excess deferred income taxes                                  24.4%
                     (Corporate/Other statutory rate = 25.4%)

                 Average PNM Resources diluted shares outstanding                                          80M

                                                                                                                                    20
(1) Reflects effective tax rate for consolidated taxpayer, consolidating tax adjustments reflected in Corporate and Other segment
PNM Scheduled Plant Outages

           San Juan                       Four Corners                       Palo Verde

          Duration         Time            Duration        Time              Duration      Time
Unit                               Unit                               Unit
           in Days        Period            in Days       Period              in Days     Period
   No planned outages in 2020       5         76         Q1-Q2 2020    2        30        Q2 2020
                                    4         12          Q2 2020      1        44        Q3 2020

                                                                                            21
EBITDA and Quarterly Earnings Distribution Guidance (Ongoing)

                                 Ongoing EBITDA
                                  (In millions)
                                     2019E Midpoint     2020E Midpoint
       Consolidated PNM Resources         $573               $603
       PNM                                $377               $390
       TNMP                               $176               $189

                2020 Quarterly Ongoing Earnings Distribution

                                                  58%
                           21%                                      14%
       7%

       Q1                   Q2                    Q3                 Q4

                                                                          22
2019 – 2023 Investment Plan

                                 $3.9B investment plan results in 9.6% rate base growth
                                                                         $991
                                                                 $21

                                                 $818                     $177
                                           $27
                                           $27
                                                                                                                                      $771
                                                                                                                              $25
                                                 $48                                                    $694                            $68
                 $22
                         $641                    $109                     $268
                                                                                               $21
                 $37
                                                                                                         $72                           $128
                          $53                    $94                                                     $77
                          $60                                               $82
                                                 $176                                                   $182                           $202
(in millions)

                         $99
                                                                          $173
                        $125
                                                                                                                                                   $345
                                                                                     $306                $342       $322
                                                 $337   $275                                                                           $348
                         $245       $255                                   $270

                         2019                    2020                     2021                          2022                          2023
                TNMP                                    PNM T&D                                           PV Lease Purchases/Other Replacement Power (3)
                PNM Existing Generation                 PNM Renewable Additions                           PNM Transmission Expansion(2)
                SJGS Replacement Power                  50% NMRD Renewable Additions                      Business Technology Services/General Services
                Depreciation (1)
 Targeted 2018-2023 Rate Base CAGR (2018 base): Total 9.6% / PNM 6.6% / TNMP 17.3%
(1) Depreciation does not include amounts associated with NMRD
(2) Western Spirit acquisition of $285M reflects assumed purchase price of $360M, net of $75M customer funding                                     23
(3) For Palo Verde leases that expire in 2023, capex assumes either the purchase of the leases or replacement of the power through new resources
TNMP Investment Plan

  2020 Key Capital Projects
  • A group of transmission lines and substations in
    northern West Texas will be upgraded from 69kv to
    138kv to support growth in that region;
  • In the Gulf Coast, a 138kV transmission line upgrade     TNMP Investment Plan by Region
    will be completed to help with transmission
    contingency issues and support the interconnection                                   North/
                                                                                     Central TX ~31%
    of a new gas-fired power plant;                          West Texas
  • Begin the replacement of our AMI meters to be              ~44%
    compatible with current network capabilities

  TNMP Demand
  • Texas is the largest energy-producing state and the
    largest energy-consuming state in the nation(1)                                          Gulf Coast
                                                                                               ~25%
  • ERCOT summer peak demand projected to grow by              ● TNMP Service Area
    ~20% over next 10 years(2), extensive regional
    studies call for increased transmission infrastructure
    to support reliability and growth, particularly in
    West Texas
(1)   Source: Energy Information Administration (EIA)
                                                                                                24
(2)   Source: ERCOT 2019-2028 forecast
2020 - 2023 Potential Earnings Power

                                                    2020 Ongoing Earnings                        2021 Earnings                    2022 Earnings                    2023 Earnings
                                 Allowed
                                 Return /       Guidance Midpoint                                  Potential                        Potential                        Potential
                                  Equity Avg Rate                                         Avg Rate                          Avg Rate                         Avg Rate
                                  Ratio            Return      EPS                                            EPS                               EPS                              EPS
                                           Base                                             Base                              Base                             Base
                                9.575% /
PNM Retail(1)                                  $2.5 B       9.5%            $1.47           $2.5 B           $1.52            $2.4 B           $1.48           $2.4 B           $1.48
                                  50%
San Juan                        9.575% /
                                                                                                                             $150 M            $0.09          $280 M            $0.17
Replacement(2)                    50%
                                9.575% /
PNM Renewables(3)                              $150 M      9.575%           $0.09          $145 M            $0.09           $140 M            $0.08          $130 M            $0.07
                                  50%
PNM FERC(4)                    10% / ~50% $340 M            7.5%            $0.15          $530 M         $0.26-$0.30        $740 M        $0.37-$0.42        $780 M        $0.39-$0.44
Items not in Rates(5)                                                      ($0.01)                      ($0.03)-($0.01)                  ($0.03)-($0.01)                   ($0.03)-($0.01)
     Total PNM                                 $3.0 B                       $1.70           $3.2 B        $1.84-$1.90         $3.5 B       $1.99-$2.06         $3.6 B       $2.08-$2.15
                                 9.65% /
TNMP(6)                                        $1.3 B       9.65%           $0.73           $1.5 B           $0.84            $1.6 B           $0.89           $1.9 B           $1.02
                                   45%
Corporate/Other(7)                                                         ($0.22)                      ($0.21)-($0.19)                  ($0.19)-($0.17)                   ($0.23)-($0.21)

Equity Financing Plans(8)                                              ($0.01)-$0.00                    ($0.10)-($0.09)                  ($0.20)-($0.19)                   ($0.24)-($0.23)
Total PNM Resources                            $4.3 B                  $2.20 - $2.21        $4.7 B       $2.37 - $2.46        $5.1 B      $2.49 - $2.59        $5.6 B       $2.63 - $2.73
(1) Average  rate base has been reduced by approximately $130M to represent ($0.05) of Earnings Potential for the lost equity return on Four Corners investment determined in the 2018 general
    rate review. 2022 and 2023 rate base also reflects the removal of $283M undepreciated SJGS investment upon its retirement in mid-2022 to be recovered through securitization.
(2) Replacement Power includes $298M investment implemented mid-2022; $278M of generation investment and $20M of transmission investment.
(3) PNM Renewables reflect assets collected through the Renewable Rate Rider.
(4) PNM FERC in 2021-2023 reflects a return of 8%-9% to account for Western Spirit investment recovered through incremental rates.
(5) Consists primarily of decommissioning/reclamation trust income (net of fees/taxes), AFUDC, certain incentive compensation, and the 65MW ownership of San Juan Unit 4 (prior to retirement).
(6) TNMP earnings include additional recovery for Energy Efficiency, along with items excluded from rates (primarily AFUDC) and interest savings from the refinancing of existing debt.
(7) Corporate/Other includes the earnings impacts associated with short and intermediate term bank debt and the 50% equity interest in NMRD.
(8) Equity Financing Plans to fund capital growth reflect financing alternatives, including block sale of up to $290M (dilution impacts assume

    $50M issued in 2020, $90M to $140M in 2021, $50M in 2022 and $50M in 2023), and $300M mandatory convertibles beginning mid-2021.
                                                                                                                                                                                 25
                            This table is not intended to represent a forward-looking projection of 2021 - 2023 earnings guidance.
Liquidity and Debt Maturity Outlook

                                                                                       Long-term Debt Maturities
 Maintain appropriate                                                                          (in millions)                     $658
    credit metrics
                                                                        $140                $450                               $1,003
                                                          $35
                                                                        $350                $346               $57
     Remain a solid
   investment grade                                                     2020                2021               2022        2023 and Beyond
                                                                                   PNM          TNMP           Corporate
     rated company
                                                                 • Equity issuances of up to $590 million through forward block
Target regulatory capital                                          and/or mandatory convertibles are projected to fund 2020 -
                                                                   2023 expenditures
   structures at PNM                                             • New debt issuances projected at utilities through 2023 of
       and TNMP                                                    ~$800 million and $361 million securitization bonds

                                     Moody’s                        S&P
                                  Rating/Outlook               Rating/Outlook          PNM Resources FFO-to-Debt is maintained
    PNM Resources                  Baa3(1) / Stable       BBB+(1) / Negative             within Moody’s Baa investment grade
                                                                                              target range of 13% to 22%
    PNM                            Baa2(2) / Stable       BBB+(2) / Negative
    TNMP                            A1(3) / Stable             A(3) / Negative
   (1) Issuer
                                                                                                                                        26
                rating   (2)   Senior unsecured rating   (3)   Senior secured rating
You can also read