AMAZON HQ2: Amazon's Near-Term Impact on the Queens and New York City Real Estate Market January 2019 - TCN Worldwide

Page created by Amy Hamilton
 
CONTINUE READING
AMAZON HQ2: Amazon's Near-Term Impact on the Queens and New York City Real Estate Market January 2019 - TCN Worldwide
A whitepaper by Barbara Byrne Denham

AMAZON HQ2:
Amazon’s Near-Term Impact on the Queens
and New York City Real Estate Market
January 2019

                                       www.reis.com
AMAZON HQ2: Amazon's Near-Term Impact on the Queens and New York City Real Estate Market January 2019 - TCN Worldwide
www.reis.com

                       By Barbara Byrne Denham

Amazon’s Near-Term Impact on the Queens
and New York City Real Estate Market
January 2019
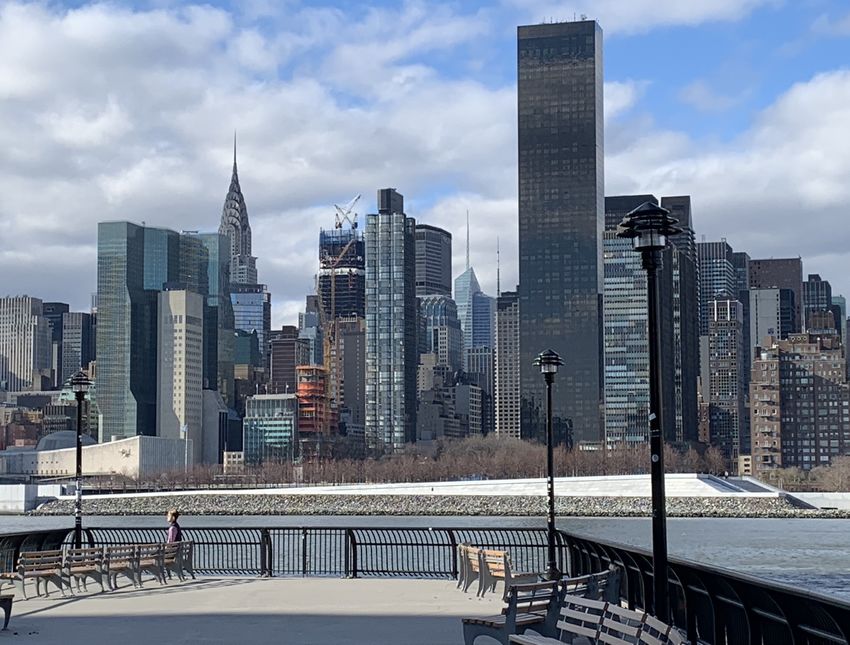
                                                        The suspense is over, and the uproar has begun: Amazon’s selection of
                                                        Long Island City for one of its two new headquarters – along with Crystal
                                                        City, VA – has many locals and New York City officials concerned about the
                                                        impact on the neighborhood. The waterfront Queens neighborhood has
                                                        not seen a corporate relocation of this size ever, even though a number
                                                        of companies have moved to the neighborhood including Jet Blue and
                                                        Ralph Lauren. Many worry that the new behemoth occupant will boost
                                                        neighboring apartment rents and condo/co-op prices as well as office
                                                        rents for the small businesses that have set up shop in Queens.

                                                        While these concerns are valid, our real estate data shows that the impact
                                                        may not be as severe as so many fear. This is due to the fact that Queens,
                                                        Brooklyn and Manhattan have tremendous construction underway for both
                                                        multifamily and office. Reis tracks all commercial real estate construction
                                                        projects including those mentioned in the media that have not had a
                                                        permit filed. Aggregating this comprehensive data and incorporating the
                                                        new Amazon occupancy into our baseline forecasts, we have analyzed the
                                                        short-term impact of the first few years of Amazon’s coming occupancy.
                                                        Our forecasts go to 2022 and assume 8,200 Amazon employees will be
                                                        added from 2019 to 2022: 7001 in 2019 and approximately 2,500 per year
                                                        from 2020 to 2022.

                                                        The analysis herein is based on our current forecasts of expected
                                                        construction that include details from 1,650 separate residential
                                                        construction projects that Reis is tracking for the apartment market as well
                                                        as for condominiums/coops and affordable housing. Likewise, our office
                                                        analysis includes details from 160 pending office construction projects.

                                                        We are intentionally keeping the analysis short-term and releasing it
                                                        now because we want to show how both the apartment market and the
                                                        office market can absorb these added employees under the current set
                                                        of circumstances. Our construction forecast includes 21,000 apartment

                                                        1
                                                         As per https://www.wsj.com/articles/amazon-executives-city-official-defend-hq2-deal-11544660882

                                                                      Barbara Byrne Denham is a Senior Economist in the research and economics
                                                                      department at Reis, the team responsible for the firm’s market forecasting, valuation,
                                                                      and portfolio analytics services. Throughout her 20-year career, Barbara has written a
                                                                      number of white papers on the commercial real estate market.

 ©2019 Reis, Inc. Any use of this document or portions thereof, including reproduction, modification, distribution or republication, without the prior written
 consent of Reis, is strictly prohibited.
www.reis.com

units planned for Queens, Manhattan, Brooklyn and the Bronx over the next four years as well as 10,000 condominiums
and 7,300 affordable units planned for the four boroughs – all based on permits that have been filed and Reis research.

For the office market, Hudson Yards alone is expected to add 4.5 million square feet of space through 2019 as well as
another 7.6 million square feet from 2021 to 2022. More office projects are underway in Brooklyn and Queens as we
discuss herein.

In the coming months and years, developers will file more permits to build both office and multifamily in the City, spurred
by the Amazon announcement. More office and apartment supply will ease the expected rent growth for Queens and the
City. Yet we wanted to show that there is already significant construction underway such that the impact from Amazon’s
added jobs will only raise apartment occupancy and rents by – at most – an average of 3.1% per year in 2020 through
2022 above what they would have otherwise increased by, which was 2.1% per year on average. For the office market,
office occupancy and rents in Queens will not be impacted directly by the Amazon occupancy until 2022 when the
company will outgrow its space in One Court Square. Office rents in Queens could increase by 5.0% above what they
would have grown by in 2022 without the added employees, which was 1.4%. Manhattan’s office rent is forecasted to
grow by 1.1% in 2022.

These projections are based on Reis’s current forecasts of future supply and future demand for both apartment and
office space as well as on a set of assumptions concerning how many Amazon employees will rent versus own and how
many will remain in the City.

APARTMENT MARKET IMPACT

The immediate 8,200 Added Amazon Employees will Raise Apartment Occupancy Rates over the Next Few
Years as well as Rents, but Rent Growth was Expected to Decelerate Rapidly Prior to Amazon’s Announcement
as Apartment Vacancy was Expected to Increase.

New York City has seen significant
                                                                                      Apartment Construction
new construction of apartments in
                                                             35,000
recent years, particularly in Brooklyn
and Queens. The chart to the right                           30,000
listing added apartment units shows
                                                             25,000
how more units have been added
over the last eight years than were                          20,000
                                                     Units

added in previous decades. This data
                                                             15,000
only includes market rate properties
of 40 units and above. The chart also                        10,000

shows that another 26,700 units will                          5,000
be added in 2018 through 2022 based
                                                                 -
on projects for which a permit has
                                                                           1990s              2000s           2010-2017           2018-2022          Unspecified
been filed. Finally, the “unspecified”
category includes proposed units of                                   Manhattan                 Brooklyn                  Queens                  Bronx

construction based on what Reis has                           *Includes all market rate apartments in properties of 40 units and above as well as
been tracking in the media. Queens                            market rate units in mixed income properties.
                                                              Source: Reis, Inc.

  ©2019 Reis, Inc. Any use of this document or portions thereof, including reproduction, modification, distribution or republication, without the prior written
  consent of Reis, is strictly prohibited.
www.reis.com

                         alone has 16,560 units in proposed projects while Brooklyn has 29,600 units.

                         It is important to note that Queens and Brooklyn have seen disproportionately more construction over the last eight
                         years than Manhattan and will continue to see disproportionately more.

                         Prior to the Amazon announcement, Reis had released its forecast for expected apartment supply as well as expected
                         apartment occupancy and rent growth for 2019 through 20222. Our occupancy and rent growth forecasts incorporate
                         a number of variables including expected population growth, expected employment growth, expected household
                         formation growth and expected household income growth3. Note that our baseline forecast had projected a steady
                         deceleration in occupancy growth (apartment demand) against a “hard” forecast for strong construction growth
                         (supply). The deceleration in demand was due to the expectation of slower yet still positive job growth in New York City
                         and across the U.S. Combining lower demand with higher supply yielded our baseline forecast of rising vacancy rates
                         along with slowing rent growth.

                         Using these baseline forecasts and adding 700 employees in 2019 as well as 2,500 employees4 per year from 2020
                         to 2022 on top of the current projections, we forecast the impact of the added Amazon employees on 2019 to 2022
                         vacancy rates and rent growth holding all other variables constant5.

                         Note that our forecasts for the charts below are arguably aggressive in that they assume that the newly employed
                         Amazon workers will lease a market rate apartment in a property of 40 units or above at a rate of 2 units for every three
                         jobs4. This is aggressive because 68% of the Queens housing stock is in properties with fewer than 20 units. In Brooklyn,
                         Manhattan and the Bronx, half of the total housing stock is in properties with fewer than 20 units. [See Appendix A: New
                         York Housing Stock by Units in Property].

                         Adding the extra units of occupancy growth to our baseline absorption statistics along with our current construction
                         forecasts yields lower vacancy rates in the four boroughs as per the charts below.

                                                                  Queens Apartment Market Supply, Demand and Vacancy
                                                                                                                                                                       12%                                             12%
                                                   Completions                                                                       3,500
                                                                                                                                  3,500

                                                   Net Absorption                                                                 3,000                                                                                10%
                                                                                                   Units: Completed or Occupied

                                                                                                                                    3,000                              10%
Units: Completed or Occupied

                                                   Net Absorption WITH Amazon
                                                                                                                                  2,500
                                                   Vacancy Rate                                                                                                                                                        8%
                                                                                                                                    2,500
                                                                                                                                                                       8%
                                                   Vacancy Rate WITH Amazon                                                       2,000                                                                                        Vacancy Rate
                                                                                                                                                                                                                       6%
                                                                                                                                    2,000
                                                                                                                                  1,500                                6%
                                                                                                                                                                                                                       4%
                         Note how for Queens, the vacancy rate                                                                       1,500
                                                                                                                                  1,000
                         will rise to 10% in 2019 and was expected                                                                                                     4%
                                                                                                                                                                                                                       2%
                         to fall slightly to 8.4% but instead will                                                                  1,000
                                                                                                                                   500

                         drop to 4.4% by 2022, which is close to                                                                     0                                 2%                                              0%
                                                                                                                                      500
                         where it was in 2016.                                                                                            2000 2002 2004 2006 2008 2010 2012 2014 2016 2018 2020 2022
                                                                                                                                                                                                  Source: Reis, Inc.
                                                                                                                                          0                            0%
                               2
                                   Founded in 1980, Reis’s data for apartment and office trends and forecasts dates to the 1980s.
                               3
                                   Reis has historically obtained the projections for these four variables from Moody’s/Economy.com.
                               4
                                   For the 700 employees added in 2019 and 2,500 employees added annually in 2020 through 2022, we assumed that 75% would rent over buying. Of these, 85% will rent within the four
                                   boroughs included herein such that 35% will choose to live in Manhattan, 35% in Queens, 25% in Brooklyn and 5% in the Bronx. We assume a one-to-one occupancy in that every added
                                   employee will yield one unit of occupancy growth. These assumptions yield an added annual occupancy growth of 558 units for Manhattan and Queens, 398 units for Brooklyn and 80 units
                                   for the Bronx in 2020 through 2022.
                               5
                                   This analysis does not include any indirect or induced impact. In other words, we did not incorporate other new employment growth that Amazon will generate for ancillary businesses such
                                   as restaurants, real estate firms, dry cleaners, etc.

                               ©2019 Reis, Inc. Any use of this document or portions thereof, including reproduction, modification, distribution or republication, without the prior written
                               consent of Reis, is strictly prohibited.
www.reis.com

                                                                                BrooklynBrooklyn
                                                                                         Apartment Market
                                                                                                    Apartment Market Supply, Demand and Vacancy
                                                                               Supply, Demand and Vacancy
                                                                                                                                                   6,000                                                                                          10%
                                                                                                               6,000                                                10%
                                                                                                                                                                                                                                                  9%

                                                                                                                    Units: Completed or Occupied
                                                                                                                                                                    9%
                                                                           Completions                                                             5,000
                                                                                                               5,000                                                                                                                              8%
                                                                           Net Absorption                                                                           8%
                                                                           Net Absorption WITH Amazon                                                                                                                                             7%
                                                                                                                                                   4,000            7%
                                                                                                               4,000

                                                                                                                                                                                                                                                        Vacancy Rate
                                                                           Vacancy Rate                                                                                                                                                           6%
                                                                                                                                                                    6%
                                                                           Vacancy Rate WITH Amazon
                                                                                                                                                   3,000                                                                                          5%
Units: Completed or Occupied

                                                                                                               3,000                                                5%

                                                              Brooklyn’s vacancy rate will fall to                                                                  4%                                                                            4%
                                                              5.5% after rising to 8.4% in 2019. It is2,000                                        2,000
                                                                                                                                                                    3%                                                                            3%
                                                              currently 8.1%.                                                                                       2%                                                                            2%
                                                                                                               1,000                               1,000
                                                                                                                                                                    1%
                                                                                                                                                                                                                                                  1%
                                                                                                                       0                                            0%
                                                                                                                                                      0                                                                                           0%
                                                                                                                                        2000
                                                                                                                                        2003
                                                                                                                                        2006
                                                                                                                                        2009
                                                                                                                                        2012
                                                                                                                                        2015
                                                                                                                                        2018
                                                                                                                                        2021

                                                                                                                                                           2000     2003      2006       2009                 2012    2015    2018    2021
                                                                                                                                                                                                                             Source: Reis, Inc.

                                                                                Manhattan and Bronx Apartment Market Supply, Demand and Vacancy

                                                                6,000                                                                                                                    6%
                               Units: Completed or Occupied

                                                                5,000                                                                                                                    5%

                                                                4,000                                                                                                                    4%
                                                                                                                                                                                              Vacancy Rate

                                                                3,000                                                                                                                    3%

                                                                2,000                                                                                                                    2%                  The Manhattan vacancy rate will fall to
                                                                                                                                                                                                             3.4% from 4.8% where it was expected to
                                                                1,000                                                                                                                    1%                  be prior to the Amazon decision. Finally,
                                                                                                                                                                                                             the Bronx will see a decline to 4.8%; it
                                                                   0                                                                                                                     0%                  was expected to hold steady at 6.0%.
                                                                        2000   2002   2004   2006     2008   2010                 2012              2014    2016   2018    2020   2022
                                                                   Source: Reis, Inc.

                                                              What the charts above show is that the significant construction underway can accommodate the added Amazon
                                                              employees in the near term. Although the trend lines above suggest that vacancy will drop considerably beyond 2022,
                                                              developers will likely act on the already “unspecified” construction projects shown in the “Apartment Construction” chart
                                                              on page two. That is, developers will start to file permits in the coming years which will boost the supply of apartments,
                                                              keep vacancy steady and ease rent growth.

                                                              Note that these projections do not take the added condominium or affordable units into account. [See Appendix B for
                                                              Expected Condominium/Co-op and Subsidized Housing Under Construction]. In other words, we made aggressive
                                                              assumptions and erred on the side of assuming that most of the employees will demand market-rate rentals in the larger
                                                              properties even though more condos will be built in the area and other rental properties with fewer than 40 units will be
                                                              added along with subsidized housing. Nevertheless, we aggressively assume that more will choose to rent in the City, and
                                                              those who do so will rent in the large properties that Reis tracks.

                                                                ©2019 Reis, Inc. Any use of this document or portions thereof, including reproduction, modification, distribution or republication, without the prior written
                                                                consent of Reis, is strictly prohibited.
www.reis.com

The added demand from Amazon employees will                                                                                                   Apartment Effective Rent Growth Rate
likely push rents up, but rent growth was expected to                                                                                                 Trend and Forecast
                                                                                                                                                        (current vs with Amazon)
decelerate over the next few years because the new
construction was expected to exceed apartment                                                                         11%
demand. Adding the occupancy growth rate from                                                                                 9%
                                                                                                                                              11%

                                                                                              Year-over-year growth
the Amazon employees to the baseline rent growth                                                                                              9%

                                                                                                                      Year-over-year growth
                                                                                                                              7%
forecasts, we anticipate rents to grow as per the chart                                                                                       7%
                                                                                                                              5%
on the right.                                                                                                                                 5%
                                                                                                                              3% 3%

Average rents in Queens would increase by 6.9%                                                                                1% 1%
by 2022 instead of decelerating to a rate of 2.1%         -1%-1%
as estimated before Amazon’s announcement. In             -3%-3%
Brooklyn, rent growth would rise to 5.0% in 2022; our     -5%-5%
                                                                  2010          2013           2016        2019         2022
previous estimate for Brooklyn was 2.0% in 2022. In            2010            2013            2016         2019           2022
Manhattan, rent growth would be 3.7% versus 2.3%                    Brooklyn         Manhattan      Queens        Bronx

in 2022. Finally, in the Bronx, rent growth would rise to           Brooklyn *       Manhattan*     Queens*       Bronx*

3.9% vs. 2.1% as previously forecasted. Again, these                                                             Source: Reis, Inc.
estimated rent growth rates represent a maximum.
They are based on aggressive assumptions of occupancy demand from the Amazon employees along with current new
construction forecasts. We fully expect developers to build more apartments than we currently have forecasted, which
would ease rent growth.

OFFICE MARKET IMPACT
Amazon’s added Jobs will Not Have a Substantial Impact on the New York Office Market in the Near Term due
to Significant Office Construction Underway. It Will Boost Occupancy and Office Rents in Queens in 2022 but
Not in Manhattan or Brooklyn.
In one of the largest office markets in the world, New York City has close to 400 million square feet of for-lease office
inventory. Adding owner-occupied space puts the total inventory close to 500 million square feet.

Included in that number, Queens has over 11 million square feet of for-lease office inventory while Brooklyn has another 17
                                                                           million square feet. The current office vacancy
                    New Office Construction                                rate in Queens is 8.7%, slightly higher than
8,000,000                                                                  Manhattan’s office vacancy rate of 8.1% and
                                                                           lower than that in Brooklyn – 10.7%6.
7,000,000

6,000,000                                                                                                                                             Office Supply is Expected to Soar
5,000,000
                                                                                                                                                      Prior to Amazon’s entry to Queens, the office
4,000,000                                                                                                                                             vacancy rates were expected to increase
3,000,000                                                                                                                                             given all of the construction underways (left
                                                                                                                                                      chart). In 2019 alone, the three boroughs are
2,000,000
                                                                                                                                                      expected to add 12.3 million square feet of
1,000,000                                                                                                                                             inventory – enough to support an addition of
           -                                                                                                                                          84,000 to 123,000 office jobs7 or even more
                          2018                     2019                 2020-2022                         Unspecified                                 given the trend of leasing fewer square feet
                                                                                                                                                      per employee8.
               Bronx                  Downtown                Brooklyn                  Midtown South

               Queens                 Midtown                 Hudson Yards

          Source: Reis, Inc.
  6
      It should be noted that these vacancy rates are close to half of the national vacancy rate, which is 16.6%.
  7
      Based on an average of 100 to 150 square feet per employee.
  8
      See Reis’s paper on the Shrinking Office Footprint https://www.reis.com/the-shrinking-office-footprint/

  ©2019 Reis, Inc. Any use of this document or portions thereof, including reproduction, modification, distribution or republication, without the prior written
  consent of Reis, is strictly prohibited.
www.reis.com

  Demand was Expected to Decelerate
                                                                                                                  Office Employment Growth by Borough
  At the same time, office employment was
                                                                                                                 45,000
  expected to decelerate considerably in the

                                                                                    New York Office Job Growth
                                                                                                                 40,000
  next few years. In 2018, New York City’s office
  employment growth slowed to 17,100 jobs                                                                        35,000
  from an average of 33,700 office jobs added                                                                    30,000
  per year in the prior five years. In Queens,                                                                   25,000
  office employment had averaged 1,800 per                                                                       20,000
  year from 2013 through 2017, but it fell to 300                                                                15,000
  in 2018 based on data through June. [For                                                                       10,000
  more details, See Appendix C: Employment                                                                        5,000
  Growth by Borough].                                                                                                   -
                                                                                                                               2011     2012   2013    2014      2015   2016   2017   2018*
  One could argue that Amazon’s new HQ
  in New York is timed perfectly to bolster                                                                              Bronx and Staten Island      Brooklyn     Manhattan     Queens
  the economy just as it is losing steam.
                                                                                                         *For NYC five boroughs, 2018 growth equals the average office employment for
                                                                                                         January through June of 2018 less the January-through-June average in 2017.
  OFFICE IMPACT ON QUEENS                                                                                Source: Bureau of Labor Statistics

  At least three office projects are under construction in Queens including The JACX at 28-07 Jackson Avenue9, 25-11
  49th Avenue10, and 9-03 44th Road. These projects are expected to add more than 1.5 million square feet of office space,
  enough to accommodate approximately 10,000 to 15,000 employees11. WeWork has preleased 238,000 square feet of
  this space and Bloomingdales has leased 550,000 square feet, moving employees from various offices in Manhattan12.
  Separately, Amazon’s first employees are expected to move into One Court Square where Amazon has signed a letter of
                                                                  intent to lease 1 million square feet before redeveloping
                      Office Vacancy Rates                        the Plaxall site on the Anable Basin.

13%                                                                                                                                As Amazon moves into its 1-million-square-foot
                                                                                                                                   occupancy at One Court Square, Citigroup who
12%
                                                                                                                                   currently occupies the space is expected to move
11%                                                                                                                                1,10013 of its 3,000 employees to Manhattan. In July
10%                                                                                                                                2018, before Amazon announced its plans, media
                                                                                                                                   reports of Citigroup’s “methodical consolidation of
9%
                                                                                                                                   space” included the 1 million square feet of vacancy
8%                                                                                                                                 at One Court Square14. Thus, Citigroup’s moving of
7%                                                                                                                                 employees to its Manhattan properties is not expected
                                                                                                                                   to have any impact on Manhattan’s office statistics.
6%

5%                                                                                                                                 With an added 700 office jobs in 2019 and 2,500 office
4%
                                                                                                                                   jobs per year from 2020 to 2022 in Queens, Amazon’s
      2008          2010        2012         2014         2016        2018          2020                                2022       total occupancy will likely fill the leased One Court
                                                                                                                                   Square space by 202115 with its first 6,667 employees.
                  Brooklyn       Manhattan          Queens       Queens with Amazon
                                                                                                                                   It will need to lease 230,000 square feet of space in
  Source: Reis, Inc.                                                                                                               2022 for the remaining 1,533 employees. This added

      9
          https://thejacx.com/ and http://liccourtsquare.com/2018/03/28/south-tower-begins-to-rise-at-28-07-jackson-avenue/
                                                                       13%
      10
                                                                      12%
           https://www.normandyrealty.com/project/gantry-point-25-11-49th-avenue/
      11
           Assumes 100 to 150 square feet per employee.
                                                                       11%
                                                                       10%
      12                                                              9%
           https://nypost.com/2017/11/07/bloomingdales-is-moving-1k-workers-to-queens/
      13                                                                 8%
           https://www.marketwatch.com/story/citi-to-move-1100-workers-out-of-long-island-city-tower-to-free-up-space-for-amazon-2018-11-13;
                                                                        7%                                                                   https://commercialobserver.com/2018/11/
                                                                        6%
           amazon-finalizes-plans-for-1m-square-feet-at-one-court-square-in-long-island-city/
      14                                                                  5%
           https://nypost.com/2018/07/23/citi-consolidation-opens-a-million-square-feet/
      15
                                                                         4%
           Assuming 150 square feet per employee.
                                                                               2008                              2010       2012     2014   2016   2018    2020    2022
      ©2019 Reis, Inc. Any use of this document or portions thereof, including reproduction, modification, distribution or republication, without the prior written
      consent of Reis, is strictly prohibited.
www.reis.com

occupancy will lower the Queens office vacancy
rate to 8.6% from 10.3% in 2022.
                                                                                                              Office Rent Growth Rates
                                                                                        7.5%
In short, the additional Amazon employees will
have a negligible impact on the office market                                           5.0%
statistics in the first few years. This is based on                                     2.5%
the fact that the expected supply in Queens,
Brooklyn and Hudson Yards will flood the market                                         0.0%
with added space. [See Appendix D for details                                           -2.5%
                                                                                        7.5%
on office construction by borough]. Moreover,                                           5.0%
                                                                                        -5.0%
                                                                                        2.5%
Amazon is eventually expected to build a new                                            0.0%
campus in the converted Plaxall building and                                           -2.5%
                                                                                        -7.5%
                                                                                       -5.0%
parcel that surrounds Anable Basin on the Long                                         -7.5%
                                                                                      -10.0%
                                                                                       -10.0%
Island City waterfront as well as the current NYC                                     -12.5%
                                                                                      -15.0%
Department of Education building at 44-36                                              -12.5%
                                                                                                2008       2010         2012        2014         2016         2018         2020   2022
Vernon Boulevard16.                                                                   -15.0%
                                                                                                2008        2010         2012        2014         2016         2018        2020   2022
Amazon’s need for added space in 2022 will
likely push the Queens office rent growth up                Brooklyn     Manhattan  Queens      Queens with Amazon
to 6.4% that year. This is proportionate to the                                                    Source: Reis, Inc.
occupancy growth from Amazon in 2022 outside
of One Court Square. Because of the expected heavy supply growth in Brooklyn and Hudson Yards that will yield higher
vacancy rates, office rent growth in these two boroughs should remain subdued.

Although Amazon’s new occupancy will generate significant business activity for companies that may need more office
space, we did not estimate the indirect or ancillary impact from Amazon’s growth in this paper. Nor did we make any
assumptions about the numerous other construction projects that have been spoken for but have not had a permit filed.
In other words, while office demand in future years will increase from the ancillary business impact of Amazon’s new
headquarters, office supply will likely be higher as well.

CONCLUSION
As recently as 20 years ago, the Brooklyn and Queens waterfront was occupied by old, mostly abandoned industrial
properties. The transformation of much of this waterfront to apartments, condominiums, restaurants, parks and
other uses is nothing short of spectacular. The Anable Basin site that Amazon selected was one of the few remaining
undeveloped waterfront sites.17 A recent study18 reported that since 2010, Long Island City with 12,533 new units has
added the most new apartments of any neighborhood in the U.S. beating Downtown Los Angeles that added 7,551 units.

Those of a certain age may remember when New York City not only led many recessions – seeing job declines before the
rest of the U.S. – but also suffered disproportionately more job losses than most places. Take 1991, for example, when
the City lost 191,000 jobs which accounted for 17% of the total U.S. job loss that year (New York employed only 3% of the
U.S. total in 1990). In the 1970s, New York City’s job losses were even worse.

Although in the current expansion, New York City has added disproportionately more jobs – 22% vs. 15%19 in the U.S.
– momentum in New York City started to slow in 201820 just when job growth in the U.S. started to accelerate. In short,
Amazon’s announcement that they will be adding jobs in the City has come at a time when job growth in New York has
decelerated and was expected to slow even further in 2019 and 202021.

  16
       https://www.crainsnewyork.com/real-estate/12-things-we-know-about-amazon-deal-so-far
  17
       A developer had sought to build 1,000 units on the site as recently as 2017.
  18
       https://www.rentcafe.com/blog/rental-market/real-estate-news/top-20-neighborhoods-with-most-apartments-post-recession/?_ct=z2bgn16q3tq
  19
       From the third quarter of 2009 through the third quarter of 2018.
  20
       Year-over-year job growth from August through October was 70,000 jobs, down from 81,000 jobs added, on average, in 2017.
  21
       Prior to the Amazon announcement, Moody’s/Economy.com forecasts for the city called for job growth of only 30,000 in 2019 and no net growth in 2020 through 2021.

  ©2019 Reis, Inc. Any use of this document or portions thereof, including reproduction, modification, distribution or republication, without the prior written
  consent of Reis, is strictly prohibited.
www.reis.com

Both Reis and Moody’s will likely revise forecasts to take into account the added job growth in the next few years from
Amazon and ancillary employment including extra construction jobs. The Reis forecast for new construction had called
for decelerated Apartment completions in 2020 through 2022 due to the fact that fewer projects are in the pipeline and/
or have not filed a permit. Now that Amazon has announced its intentions, more developers will hasten their construction
process, and more lenders will be willing to finance construction loans under the new circumstances when they may not
have done so under the prior circumstances.

Reis will release our revised New York City apartment and office forecasts for 2019 through 2023 on February 1, 2019,
to incorporate the Amazon impact. These forecasts will look different from the numbers herein due to the fact that we
expect more developers will build and more jobs will be added. To reiterate, we wanted to do this preliminary analysis of
the impact of the Amazon HQ2 on New York City’s real estate to show how the City and Queens can accommodate the
new company under the current set of circumstances that include significant construction underway along with subdued
demand growth.

  Contact us for more information...
  Call us toll free (US) 800.366.REIS (7347)                                       Visit www.reis.com                 www.twitter.com/REIS_CRE
  Reis, Inc. 1185 Avenue of the Americas, New York, NY 10036                       sales@reis.com                     www.linkedin.com/company/reis

  ©2019 Reis, Inc. Any use of this document or portions thereof, including reproduction, modification, distribution or republication, without the prior written
  consent of Reis, is strictly prohibited.
www.reis.com

APPENDIX A: NEW YORK CITY HOUSING STOCK BY UNITS IN PROPERTY- 2017

                                                                                                                                                 Total Housing
                                       Two-Unit                                                  50 or
                                                         Five-Unit         20-Unit to                                                            in Properties
                      One Unit         to Four-                                                  More            Other            Total
                                                         to 19-Unit         49-Unit                                                               with Fewer
                                         Unit                                                    Units
                                                                                                                                                 than 20 Units
Bronx                   58,486           86,457             49,878           137,924            194,427           1,679          528,851                37%
Brooklyn               144,933          347,507            174,850            140,114           235,622           1,261        1,044,287                64%
Manhattan               18,741           25,968            144,851           198,552            497,309            963           886,384                21%
Queens                 229,735          268,377             80,599             84,767           192,924            848           857,250                68%
Staten Isl.            110,059           44,646              6,537             3,834             15,103            393           180,572                89%
NYC                    561,954          772,955            456,715           565,191          1,135,385           5,144        3,497,344                51%
NYC w/o S.I.           451,895          728,309           450,178            561,357          1,120,282           4,751        3,316,772                49%

Source: Census Bureau

   ©2019 Reis, Inc. Any use of this document or portions thereof, including reproduction, modification, distribution or republication, without the prior written
   consent of Reis, is strictly prohibited.
www.reis.com

APPENDIX B: EXPECTED MULTIFAMILY CONSTRUCTION
The 1,650 construction projects Reis is tracking for the New York metro include numbers on other new residential
construction21. The tables below show that the construction abundance has been spread across every category.

                                                                            Added Apartment Units(1)

                                          Queens                          Brooklyn                       Manhattan                             Bronx                                Total
 2017                                        2,233                            5,858                            5,192                             189                            13,472
 2018                                        4,895                            4,397                            2,585                             713                            12,590
 2019-2022                                   6,778                            6,300                            6,575                            1,650                           21,303
 Unspecified                                16,561                           29,617                           15,033                            8,918                           70,129

Source: Reis, Inc.

(1) Includes all market rate apartments in properties of 40 units and above; includes market rate units in mixed income
properties.

                                                           Added Condominium and Cooperative Units

                                          Queens                          Brooklyn                       Manhattan                             Bronx                                Total
 2017                                          740                             670                             1,429                               -                                2,839
 2018                                          558                             613                             2,799                              47                                4,017
 2019-2022                                   1,679                            1,481                            6,871                               -                            10,031
 Unspecified                                 2,346                            4,006                            5,693                             346                            12,391

Source: Reis, Inc.

                                                           Added Subsidized and Mixed Income Units(2)

                                          Queens                          Brooklyn                       Manhattan                             Bronx                                Total
 2017                                          687                            2,660                            1,324                            2,773                               7,444
 2018                                        1,048                            1,141                             970                             2,655                               5,814
 2019-2022                                   2,109                            2,128                            1,359                            1,693                               7,289
 Unspecified                                 6,372                            9,212                            6,894                            9,516                           31,994

Source: Reis, Inc.

(2) Includes LIHTC, Section 8, 421-a and other subsidized properties; includes the affordable units in mixed income
properties.

  22
       Reis tracks all residential construction projects including coop and condominium projects as well as subsidized and affordable housing projects and mixed income projects.

  ©2019 Reis, Inc. Any use of this document or portions thereof, including reproduction, modification, distribution or republication, without the prior written
  consent of Reis, is strictly prohibited.
www.reis.com

APPENDIX C: EXPECTED OFFICE CONSTRUCTION
With all of the construction underway in Queens, Manhattan and Brooklyn, vacancy rates are expected to increase
starting in 2019.

                                                           Queens Office Statistics

			Source: Reis, Inc.

At the same time, office supply is expected to soar in Manhattan with added inventory at Hudson Yards.

                                                       Manhattan Office Statistics

		                  Source: Reis, Inc.

  ©2019 Reis, Inc. Any use of this document or portions thereof, including reproduction, modification, distribution or republication, without the prior written
  consent of Reis, is strictly prohibited.
www.reis.com

Brooklyn has added proportionately more office space than Queens with more than 2 million square feet of office space
in 2015 through 2017 including Empire Stores on Water Street, 41 Flatbush Avenue and Whale Square at 14 53rd Street
in Sunset Park. Brooklyn is expected to add considerably more office space in 2019 through 2022 including 422 Fulton
Street and 47 Hall Street.

                                                          Brooklyn Office Statistics

         Source: Reis, Inc.

  ©2019 Reis, Inc. Any use of this document or portions thereof, including reproduction, modification, distribution or republication, without the prior written
  consent of Reis, is strictly prohibited.
www.reis.com

APPENDIX D: EMPLOYMENT GROWTH

The outer boroughs have been a job juggernaut for New York City over the last ten years. The chart below shows that
Manhattan, Queens and especially Brooklyn have seen significantly higher growth than the U.S. while growth in the Bronx
is in line with the U.S.
                                                                Private
                                                                Private Sector
                                                                        SectorEmployment  Growth
                                                                               Employment Growth

                                              40%
              Perecentage Growth since 2010

                                              30%

                                              20%

                                              10%

                                               0%

                                              -10%
                                                     2010     2011      2012     2013     2014      2015          2016          2017         2018*

                                                 Bronx      Brooklyn      Manhattan       Queens          Staten Island             NYC            US

         Source: Bureau of Labor Statistics
         *For NYC five boroughs, 2018 growth equals the average office employment for January through June of 2018 less average office total for
         January through June 2017. For the U.S., 2018 growth equals the average growth from January through October of both years.

                                                                       Appendix D continued on next page

  ©2019 Reis, Inc. Any use of this document or portions thereof, including reproduction, modification, distribution or republication, without the prior written
  consent of Reis, is strictly prohibited.
www.reis.com

Queens office employment has been in line with that of Manhattan while in Brooklyn it was much higher. Brooklyn added
20,240 office jobs over the last five years, a growth rate of 25%. Queens added 7,270 office jobs since 2013, or 8.0%
growth. In Manhattan, office employment expanded by 136,080 jobs or 14%.

                                                         Office Employment Growth

         Source: Bureau of Labor Statistics
         *For NYC five boroughs, 2018 growth equals the average office employment for January through June of 2018 less average office total for
         January through June 2017. For the U.S., 2018 growth equals the average growth from January through October of both years.

The chart above also shows how New York City’s office base grew at a much higher rate than the U.S metro average. The
average annual rate of growth was 2.7% in New York City, higher than the U.S. metro average of 2.3%. New York’s tech
industries have also added disproportionately more jobs than the U.S. The city’s computer system design industry has
grown by 28,500 jobs or 63% since 2009, higher than the U.S. equivalent rate of 48%. The nonstore retail sector in which
Amazon is classified has grown by 89% in the five boroughs, higher than the 38% growth rate for the U.S. At the same
time, the finance sector in New York City and the U.S. have grown by 10.8% and 10.3%, respectively, since 2009.

  ©2019 Reis, Inc. Any use of this document or portions thereof, including reproduction, modification, distribution or republication, without the prior written
  consent of Reis, is strictly prohibited.
You can also read