NORTHWOOD COVID-19 OPTIMISM INDEX 5/1/2021 PREPARED BY NORTHWOOD'S MCNAIR CENTER FOR THE ADVANCEMENT OF FREE ENTERPRISE AND ENTREPRENEURSHIP
←
→
Page content transcription
If your browser does not render page correctly, please read the page content below
Northwood COVID-19 Optimism Index

                           5/1/2021

   Prepared by Northwood’s McNair Center for the

Advancement of Free Enterprise and Entrepreneurship

“Finally, history recognizes that human progress depends on freedom
                        for business enterprise.”
                             -V. Orval Watts
                          The Northwood Idea
                           When We Are Free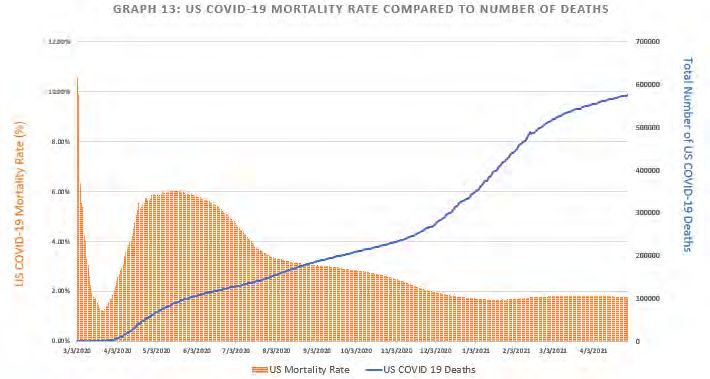
Table of Contents
Broad-base Daily Index……………………………………………….page 2
Analysis of Daily Performance of The Index………………..page 3
Broad Base Model Keys Explained………………………………page 4
Technical Model Keys Explained…………………………………page 5
Tracking the Daily Index Construction and Function of
Index…………………………………………………….……..…………pages 6-8
Glossary of Graph………………………………………………………..page 9
Graph 1: Daily U.S. COVID 19 Cases …………………….....page 10
Graph 2: Total Daily U.S. COVID 19 Deaths……………....page 11
Graph 3: Total Daily U.S. Mortality Rate ………...………..page 12
Graph 4: DJIA Daily Closing Price Total ………..………...…page 13
Graph 5: NASDAQ Daily Closing Price ……..………...……..page 14
Graph 6: Wilshire 5000 Daily Closing Price ……….……..…page 15
Graph 7: Daily Change In Yield For 10 Year Treasury
Bond…………………………………………………………………..………page 16
Graph 8: Daily Tracking of Technical Model………..……..page 17
Graph 9: Daily Tracking of Broad Base Model…..………..page 18
Graph 10: Daily U.S. Case Growth…………………..………….page 19
Graph 11: Daily U.S. Mortality Rate……………..…………….Page 20
Graph 12: Daily U.S. Growth in Deaths……..………………..Page 21
Graph 13: Total Number of US COVID-19
Deaths Compared to Mortality Rate………………..………..…Page 22
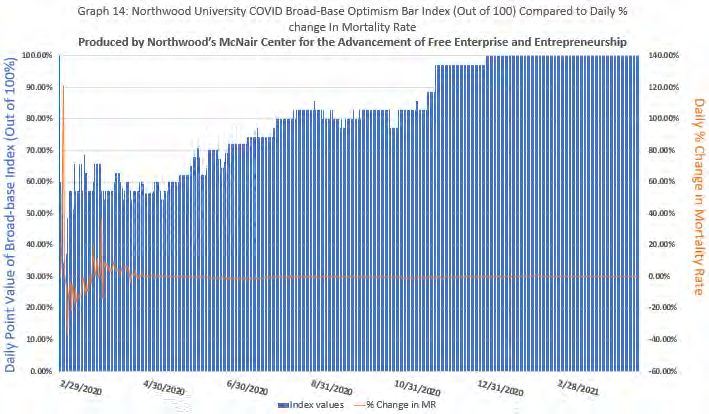
Graph 14: Daily Percent Change in Mortality Rate Compared to
Broad-base Index…………………………….……………………………..Page 23
Graph 15: Daily Mortality Rate………………………………………….Page 24
Graph 16: US COVID-19 Positivity Rate………………………..………Page 25
Meet The Authors and About the Publisher……….…………….Page 26
1
Northwood University’s COVID-19
                       Broad-base Index
                          5/1/2021

*See Performance Breakdown on Next Page

                                                  2
Understanding the Results:
The Northwood University COVID-19 Optimism Index is prepared daily by the McNair Center for
the Advancement of Free Enterprise and Entrepreneurship at Northwood University.
The Index follows seven variables on a daily basis. The variables are (a) Total U.S. COVID cases,
(b) Total U.S. COVID-related deaths, (c) Current U.S. COVID-19 Mortality Rate, (d) Performance
of the Dow Jones Industrial Average (DJIA), (e) Performance of the NASDAQ Stock Exchange, (f)
Performance of the Wilshire 5000 Stock Index, and (g) Movement in the yield on the U.S.
Treasury 10-year Bond (see chart on next page). The index tracks variables c, d, e, f, and g in the
calculation of its Index. The Index uses variable c as a proxy for the impact of the COVID-19
virus on the economy, variables d, e, and f as a proxy for the general health of the economy,
and variable g, as a proxy for the general level of confidence in the economy.
The Index measures movement from pre-COVID-19 crisis through the current COVID-19 crisis,
a sustained measurement on the Index above of 65 to 70 is an indication that the economy is
beginning to recover. When the Index reaches a level of 100 or 100 percent, it is a signal that
the economy has or will within six months returned to conditions close to or equal to those
which existed pre-COVID-19 virus.
Our McNair Center’s Northwood University COVID-19 Optimism Index closed flat today at 100%
with three of our variables in the red, with the number of cases, deaths and overall mortality
rate in the green while the Wilshire 5000 was flat. The overall mortality rate fell to 1.78% and
the daily mortality rate increased to 1.63%. The Wall Street Journal reported today, the
increase of COVID-19 cases in India and other developing nations is adding momentum to a
push to suspend intellectual-property restrictions on vaccines. Pharmaceutical companies are
saying that waiving the intellectual property on the vaccines would not solve supply problems
in the short term because contract producers lack familiarity with new technology behind the
vaccines. The Daily Wire reported yesterday, South Dakota Governor Kristi Noem is suing the
Biden Administration for canceling the Independence Day festivities at Mount Rushmore due to
concerns about COVID-19. The Daily Wire also reported, the Transportation Security
Administration has extended the face mask requirement that was set to expire later this month.
According to the CDC out of the 308.77 million vaccine doses distributed in the US, 240.16
million or 77.78% have been administered unchanged from yesterday's level. Of the 9.42
million vaccines distributed in Michigan, roughly 7.12 million have been administered for an
administration rate of 75.58%, ranking Michigan 34th among the 50 US states. The US has
conducted 433.93 million COVID-19 tests to date.
We especially encourage you to pay close attention to charts 10, 11 and 12 (in the report) as
they are showing key COVID-19 data, increasing at a decreasing rate or the flattening of
overall COVID-19 conditions which means that we DO expect the number of new cases to be
declining in the next 1-2 weeks.
*for more information, or questions, on the above, contact Dr. Timothy G. Nash at 1(989) 837-
4129 or at tgnash@northwood.edu
3Broad Base Model Key Explained
The Broad base model is calculated on a 7-point scale. To date, all U.S. activity has been within the 1-5 range. A -1 would signal dire
economic and social conditions, while a 6 would signal the defeat of the COVID-19 virus and new record highs for the major stock
indices and exchange listed in our model. The index tracks five categories: 1. the change in daily U.S. COVID mortality rates, 2.
change in daily performance of the Dow Jones Industrial Average, 3. change in daily performance of the NASDAQ Stock Exchange 4.
change in daily performance of the Wilshire 5000 Stock Index 5. change in the daily yield on 10-year treasury bonds. We have
ranked the performance in each of the five categories based on worst case conditions that could or did exist early in our current
crisis (ranking of 1) to conditions that would exist when the economy returns to economic and health conditions close to or at pre-
COVID 19 conditions (ranking of 5). Performance and or conditions by category improves as one moves from a ranking of 1 to 2 to 3
to 4 to 5. If a ranking of 6 is achieved in any category it suggests that conditions are superior to what they were pre-COVID 19 virus.
Category 1 (Mortality Rate) is weighted 3/7th of the final with the other 4 categories each receiving a 1/7 weight. Once the results
th
are determined based on the following weights, it is converted to a 100-point scale, where 100 represents a return to prosperous
economic times pre-COVID-19 virus.
4Technical Model Key Explained
The Technical model, like the Broad Base Model, is calculated on a 7-point scale. To date, all U.S. activity has been within the 1-5 range.
A -1 would signal dire economic and social conditions, while a 6 would signal the defeat of the COVID-19 virus and new record highs for
the major stock indices, and a new low mortality rate, both listed in our model. The index tracks five categories: 1. the change in daily
U.S. COVID mortality rates, 2. change in daily performance of the Dow Jones Industrial Average, 3. change in daily performance of the
NASDAQ Stock Exchange 4. Change in daily performance of the Wilshire 5000 Stock Index 5. Change in the daily yield on 10-year
treasury bonds. We have ranked the performance in each of the five categories based on worst case conditions that could or did exist
early in our current crisis (ranking of 1) to conditions that would exist when the economy returns to economic and health conditions
close to or at pre-COVID 19 conditions (ranking of 5). Performance and or conditions by category improves as one moves from a ranking
of 1 to 2 to 3 to 4 to 5. If a ranking of 6 is achieved in any category it suggests that conditions are superior to what they were pre-COVID
19 virus. Where the Technical Model differs from the Broad Base Model is that it divides each category into tenths and so with the
Broad Base model, you have five categories in essence. So, with the technical model, you have 10 sub- categories per ranking (10 within
1, 10 within 2, 10 within 3, 10 within 4, 10 within 5 for a total of 50 ranking points). By dividing each category into tenths, this allows the
model to be more sensitive to changes in the data. This model will pick up on changes in the trend before the Broad Base model will.
For example, you may receive a 4.1 or 4.5 in a technical model, whereas you can only receive a 5 in the broad base model. The broad
base model gives us a general overview. The technical model gives us a more in-depth ranking. Category 1 (Mortality rate) is weighted
3/7th of the final, with the other 4 categories each receiving a 1/7 weight. Once the results are determined based on the following
th
weights, it is converted to a 100-point scale, where 100 representing a return to prosperous economic times pre-COVID-19 virus.
5The Northwood University/McNair COVID-19 Optimism Index
Day 405: Saturday, May 1st, 2021, 4PM ET
1. Measurements of the Impact of COVID-19 on the U.S. Population
a. U.S. COVID-19 deaths: 575,746 to 576,519 (up 0.13%)
b. U.S. Cases of COVID-19 increased from 32,326,877 to 32,374,328 (up 0.15%)
,
c. U.S. COVID-19 Mortality Rate equals 1.78% (down 0.06%)
To determine the current U.S. COVID-19 Mortality Rate take 576,519 U.S. Deaths from
COVID-19 divided by 32,374,328 total U.S. cases of COVID-19 = 1.78%
1.876
2. Major U.S. Stock Indices
a. Today the Dow Jones Industrial Average was 33,874.85 (down 0.54%)
b. Today the NASDAQ was 13,962.68 (down 0.85%)
c. Today the Wilshire 5000 was 44,113.22 (up 0.00%)
3. The 10-year U.S. Treasury Bond Yield
Today the yield was 1.631 (down 0.55%)
Understanding the Results
Our McNair Center’s Northwood University COVID-19 Optimism Index closed flat today at 100%
with three of our variables in the red, with the number of cases, deaths and overall mortality
rate in the green while the Wilshire 5000 was flat. The overall mortality rate fell to 1.78% and
the daily mortality rate increased to 1.63%. The Wall Street Journal reported today, the
increase of COVID-19 cases in India and other developing nations is adding momentum to a
push to suspend intellectual-property restrictions on vaccines. Pharmaceutical companies are
saying that waiving the intellectual property on the vaccines would not solve supply problems
in the short term because contract producers lack familiarity with new technology behind the
vaccines. The Daily Wire reported yesterday, South Dakota Governor Kristi Noem is suing the
Biden Administration for canceling the Independence Day festivities at Mount Rushmore due to
concerns about COVID-19. The Daily Wire also reported, the Transportation Security
Administration has extended the face mask requirement that was set to expire later this month.
According to the CDC out of the 308.77 million vaccine doses distributed in the US, 240.16
million or 77.78% have been administered unchanged from yesterday's level. Of the 9.42
million vaccines distributed in Michigan, roughly 7.12 million have been administered for an
administration rate of 75.58%, ranking Michigan 34th among the 50 US states. The US has
conducted 433.93 million COVID-19 tests to date.
This Index is published daily by the McNair Center for the Advancement of Free Enterprise and
Entrepreneurship. Any questions regarding the index can be addressed by contacting Dr.
Timothy G. Nash at 1(989) 837-4129 or tgnash@northwood.edu. Index definitions to follow.
6How the Northwood University COVID-19 Optimism Index
is constructed and functions
The Northwood University COVID-19 Optimism Index reports on changes in daily optimism each
day in a given week. We report on our three major factors that indicate whether or not the
American economy is making progress with the COVID-19 virus and recovering. The three
categories are: 1. Measurements of the impact of COVID-19 on the US Population. 2. The
performance of the three major U.S. Stock indices (The Dow Jones Industrial Average, the
NASDAQ and The Wilshire 5000) and 3. The interest rate or yield on 10-year treasury bonds.
Measurements of the Impact of COVID-19 on the US Population
As the US COVID-19 mortality rate declines, that will be a sign that the percentage of
American’s who have contracted the COVID-19 virus and have died, is declining. If the mortality
rate is declining, there will be a downward green arrow to the right of the index. If the mortality
rate is increasing, there will be a upward red arrow to the right of the mortality index. The
lower the mortality rate, the greater the reason for optimism and the realization that as a
country we are effectively fighting the COVID-19 virus and reducing its negative impact on the
economy. Equally important we are tracking daily increases or decreases in the number of
COVID-19 cases in the US as well as daily increases in US deaths from COVID-19. Red and green
arrows will be applied in the exact same fashion for COVID-19 cases and deaths as explained
above with the Mortality Rate.
Tracking Stock Market Performance
By tracking our three major US stock indices, we will be following one of the best broad-based
indicators as to how the American economy is performing. In general terms, daily, weekly, and
monthly increases in our three major stock indices is a broad-based signal that generally the
U.S. economy is improving. Prolonged and especially sharp declines in the three indices is a sign
that the general economy is underperforming. Long and or sharp declines in these indices
forecast bad economic times exist or may be on the horizon for the US economy. When a stock
market index is growing, the arrow to the right will be upward pointing and green. When a
stock market declines, the arrow will be downward pointing and red.
US Stock Market Indices
a. The Dow Jones Industrial Average is an index that tracks 30 large publicly-owned
blue chip companies trading to the New York Stock Exchange (NYSE) and the
NASDAQ.
b. NASDAQ is a global electronic marketplace for buying and selling securities. It is
the second largest stock market in the world by market capitalization and is the
home for most major technology stocks.
c. The Wilshire 5000 Total Market Index or Wilshire 5000 is intended to measure
the performance of most publicly traded companies headquartered in the
7United States. It is generally believed to be the broadest measurement of US
stock performances as it has collectively measured the performance of roughly
3,500 companies annually over the last five years.
U.S. Treasury Yield
The 10-year US treasury bond yield is a certificate representing a loan to the federal
government and matures in more than 10 years. Since they are backed by the US government,
they are seen as a safe investment, particularly relative to stocks and other securities. Treasury
bond prices and yields move in opposite directions, falling bond prices boost yields and rising
bond prices lower yields. The 10-year yield is used as a proxy for mortgage interest rates and is
also seen as a sign of investor sentiment regarding the state of the economy. A rising yield
indicates falling rates and falling demand for treasury bonds, which means investors would
rather put their money in higher risk, higher reward investments (like the stock market); a
falling yield suggests the opposite. When the 10-year US treasury bond yield is increasing, the
arrow will be green and pointing upward as this is a sign investor confidence in stock market is
increasing. When US 10-year treasury bond yields are decreasing, the arrow will point
downward and it will be red. This is a sign that investors are willing to take lower returns on
government securities because they are worried about the economy and do not want to hold
stocks.
Sources: Johns Hopkins University, WorldOMeter, MarketWatch, Wall Street Journal, Yahoo
Finance, World Health Organization, U.S. CDC, Investors Daily, and Investopedia.
The Northwood University COVID-19 Optimism Index is produced five times a week by the
McNair Center for the Advancement of Public Policy and Entrepreneurship at Northwood
University.
Each daily report will have a brief summation of what the Northwood University Optimism
Index was signaling about the US economy and its battle with the COVID-19 virus.
Any questions regarding the index can be addressed by contacting Dr. Timothy G. Nash at 1
(989) 837-4129 or tgnash@northwood.edu
8Graph Number Definition Graph Number Definition
1 This is a graph of the total number of confirmed 7 This is a graph showing the daily yield on the 10
US COVID-19 cases since February 28th. year treasury bond. In other words, this is the
annual rate of return you could get for loaning
the US government money for 10 years.
2 This is a graph of the total number of confirmed 8 This is a bar graph showing the daily level of the
US COVID-19 related deaths since February 28th. Northwood University COVID-19 technical
optimism Index. See pages 4-5 for more
information.
3 This is a graph showing the percentage of 9 This is a bar graph showing the daily level of the
people who have died after getting COVID-19 in Northwood University COVID-19 broad-base
the US. It’s calculated by dividing total number optimism Index. See pages 4-5 for more
of deaths by total number of cases. information.
4 This is a graph showing the daily closing price of 10 This is a graph that shows the percent change in
the Dow Jones Industrial Index since February the total number of cases per day. Its calculated
28th. This Index contains 30 Blue chip by dividing today’s total number of cases by
companies. yesterday’s then measured in percent.
5 This is a graph showing the daily closing price of 11 This is a graph that shows the percent change in
the NASDAQ Composite Index since February the total number of deaths per day. Its calculated
28th. This Index Contains 100 mostly Tech by dividing today’s total number of deaths by
companies. yesterday’s then measured in percent.
6 This is a graph showing the daily closing price of 12 This is a graph that shows the percent change in
the Wilshire 5000 Index since February 28th. the mortality rate per day. Its calculated by
This Index Contains about 3500 smaller US dividing today’s mortality rate yesterday’s then
companies. measured in percent.
910
11
12
13
14
15
16
17
18
19
20
21
22
23
24
25
This Report Was Prepared by the Following Authors:

Dr. Timothy G. Nash, Director, The McNair Center at Northwood University, Dr. John Gustincic, Northwood
University, Dr. Dale Matcheck, Northwood University, Dr. Lisa Fairbairn, Northwood University, Ashley Wright,
McNair Scholar, Ethan Schad, McNair Scholar, Bradley Getchel, McNair Scholar, and Noah Cox, McNair Scholar

About Northwood University: Northwood University is committed to developing leaders of a global free-
enterprise society and prepares students for success in their careers and communities. Rooted in the Northwood
Idea, the university promotes critical thinking skills, personal effectiveness, and the importance of free enterprise,
ethics, individual freedom and responsibility. Private, nonprofit, and accredited, Northwood University specializes
in managerial and entrepreneurial education at a full-service, residential campus located in Midland, Michigan.
The Adult Degree Program is delivered in multiple states and online for students with transfer credits and work
experience who are looking to complete their undergraduate degree. The DeVos Graduate School of
Management offers MBA and Master of Science degrees in Finance, Business Analytics, and Organizational
Leadership with day and evening, and online delivery options. The Doctor of Business Administration (DBA)
program is delivered online, with a differentiated focus on leadership and business analytics using both
qualitative and quantitative methodologies. The Michigan-based Alden B. Dow Center for Creativity and
Enterprise provides system-wide expertise in family enterprise, entrepreneurship, creativity and innovation, and
new business development. International education is offered through study abroad and at International
Program Centers in Switzerland, China (Changchun and Wuxi), and Sri Lanka.

About The McNair Center: The McNair Center for the Advancement of Free Enterprise and Entrepreneurship at
Northwood University is a leading University think-tank generating information focused on the study, advocacy
and expansion of the market-process and the creation and cultivation of entrepreneurs.

                                                                                                                    26
You can also read