Healthy Moms, Healthy Babies: Hospital Performance on Leapfrog's Maternity Care Standards Based on Results of the 2020 Leapfrog Hospital Survey ...
←
→
Page content transcription
If your browser does not render page correctly, please read the page content below
Healthy Moms, Healthy Babies:
        Hospital Performance on Leapfrog’s Maternity Care Standards Based
                  on Results of the 2020 Leapfrog Hospital Survey
                                                        Report Highlights
    •    Transparency galvanizes change: Across all three measures included in this report, public reporting has played a key role in
         reducing unnecessary interventions in childbirth
    •    The average rate of episiotomies amongst reporting hospitals has decreased to 5.2%, the lowest rate since Leapfrog began
         publicly reporting on the measure, though more progress is needed to achieve Leapfrog’s target rate of 5% or less
    •    Hospitals continue to succeed at reducing or eliminating early elective deliveries, with nearly 92% of reporting hospitals
         meeting Leapfrog’s standard of an early elective delivery rate of 5% or less
    •    Though the average rate of NTSV C-sections, the standardized measure of cesarean procedures in low-risk, first time mothers,
         remains too high, there has been progress, and more hospitals than ever before are achieving Leapfrog’s standard

                                                 Introduction
                                                 Not all hospitals provide the same quality of maternity care for expectant
   Where the data comes from                     mothers. In fact, maternity care can vary greatly from hospital to hospital,
                                                 even within the same city. The birth of a child is a life-defining experience
   This report uses final hospital data          for both mothers and families, which is why research prior to delivery is
   from the 2020 Leapfrog Hospital               critical.
   Survey, the flagship initiative of The
   Leapfrog Group. Over 2,200 hospitals          The Leapfrog Hospital Survey collects and publicly reports data that
   have Survey data publicly reported,           reveals the variation in hospital maternity care and helps families make
   representing 75% of U.S. hospital beds.       informed decisions when choosing a hospital. The Survey measures key
   The Leapfrog Group is a nonprofit
                                                 areas of maternity care important to purchasers and consumers including
   watchdog organization that serves as a
   voice for health care purchasers, using       cesarean sections, episiotomies, and early elective deliveries. Experts
   their collective influence to foster          agree, and research has shown, that overuse of these three medical
   positive change in U.S. health care. For      interventions unnecessarily increase risks to both mothers and babies.
   more than 20 years Leapfrog has been
   the nation’s premier advocate of health       What’s more, disparities in maternity care are increasingly prominent for
   care transparency—collecting,                 women of color. According to the Centers for Disease Control and
   analyzing, and disseminating data to          Prevention (CDC), American Indian/Alaska Native and Black women are
   inform value-based purchasing.                two to three times more likely to die from a pregnancy-related cause than
   The Leapfrog Group invites all adult          white womeni, and the rate of C-sections in Black women is higher than
   and pediatric acute care hospitals in         women from other racial/ethnic groups.ii There is a crucial need to
   the United States to voluntarily report       improve quality of maternity care for all women, with special attention to
   to the annual Leapfrog Hospital Survey;       those most at risk for death or harm.
   additionally, ambulatory surgery
   centers (ASCs) are invited to report to       In the 2021 Leapfrog Hospital Survey, Leapfrog began asking hospitals if
   the Leapfrog ASC Survey.                      they stratify any of their quality measures by patient race, ethnicity, or
   The Leapfrog Hospital Survey is               primary language to understand and address possible disparities in the
   developed with guidance from                  quality of care they provide. Much more work lies ahead to address this
   volunteer Expert Panels and receives          urgent problem.
   scientific guidance from the Johns
   Hopkins Armstrong Institute for Patient
   Safety and Quality. Quality and safety
   data by facility collected via the Survey
   on measures such as maternity care,
   medication safety, and infection rates
   is available at
   ratings.leapfroggroup.org.

© 2021 The Leapfrog Group                                www.leapfroggroup.org                                               Page 1 of 7
Cesarean Sections Around one in three childbirths occur by cesarean section in the United States. iii While the rate of cesarean births has decreased over recent years, according to the American College of Obstetricians and Gynecologists (ACOG) and the Society for Maternal-Fetal Medicine, C-sections remain too common in the U.S. iv In some cases, a C-section is necessary to protect the health of the mother and baby, but C-sections can also carry serious risks of infection or blood clots, and many women experience longer recovery periods and complications with future pregnancies. C- sections can also impact the health of babies, like breathing difficulties that require treatment in a newborn intensive care unit (NICU). In the long-term, research shows that C-sections can cause chronic pelvic pain in some women, and babies born by C-section are at an increased risk of developing chronic childhood diseases like asthma and diabetes. The Leapfrog Hospital Survey uses a nationally endorsed measure known as the Nulliparous, Term, Singleton, Vertex (NTSV) Cesarean Birth rate, referring to C-sections for mothers with first-time pregnancies (nulliparous) that have reached at least 37 weeks of gestation (term) and have a single baby (singleton) in the head-down position (vertex). This measure exclusively examines the population of women least likely to need a C-section, offering a standardized way to compare hospital performance. To meet Leapfrog’s standard, based on the guidance of its national Maternity Care Expert Panel, hospitals must achieve the Healthy People 2020 NTSV cesarean birth rate target of 23.9% or lower. Figure 1: Leapfrog reporting hospitals’ average rate of NTSV C-Section Figure 2: Percent of reporting hospitals achieving Leapfrog’s by year standard (23.9% or less) by year Since Leapfrog’s public reporting on the NTSV C-section measure began in 2015, hospitals have demonstrated only minor progress year-over-year in reducing the average rate (Figure 1). However, 2020 Survey results encouragingly show that more hospitals than ever before, 51%, are achieving Leapfrog’s C-section standard of 23.9% or less (Figure 2). This is notable improvement from 2019 when less than 42% of hospitals achieved the standard. © 2021 The Leapfrog Group www.leapfroggroup.org Page 2 of 7
The Survey results also revealed significant variation by state when examining reporting hospitals’ average NTSV C-
section rates. Kentucky has the highest rate of NTSV C-sections at 29.4%, while Wyoming and Utah have the lowest
rates, at 18.4% (Figure 3). States with fewer than five reporting hospitals were excluded from the analysis.
Figure 3: Average Rate of Leapfrog’s NTSV C-section standard by state

                                     Avg. NTSV C-section Rate

 Based on the guidance of its Expert Panel, Leapfrog will update its NTSV C-section target rate on the 2021 Leapfrog
 Hospital Survey to align with the Healthy People 2030 goal of 23.6% or less.

© 2021 The Leapfrog Group                                        www.leapfroggroup.org                      Page 3 of 7
Episiotomy
An episiotomy is an incision made in the perineum to make the vaginal opening larger during childbirth. Once a
routine practice in childbirth, medical guidelines today urge against the routine use of episiotomy, due to the risk of
perineal tears, loss of bladder or bowel control, and pelvic floor defects. Other significant issues include infection
and other complications, slow recovery, and the potential for lifelong discomfort. Due to these concerns, ACOG
recommends the use of episiotomy only in highly restricted circumstances.v
Leapfrog is the only organization to track and publicly report rates of episiotomy by hospital. Based on the guidance
of its Maternity Care Expert Panel, Leapfrog’s standard for episiotomies is 5% or less. Since Leapfrog began public
reporting on this measure in 2012, hospital rates have steadily declined each year. The average rate of episiotomies
has decreased by around 49% between 2015 and 2020. In 2020, the average hospital rate was 5.2% (Figure 4). While
still above Leapfrog’s standard, this is significant and encouraging progress and suggests hospitals are actively
addressing this critical safety issue.
Figure 4: Average rate of episiotomy rate by year
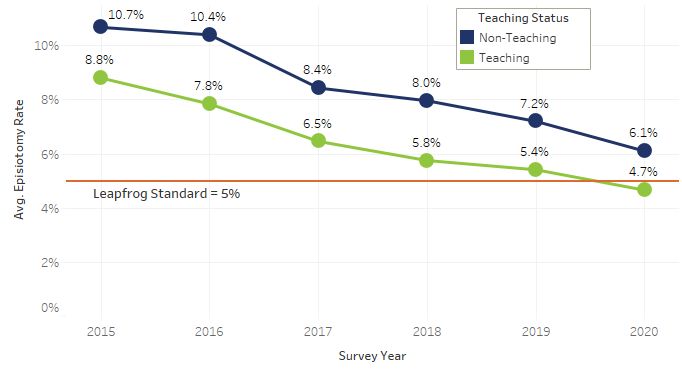
Figure 5: Average rate of episiotomy by teaching status
As in prior years, teaching
hospitals have achieved a
lower episiotomy rate than
non-teaching hospitals. In
2020, the average rate of
episiotomy across teaching
hospitals was 4.7%
compared to 6.1% in non-
teaching hospitals (Figure 5).
Though this gap has
narrowed slightly compared
to previous years, it still
represents a statistically
significant difference
between the two types of
hospitals.
© 2021 The Leapfrog Group www.leapfroggroup.org Page 4 of 7Early Elective Deliveries Early elective deliveries are scheduled C-sections or medical inductions performed prior to 39 completed weeks gestation without a medical reason. This is full-term as defined by ACOG and the Society for Maternal-Fetal Medicine, and deliveries before this period carries risks to both babies and mothers, like NICU admissions, longer hospital stays, and higher costs to both patients and payers. Studies also suggest an early delivery can have long- term developmental risks for infants. In 2010, Leapfrog first reported rates of early elective delivery by hospital. This groundbreaking public reporting galvanized a movement to reduce early elective deliveries nationwide, dramatically decreasing the national average from over 17% in 2010 to 1.4% in 2019 and improving the start to life for thousands of babies. In 2020, the rate of early elective deliveries average was 1.6% (Figure 6). With nearly 92% of hospitals now achieving Leapfrog’s early elective delivery standard of 5% or less (Figure 7), it is clear that every hospital in America can and should achieve this standard. Figure 6: Average rate of Early Elective Deliveries over time Figure 7: 2020 performance on Leapfrog’s early elective delivery standard © 2021 The Leapfrog Group www.leapfroggroup.org Page 5 of 7
Maternity Measures Compared
Despite overall improvement across all of Leapfrog’s maternity care measures, substantial variation across hospitals
remains. As revealed in Figure 8, this variation is most pronounced for NTSV C-sections, with rates by hospital varying ten-
fold from the lowest rates and the highest rates. Though still substantial, variation in episiotomy rates is less pronounced.
The least amount of variation is seen in the early elective delivery rates, with most facilities’ rates well below Leapfrog’s
standard. Public reporting on early elective deliveries and episiotomy have clearly improved the delivery of care, and the
reduction in variation in hospital performance suggests a gravitational pull toward widespread adoption of successful
improvement practices. That same gravitational pull is less evident for C-section rates, where persistent variation among
hospitals suggests the call to action has yet to be heard. The notable advances in episiotomy and early elective delivery
demonstrate change is possible for C-sections.

Figure 8: 2020 Facility NTSV C-Section, Episiotomy, and Early Elective Delivery Rates

                        NTSV C-Section                                      Episiotomy             Early Elective Delivery

© 2021 The Leapfrog Group                                         www.leapfroggroup.org                                 Page 6 of 7
How to Use this Information
Since Leapfrog began reporting on the quality and safety of maternity care ten years ago, tremendous progress has
been made. Undoubtedly, public reporting and transparency has galvanized improvement. So too has alignment
with national and state associations, quality collaboratives, and other nonprofits calling for improvement. Leapfrog
data on maternity care can be used in a variety of ways by many different stakeholder organizations.
What hospitals can do:
Hospitals use Leapfrog data to track and measure their progress on quality and safety. Notably, many hospitals have
effectively used the Leapfrog Hospital Survey to design a performance improvement plan that has enabled
significant gains on Leapfrog’s maternity care measures. The case studies below demonstrate how participating in
the Leapfrog Hospital Survey prompted action within hospitals and motivated positive change.
• Case Study: How the Leapfrog Hospital Survey Helped Virginia Hospital Center Lower its NTSV C-section
Rate
When Virginia Hospital Center (VHC) in Arlington, Virginia reported to the 2014 Leapfrog Hospital Survey, it
recognized that its NTSV C-section rate was much higher than Leapfrog’s standard. VHC began reporting
NTSV C-section rates by provider to other physicians. VHC continues to achieve Leapfrog’s NTSV C-section
standard, most recently reporting a rate of 21.8%.
• Case Study: Implementing the Leapfrog Episiotomy Standard to Promote Improved Maternal Health
Since 2014, Texas Children’s Hospital in Houston has been focused on reducing and sustaining an episiotomy
rate that exceeds Leapfrog’s standard. The hospital developed a taskforce to help oversee these efforts and
as a result, saw a 62.2% reduction in its episiotomy rate in five years. The performance standards set out by
the Leapfrog Hospital Survey and its benchmarking was a key lever in that success.
What employers can do:
Employers can play an active role in helping their employees achieve a safe delivery. They can start by educating
employees on the importance of choosing the right facility for delivery and encouraging them to use free resources,
like Leapfrog’s public reporting website. Employers can also leverage their collective influence and urge hospitals in
their area to improve on maternity care measures as well encourage them to participate in the Leapfrog Hospital
Survey so maternity data can be accessed by their employees.
What advocates can do:
Associations and quality improvement collaboratives should urge hospitals to adhere to peer-reviewed medical
guidelines surrounding maternity care and to participate in the Leapfrog Hospital Survey to track and measure
progress on maternity care safety and quality. Coordination between stakeholder organizations can assist hospitals
in improvement efforts and sends an aligned message that excellence is achievable and will be recognized.
What mothers can do:
Expectant mothers should review Leapfrog’s maternity care results at www.ratings.leapfroggroup.org to find the
highest performing hospital available to them for delivery. Leapfrog is the only publicly available source of this
maternity care quality data; most but not all hospitals are willing to make their data public. If Leapfrog reports that
your hospital “declines to respond,” share your concern with the hospital and ask them to report to the Leapfrog
Hospital Survey.
Please visit www.ratings.leapfroggroup.org/measure/hospital/maternity-care to learn more about Leapfrog’s
maternity care measures.
i
Centers for Disease Control and Prevention (CDC), Infographic: Racial/Ethnic Disparities in Pregnancy-Related Deaths—United States, 2007-2016. 2007-2016. https://www.cdc.gov/reproductivehealth/maternal-mortality/disparities-pregnancy-related-
deaths/infographic.html. Accessed March 12, 2021.
ii
March of Dimes Peristats, Total cesarean deliveries by race/ethnicity: United States, 2016-2018 Average. 2021. https://www.marchofdimes.org/Peristats/ViewSubtopic.aspx?reg=99&top=8&stop=356&lev=1&slev=1&obj=1. Accessed March 12, 2021.
iii
The American College of Obstetricians and Gynecologists, Safe Prevention of the Primary Cesarean Delivery. 2014. https://www.acog.org/clinical/clinical-guidance/obstetric-care-consensus/articles/2014/03/safe-prevention-of-the-primary-cesarean-delivery.
Accessed March 12, 2021.
iv
The American College of Obstetricians and Gynecologists, Safe Prevention of the Primary Cesarean Delivery. 2014. https://www.acog.org/clinical/clinical-guidance/obstetric-care-consensus/articles/2014/03/safe-prevention-of-the-primary-cesarean-delivery.
Accessed March 12, 2021.
v
The American College of Obstetricians and Gynecologists, Practice Bulletin No. 165: Prevention and Management of Obstetric Lacerations at Vaginal Delivery. 2016.
https://journals.lww.com/greenjournal/Fulltext/2016/07000/Practice_Bulletin_No__165__Prevention_and.46.aspx. Accessed March 12, 2021.
© 2021 The Leapfrog Group www.leapfroggroup.org Page 7 of 7You can also read