COMPANY OVERVIEW TSX: IVQ.U - Invesque
←
→
Page content transcription
If your browser does not render page correctly, please read the page content below

COMPANY OVERVIEW TSX: IVQ.U
Invesque at a Glance

 MACRO OPPORTUNITY                  INVESTMENT THESIS                    STRATEGY

   Massive wave of aging            Health care real estate        Build a highly diversified
  baby boomers will utilize        generates long-term, out-          portfolio of income
greater health care services      paced risk adjusted returns.   generating health care real
and spend more dollars on          While any particular asset     estate. Diversify by type of
  health care. We are just        class may come in and out        asset, geography, payor
  beginning, and the real         of favor in any cycle, long-       source and operator.
     growth is ahead.              term, patient investors,      Operating partners are the
                                       will be rewarded.             key to our success.

                                                                                                 2
Invesque Portfolio Snapshot

                99                 12 years                 ~2.3%                    20
           Properties              Average age of          avg. annual         Partnerships with
                                      portfolio         rental escalators(1)     high-quality
                                                                                   operators

                                 Triple-net lease and                            Geographically
         8,500+                      joint venture        ~12 yrs               diversified across
         Beds/Suites              structure provides    Weighted average
                                                         lease maturity
                                                                                19 states
       577,000                   stable cash                                        &
             MOB ft2                flow                                       2 Canadian
(1) Triple net lease portfolio
                                                                               Provinces
                                                                                                     3
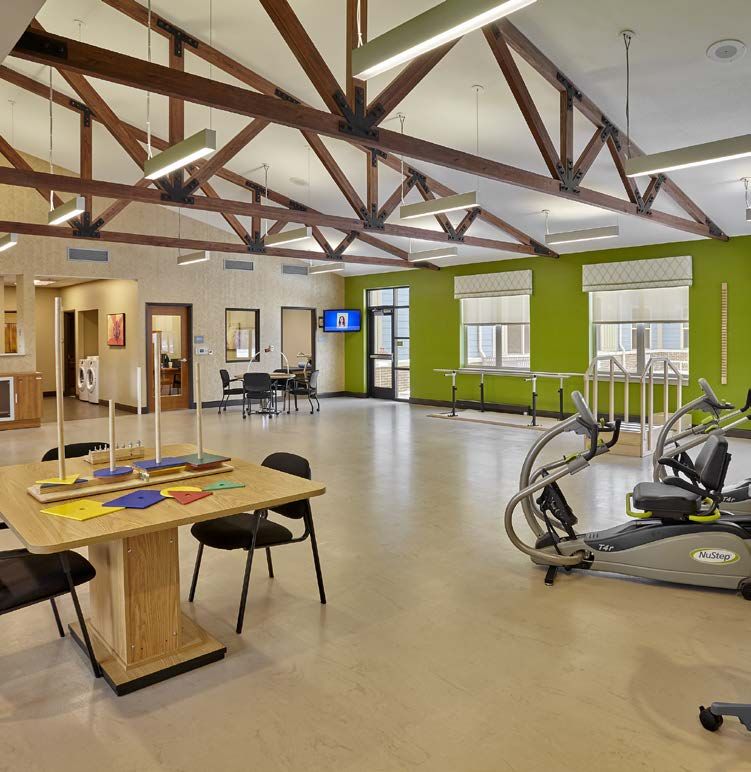
Spectrum of Care

              Hospitals

              Inpatient Acute Care
High Acuity
                                Skilled Nursing and Care

                                Post Acute/Transitional Care (TC)
                                Long Term Care (LTC)

                                            Seniors Housing

                                             Memory Care (MC)
                                             Assisted Living (AL)
                                             Independent Living (IL)
                                             Senior Apartments

                                                 Complimentary Health Care

                                                 Medical Office Buildings
                                                 Free Standing Emergency
                                                 Ambulatory Surgery Center

                       Low Acuity                Urgent Care Center
                                                                             4
Attractive & Stable Industry Dynamics
Highly fragmented industry focused on a need-driven, cost-effective care model
HIGHLY FRAGMENTED INDUSTRY
Top 10 skilled nursing facility owners represent
~17% of total beds
Top 10 assisted living & independent living
community owners represent ~27% of total suites
COST-EFFECTIVE CARE ALTERNATIVES
Transitional Care and Long Term Care properties
provide some of the most cost-effective care
alternatives for third-party payer sources
NEED-DRIVEN SERVICES
Approximately 70% of people over age 65 will require
some type of senior care service during their lifetime
Data Source: National Investment Center for Seniors Housing & Care (NIC)
5Preparing for Unprecedented Growth
We are at the leading edge of the aging baby boom demographic
4,500 Future Need
Age 58
4,000
Age 63
# OF ANNUAL BIRTHS
Age 68
3,500
(IN THOUSANDS)
Utilizing Current Aging Facilities
3,000
Age 98
Age 93
Age 73
2,500
Age 88
Age 78
Age 83
2,000
1,500
1,000
1920 1925 1930 1935 1940 1945 1950 1955 1960
BIRTH YEAR
Data Source: United States Census Bureau
6Building a Diversified Portfolio
~30% ~30%
Seniors Housing Skilled Nursing
Joint Ventures Sale / Leaseback
Sale / Leaseback Capex Loans
Capex Loans
Long Term Care
Independent Living Traditional Skilled Nursing
Assisted Living Transitional Care
Memory Care
5-10% ~30%
Development Strategic Health Care
Mezzanine Loans Sale / Leaseback
Preferred Equity Joint Ventures
Seniors Housing Medical Office
Skilled Nursing Outpatient Surgical Centers
Strategic Health Care Behavioral Health
Free Standing Emergency
Other Health Assets
7Clear Pathway to Growth
Focused, Disciplined and Accretive Growth Strategy
Development Partnerships
Invesque has arrangements
Acquisition Pipeline
with sought after developers
to provide development
Current Operating Portfolio Experienced management financing in exchange for the
team with access to unique right to acquire properties
pipeline of acquisitions from
Triple-net leases with annual
its deep network of owner,
contractual rental escalators of
operator, developer, lender
approximently 2.3%
and broker relationships
Expansion opportunities with
current operating partners
8Building a Strong Platform
$1.4
BILLION
$1.3
BILLION
99
89
$747
$636 $680 MILLION
$575 $598 MILLION
MILLION
MILLION MILLION
$443
MILLION
$303
38 40
MILLION
35
32
28
23
11
APR JUN OCT NOV DEC MAY DEC FEB JAN
2016 2016 2016 2016 2016 2017 2017 2018 2019
9Care Investment Trust:
A C A S E S T U D Y I N P O R T F O L I O G R O W T H & D I V E R S I F I C AT I O N
In 2018, Invesque closed on the transformative US$425 million acquisition of Care
Investment Trust, comprising a portfolio of 42 high quality seniors housing and care
properties across the United States
Attractive and strategic portfolio acquisition
Enhances scale and investment platform
Improves diversification by tenant and geography
Increases exposure to private pay senior housing
Attractive acquisition metrics
Shares issued at $9.75 validates embedded value in Invesque portfolio
Accretive to 2018E AFFO per share
10Mohawk Medical Properties REIT:
A C A S E S T U D Y O F D I V E R S I F I C AT I O N A N D E S TA B L I S H I N G
A P L AT F O R M F O R G R O W T H
In 2018, Invesque expanded its portfolio to include medical office buildings with the US$138
million acquisition of Mohawk Medical Properties REIT. The acquisition was comprised of 14
properties totaling more than 500,000 ft2 in Canada and the United States.
Comprehensive entry into a new asset class
Solid investment with stable occupancy
Enhances diversification with addition of strategic properties
Continue increasing exposure to private pay
All stock transaction at $9.75 demonstrating embedded value in portfolio
Accretive to 2018E AFFO per share
11Well-established Industry Leading Operating Partners
12Geographically Diverse Footprint
99 Properties 8,500+ Suites & Beds 577,000 MOB ft2 ~US$1.4B of Investment Properties
3 AB
12 ON
ONTARIO
9 NY
2 CA 2 NE PA 15 2 NJ
IL 12 2 IN 3 MD
2 TN
KS 2 6 VA
1 MO
2 TN
AR 1 4 SC
AZ 1 GA 3
TX 13
1 LA
3 FL
All information provided includes announced transactions
13Financial Profile & Strategy
CONSERVATIVE DEBT PROFILE
• Prospective targeted debt profile of 50 – 55% of
Total Assets
• 54% as of September 30, 2018, 48% excluding
debentures
• 80% fixed rate / 20% floating rate
LOW COST OF CAPITAL & CONSERVATIVE PAYOUT
RATIO
• Weighted average interest rate of 5.0% as of
September 30, 2018
• 76% payout ratio for the nine months ending
September 30, 2018
• Dividends designated as eligible dividends for
Canadian tax purposes, unless otherwise
indicated
FLEXIBLE DEBT FUNDING STRUCTURE CONSERVATIVE FINANCIAL
POSITIONED FOR GROWTH
STRUCTURE WITH ATTRACTIVE
• $400m senior secured credit facility which DEBT TERMS
includes a $200m term loan and $200m
revolver
• Average debt maturity of 4.6 years
14Investment Highlights
Strong yield with a conservative leverage profile
Stable cash flow from triple-net leases with upside from both contractual rent
escalations and JV partnerships
Experienced and aligned management team with a track record of delivering value
Strong partnerships with leading operators and health care providers
Investment platform and industry positioned for future growth
Attractive asset class supported by compelling demographics
15Experienced Leadership Team
• Previously Executive Vice President of Mainstreet and
HealthLease Properties REIT.
SCOTT WHITE
Chief Executive Officer • 20+ years of investment banking, accounting, real estate
and capital markets experience.
• Former Senior Vice President at Brookfield Asset
Management and director at Citigroup.
• Previously Chief Financial Officer of Mainstreet and CFO of
HealthLease Properties.
ADLAI CHESTER
• 15+ years of experience in finance, real estate, investments,
Chief Investment Officer
development and capital markets.
• Awarded CFO of the Year in 2014 and earned a spot on the
40 under 40 list in 2015 by the IBJ.
• Previously Senior Vice President – Finance of Mainstreet.
• 14 years of finance and accounting experience in real estate.
SCOTT HIGGS
• Significant experience working with public companies as a
Chief Financial Officer
Senior Manager with KPMG, including advising on multiple
initial public offerings.
16Appendix
17Mohawk MOB Portfolio
OPPORTUNITY OVERVIEW
Strategic Rationale
• High quality medical properties
• Stable occupancy of 90%
Solid Investment
• Multi-tenanted physician practices in a high-earnings multiple asset class
• Initial 15 MOB Purchase Price USD$145m
Transformative • Opportunity to enter into a highly desirable core asset class across North America
• New strategic partnership with industry veterans proficient in management and
Expert Partners acquisitions in the U.S. and Canada
• In-place management team with capacity to take on additional properties
Growth Platform
• Focused on growth in North America
• In line with IVQ’s business plan to invest in strategic health care real estate in
Strategic addition to senior living, skilled nursing, and development
• Positively impacts each of IVQ’s key diversification metrics: asset type, geography,
Added Diversification private pay, and tenant mix
18Mohawk MOB Portfolio
Geographic Snapshot Geographic Snapshot
Asset Type: Medical Office Buildings Canada
Average Occupancy: 90%
Portfolio Size: 15 buildings (577,000 FT2)
Purchase Price: $145m Alberta – 3
Asset Management Tiered payment structure designed to reduce Ontario – 8
Fee: costs
United States
New York – 2
Capital Structure
Florida – 2
61.4% 38.6%
Debt Share Takeback B/S Cash
$89m $35m $21m
$0m $20m $40m $60m $80m $100m $120m $140m $160m
19Forward-Looking Statements
This presentation contains forward-looking statements which reflect management’s expectations regarding objectives, plans, goals,
strategies, future growth, performance and business prospects and opportunities of Invesque. (the “Company” or “IVQ”). The words
“plans”, “expects”, “does not expect”, “scheduled”, “estimates”, “intends”, “anticipates”, “does not anticipate”, “projects”, “believes” or variations
of such words and phrases or statements to the effect that certain actions, events or results “may”, “will”, “could”, “would”, “might”, “occur”,
“be achieved” or “continue” and similar expressions identify forward-looking statements. Some of the specific forward-looking statements in
this presentation include, but are not limited to, statements with respect to the following: the ability of the Company to execute its growth
strategies and the expected seniors housing and care industry and demographic trends. Forward-looking statements are necessarily based
on a number of estimates and assumptions that, while considered reasonable by management of the Company as of the date of this
presentation, are inherently subject to significant business, economic and competitive uncertainties and contingencies. The Company’s
estimates, beliefs and assumptions, which may prove to be incorrect, include the various assumptions set forth herein, including, but not
limited to, the Company achieving its future growth potential, results of operations, future prospects and opportunities, the demographic
and industry trends remaining unchanged, no change in legislative or regulatory matters, future levels of indebtedness, the tax laws as
currently in effect remaining unchanged, the continual availability of capital and the current economic conditions remaining un-changed.
When relying on forward looking statements to make decisions, the Company cautions readers not to place undue reliance on these
statements, as forward-looking statements involve significant risks and uncertainties, should not be read as guarantees of future
performance or results, and will not necessarily be accurate indications of whether or not the times at or by which such performance or
results will be achieved. A number of factors could cause actual results to differ materially from the results discussed in the forward-looking
statements, including, but not limited to, the factors discussed under the heading “Risk Factors” in the Company’s most recent annual
information form, which is available at www.sedar.com. The Company assumes no obligation to publicly update or revise any forward-
looking statement, whether as a result of new information, future events or otherwise. Additional information relating to the Company may
be found on SEDAR at www.sedar.com.
All monetary values in this document are in US dollars unless otherwise specified.
20211 W. Main Street, Suite 400 Carmel, IN 46032 (317) 643-4017 ∙ Invesque.com
You can also read