Analysis of Noise Level in a Campus Area: Case Study for Gazi University Maltepe Campus
←
→
Page content transcription
If your browser does not render page correctly, please read the page content below
Ergonomics International Journal
                                                                                                                    ISSN: 2577-2953

   Analysis of Noise Level in a Campus Area: Case Study for Gazi
                                         University Maltepe Campus

Erman Çakıt*
                                                                                                              Research Article
Department of Industrial Engineering, Gazi University, Turkey                                                   Volume 3 Issue 4
                                                                                                          Received Date: May 28, 2019
*Corresponding author: Erman Çakıt, Department of Industrial Engineering, Gazi
                                                                                                          Published Date: July 01, 2019
University, Turkey, Tel: +90 312 582 3809; Email: ecakit@gazi.edu.tr; ecakit@gmail.com                     DOI: 10.23880/eoij-16000211

 Abstract
There are several kind of sources such as cars, airplanes, vacuum cleaners, obtained as a result of technological
improvement cause noise while they are working. If they are not controlled, high noise pollution will cause health
problems including hearing loss, insomnia and psychological deteriorations. Noise pollution effects Gazi University
Engineering Faculty Campus because of its proximity to the highways. For the purpose of assessing noise level at
different points in campus area, some measurements were colllected at open and close places by using sound level meter.
To capture the high noise events of campus’ particular areas, noise levels were collected with a sound level meter at 16
points within the campus at three different timings (9– 12 am, 12–2 pm, and 2–4 pm) over two cycles of measurements.
Based on the obtained results, higher noise levels were observed during morning times and there should be taken
immediate precautions to overcome noise pollution in campus area.

Keywords: Noise Mapping; Noise Pollution; Gazi University Campus Area; Sound Level Meter

 Introduction                                                               quiet environment. In the first instance, efforts should be
                                                                            made to find a site that is situated in a comparatively
    According to Florence Nightingale “Unnecessary noise                    quiet environment. At least the site should not be close to
is the most cruel abuse of care which can be inflicted on                   noisy highways, railways, etc [16]. In the scope of
either the sick or the well.” [1]. The word “noise” is                      cognitive performance, noise may affect the learning
derived from the Latin word "nausea," meaning                               behaviors of students, and very noisy places are not
“seasickness” or a “sensation of discomfort” and also                       suitable for teaching. Several studies have been conducted
defined as “unwanted sound”, which is among the most                        on the influence of environmental noise upon the learning
pervasive pollutants today [2]. Noise causes a variety of                   and working performance [17-22]. A number of studies
mental and physical effects relevant to health problems                     have showed that exposure to environmental noise can
including hearing loss, insomnia and psychological                          lead to a decrease in cognitive performance including
deteriorations. Recently, several studies have been                         difficulties in communication, impaired attention,
conducted that highway/road traffic has become a main                       frustration, and noise annoyance on performance [17-21].
reason of the noise pollution and produced many adverse
health effects on humans [3-15].                                               An increase emerged in the number of private vehicles
                                                                            regarding the increase in the number of people (students,
   Colleges, universities, schools, libraries, and hospitals                academicians, and administrative personnel, etc.) on the
are considered to be a Silent Zone and require an average                   campus. On Gazi University Maltepe campus, daytime

 Analysis of Noise Level in a Campus Area: Case Study for Gazi University Maltepe Campus                                 Ergonomics Int J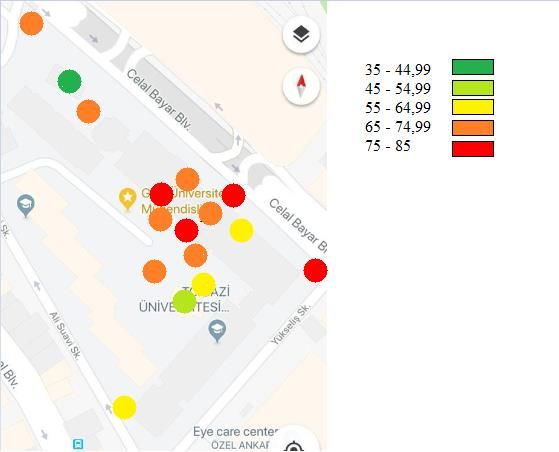
2
Ergonomics International Journal
teaching is offered in all departments while some Methodology
departments also provide evening courses. Therefore,
academic programs continue during daytime and evening An Extech Instruments model number 407232 digital
hours. That means daytime and evening time noise sound pressure level meters with measuring range of 30–
distribution collectively holds crucial value in this area. 130 dB, accuracy of ±1.5 dB was used for the monitoring
The objectives of this study are to perform the noise level noise levels. A total of 16 sampling collection points was
measurements and determine the noise generated at Gazi taken of readings and eight timings were chosen for the
University Engineering Faculty campus on the academic study: 9 am, 10 am, 11 am, 12 pm, 1 pm, 2 pm, 3 pm and 4
setting. pm to capture the high noise events of campus’ particular
areas (Figure 2).
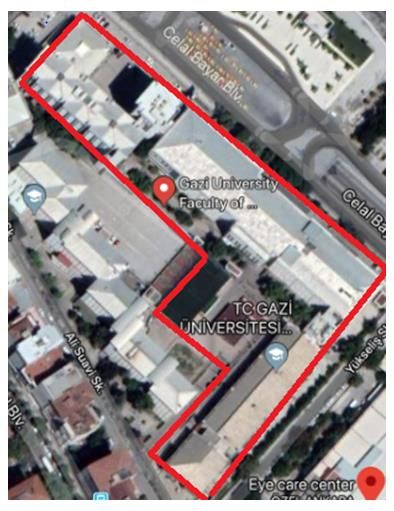
Study Area
The research area is the campus of the Engineering
Faculty of Gazi University. The campus covers an
approximately 20.000 m2 area. The Faculty includes
Department of Industrial Engineering, Department of Civil
Engineering, Department of Chemical Engineering,
Department of Mechanical Engineering, Department of
Computer Engineering, Department of Electrical
Engineering, and Faculty of Architecture. Approximately
3000 students have been studying in the faculty. There is
also a library located in the faculty building. The location
of the study area is illustrated in Figure 1.
Figure 2: Measurement Points’ Locations.
1) Campus Back Gate
2) Campus Front Gate 1
3) Campus Front Gate 2
4) Faculty Back Entrance
5) Faculty Front Entrance
6) Outside of Kesit Cafe
7) Back Garden
8) Front Side of Dean’s Office
9) Inside of Kesit Cafe
10) Simitci Cafe
11) Library
12) Hallway
13) Dining Hall
Figure 1: Location of Study Area. 14) Canteen
15) Common Area
16) Inside of Dean’s Office
Erman Çakıt. Analysis of Noise Level in a Campus Area: Case Study for Gazi University Copyright© Erman Çakıt.
Maltepe Campus. Ergonomics Int J 2019, 3(4): 000211.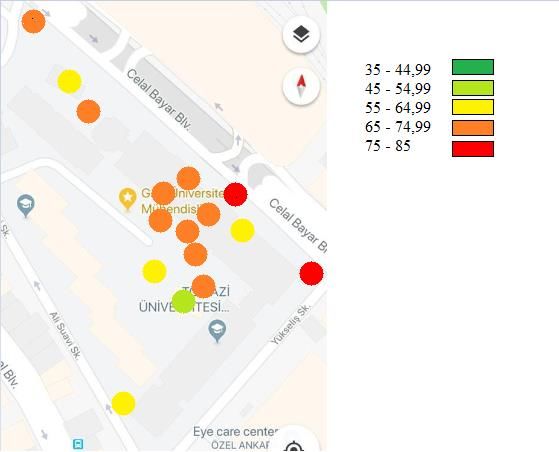
3
                                                                                    Ergonomics International Journal
    In this study, the aim was to determine the dimensions                     noisiest day in a week. There is a reason for measuring
of noise pollution of Engineering Faculty Campus of Gazi                       maximum values in this study that the values taken at
University. For achieving this aim, the required                               random values are lower than the actual noise level and
measurements were collected in the areas that are                              these values can be misleading. The measurements made
divided into two sections as outdoor and indoor areas                          in the closed areas were made by also recording the
(Table 1).                                                                     maximum values with respect to every hour on Monday,
                                                                               which is determined the noisiest day in a week. The
           Outdoor Areas                       Indoor Areas                    values are shown on the table. These values are obtained
    1     Campus Back Gate            9      Inside of Kesit Cafe              during three days and their means were calculated. It can
    2    Campus Front Gate 1         10          Simitci Cafe                  be seen that the lowest measurements were obtained in
    3    Campus Front Gate 2         11            Library                     the morning hours especially at 9 am or 10 am because of
    4   Faculty Back Entrance        12            Hallway                     the fact that the campus is not crowded at those hours
    5   Faculty Front Entrance       13          Dining Hall                   due to the course schedule of students.
    6    Outside of Kesit Cafe       14            Canteen
    7        Back Garden             15        Common Area                         The reason behind the high values observed at noon
         Front Side of Dean’s                                                  hours is most of the students were at their lunch breaks
    8                                16     Inside of Dean’s Office            and they spend most of their time in outdoors or indoors
                 Office
                                                                               during this period. On the other hand, Library has been
Table 1: Measurement Points.                                                   observed as one of the silent location in campus area.
                                                                               Other lowest values were measured in Dean’s Office
    Results and Discussion                                                     because these workplaces are dedicated to management
                                                                               of faculty. As the lectures are mostly over until afternoon,
   The measurements collected in the open areas were                           the lower values were obtained while comparing with
analyzed by recording the maximum values with respect                          sound values at noon. The results are illustrated in
to every hour on Monday, which is determined the                               Figures 3 and 4.

           85.

           80.

           75.
                                                                                                      1) Campus Back Gate
                                                                                                      2) Campus Front Gate 1
           70.                                                                                        3) Campus Front Gate 2
                                                                                                      4) Faculty Back Entrance
                                                                                                      5) Facuty Front Entrance
           65.                                                                                        6) Outside of Kesit Cafe
                                                                                                      7) Back Garden

           60.

           55.

           50.
                  9 a.m 10 a.m 11 a.m 12 p.m 1 p.m                2 p.m     3 p.m    4 p.m
                                                      Figure 3: Results of Outdoor Places.

    Erman Çakıt. Analysis of Noise Level in a Campus Area: Case Study for Gazi University                          Copyright© Erman Çakıt.
    Maltepe Campus. Ergonomics Int J 2019, 3(4): 000211.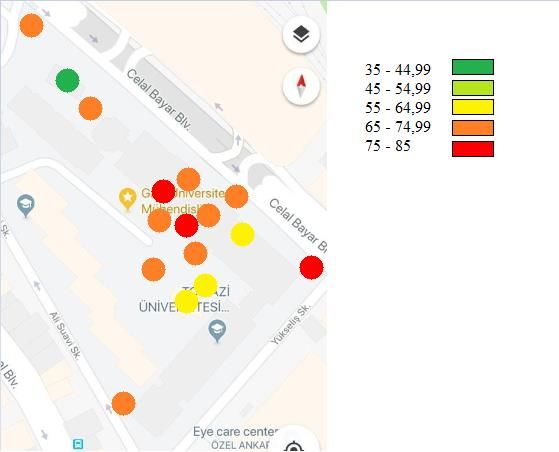
4
Ergonomics International Journal
85.
80.
75.
70. 9) Inside of Kesit Cafe
10) Simitci Cafe
65. 11) Library
12) Hallway
60.
13) Dining Hall
55. 14) Canteen
15) Common Area
50. 16) Inside of Dean's Office
45.
40.
35.
9 a.m 10 a.m 11 a.m 12 p.m 1 p.m 2 p.m 3 p.m 4 p.m
Figure 4: Results of Indoor Places.
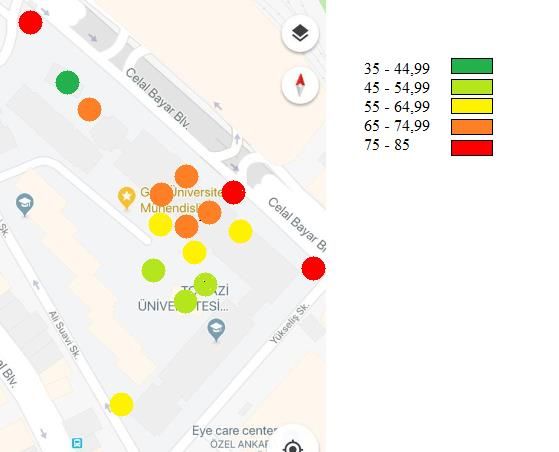
Our results are also shown on a map too. In this format The buildings on the campus closer to the highway are the
the locations which has higher voice level values are structures most severely exposed to noise during daytime
shown with red and orange and the least noisy areas are time zone.
shown with light green and dark green (Figures 5a to 5i).
Figure 5a: Voice Levels at 9 a.m. Figure 5b: Voice Levels at 10 a.m.
Erman Çakıt. Analysis of Noise Level in a Campus Area: Case Study for Gazi University Copyright© Erman Çakıt.
Maltepe Campus. Ergonomics Int J 2019, 3(4): 000211.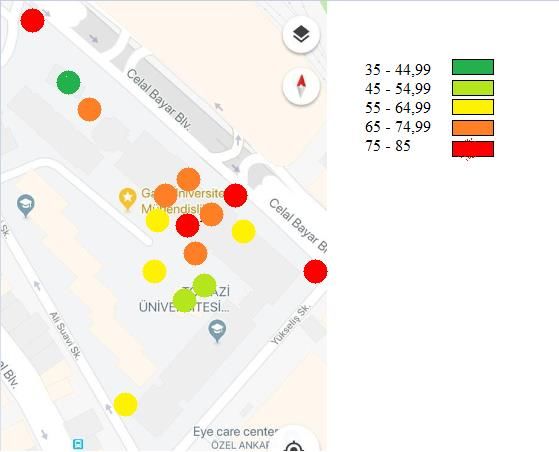
5
                                                                                   Ergonomics International Journal

                            Figure 5c: Voice Levels at 11 a.m.                         Figure 5d: Voice Levels at 12 p.m.

                            Figure 5e: Voice Levels at 1 p.m.                          Figure 5f: Voice Levels at 2 p.m.

                          Figure 5g: Voice Levels at 3 p.m.                            Figure 5h: Voice Levels at 4 p.m.

    Erman Çakıt. Analysis of Noise Level in a Campus Area: Case Study for Gazi University                           Copyright© Erman Çakıt.
    Maltepe Campus. Ergonomics Int J 2019, 3(4): 000211.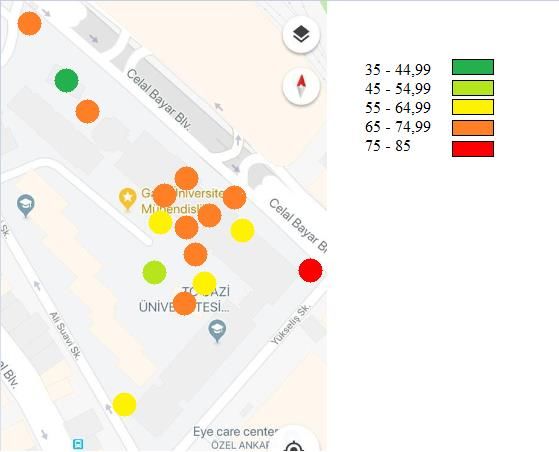
6
                                                                                   Ergonomics International Journal

                                                     Figure 5i: Average Voice Levels Map.

    Within the context of the analysis conducted in Table                      ranges, thus these places are not optimal for sound level
3, the results were compared with allowed values that                          according to sound regulation and control values. The
were suggested from noise regulation and control. It is                        main reasons of this noise pollution are motorized
clearly seen that locations that are numbered as 1, 4, 6, 9,                   vehicles that are running at high volume. To handle with
13 and 16 are in the allowed range (Table 3).                                  this problem, vehicles’ noise should be regulated
Furthermore, other locations that are not in the allowed                       according to the threshold values.

              Locations                            Mean values                       Standard Deviations            Allowed Values
    1) Campus Back Gate                              60,57                                  2,53                          65
    2) Campus Front Gate 1                           77,49                                  1,38                          65
    3) Campus Front Gate 2                           72,84                                  2,72                          65
    4) Faculty Back Entrance                         65,94                                  1,49                          70
    5) Faculty Front Entrance                        76,69                                  1,60                          70
    6) Outside of Kesit Cafe                         59,70                                  4,93                          65
    7) Back Garden                                   65,74                                  4,00                          65
    8) Front Side of Dean’s Office                   68,95                                  2,41                          65
    9) Inside of Kesit Cafe                          53,36                                  6,61                          60
    10) Simitci Cafe                                 73,59                                  2,58                          60
    11) Library                                      57,14                                  1,28                          45
    12) Hallway                                      69,36                                  2,57                          60
    13) Dining Hall                                  59,45                                  8,10                          60
    14) Canteen                                      73,33                                  3,02                          60
    15) Common Area                                  71,60                                  1,95                          60
    16) Inside of Deans Office                       44,66                                  6,85                          60
Table 3: Mean Values, Standard Deviations and Allowed Voice Levels.

   To eliminate and/or minimize environmental noise                            sound insulation systems on the current faculty buildings
pollution on the campus region, it is compulsory to take                       on campus setting, mounting double glaze windows inside
emergency measures for the current and future campus                           all indoor areas, and selecting suitable materials to use.
area. Some of the advised measures to take are installing

    Erman Çakıt. Analysis of Noise Level in a Campus Area: Case Study for Gazi University                         Copyright© Erman Çakıt.
    Maltepe Campus. Ergonomics Int J 2019, 3(4): 000211.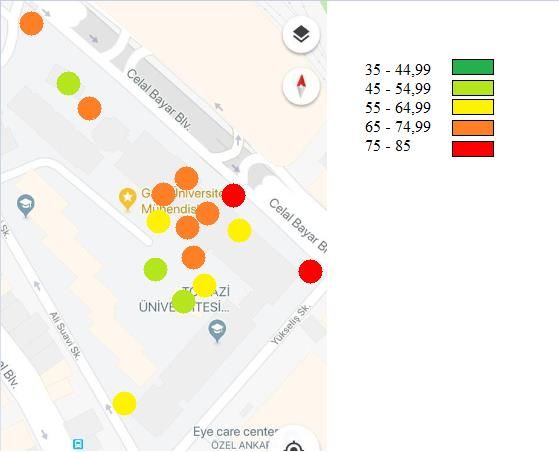
7
                                                                                    Ergonomics International Journal
    Conclusion                                                                 9.   Zannin PHT, De Sant Ana DQ (2011) Noise mapping at
                                                                                    different stages of a freeway redevelopment project-a
    The population of Gazi University Maltepe campus is                             case study in Brazil. Applied Acoustics 72(8): 479-
increasing as an effect of expanded student and staff                               486.
number of current departments. As a result of increased
number of students and staff, the number of vehicles also                      10. Colakkadioglu D, Yucel M (2017) Modeling of
increases and this affects noise level in a negative way. In                       TarsusAdana-Gaziantep     highway-induced     noise
this study, the noise levels were conducted with sound                             pollution within the scope of Adana city and
level meter in Gazi University Engineering Faculty                                 estimated the affected population. Applied Acoustics
Campus. According to the obtained results, there are                               115: 158-165.
many places in Gazi University Engineering Faculty
Campus that have noise pollution and our results help us                       11. Roswall N, Nielsen OR, Ketzel M, Gammelmark A,
to understand reducing the noise levels in common areas.                           Overvad K, et al. (2017) Long-term residential road
Campus management should try to reduce the noise level                             traffic noise and NO2 exposure in relation to risk of
to provide better educational environment for all                                  incident myocardial infarction-a Danish cohort study.
students and lecturers. Therefore, measures should be                              Environmental Research 156: 80-86.
taken in such locations to reduce the noise levels so that
                                                                               12. Babisch W, Beule B, Schust M, Kersten N, Ising H
classrooms will not be subjected to external noise.
                                                                                   (2005) Traffic noise and risk of myocardial infarction.
                                                                                   Epidemiology 16(1): 33-40.
    References
                                                                               13. La Torre G, Moscato U, La Torre F, Ballini P, Marchi S,
1.     Nightingale F (1992) Notes on nursing: What it is, and                      et al. (2007) Environmental noise exposure and
       what it is not. Lippincott Williams & Wilkins.                              population health: a cross-sectional study in the
                                                                                   province of Rome. Journal of Public Health 15: 339-
2.     Basner M, Babisch W, Davis A, Brink M, Clark C, et al.
                                                                                   344.
       (2014) Auditory and non-auditory effects of noise on
       health. The lancet 383(9925): 1325-1332.                                14. Moudon AN (2009) Real noise from the urban
                                                                                   environment: how ambient community noise affects
3.     Zannin PHT, Diniz FB, Calixto A, Barbosa W (2002)
                                                                                   health and what can be done about it. Am J Prev Med
       Environmental noise pollution in the city of Curitiba,
                                                                                   37(2): 167-171.
       Brazil. Applied Acoustics 63(4): 351-358.
                                                                               15. WHO (2011) Burden of disease from environmental
4.     Brainard JS, Jones AP, Bateman IJ, Lowett AA (2004)
                                                                                   noise: Quantification of healthy life years lost in
       Exposure to environmental urban noise pollution in
                                                                                   Europe, WHO Regional Office for Europe, World
       Birmingham. Urban Studies 41(13): 2581-2600.
                                                                                   Health Organization.
5.     Counsel BD, Muer TD, Yperman I, Botteldooren D
                                                                               16. Thattai D, Sudarsan JS, Sathyanathan R, Ramasamy V
       (2005) The influence of traffic dynamics on urban
                                                                                   (2017) Analysis of noise pollution level in a
       soundscapes. Applied Acoustics 66(2): 175-194.
                                                                                   University campus in South India. In IOP Conference
6.     Lebiedowska B (2005) Acoustics background and                               Series: Earth and Environmental Science IOP
       transportation noise in urbanized areas: a note on the                      Publishing 80(1): 012053.
       relative classification of the city soundscape.
                                                                               17. Pheng HS, Yean TS, Lye KH, Ismail AIM, Kassim S
       Transportation Research Part D: Transport and
                                                                                   (2006) Modeling noise levels in USM penang campus.
       Environment 10(4): 341-345.
                                                                                   In Proceedings 2nd IMT-GT regional conference on
7.     Calixto A, Pulsides C, Zannin PHT (2008) Evaluation                         mathematics, statistics & applications. University
       of transportation noise in urbanized areas. Archives                        Sains Malaysia, Penang.
       of Acoustics 33(2): 185-199.
                                                                               18. Thakur GS (2006) A study of noise around an
8.     Murphy E, King EA, Rice HJ (2009) Estimating human                          educational   institutional  area.    Journal     of
       exposure to transport noise in central Dublin, Ireland.                     Environmental Science & Engineering 48(1): 35-38.
       Environment International 35(2): 298-302.

    Erman Çakıt. Analysis of Noise Level in a Campus Area: Case Study for Gazi University                          Copyright© Erman Çakıt.
    Maltepe Campus. Ergonomics Int J 2019, 3(4): 000211.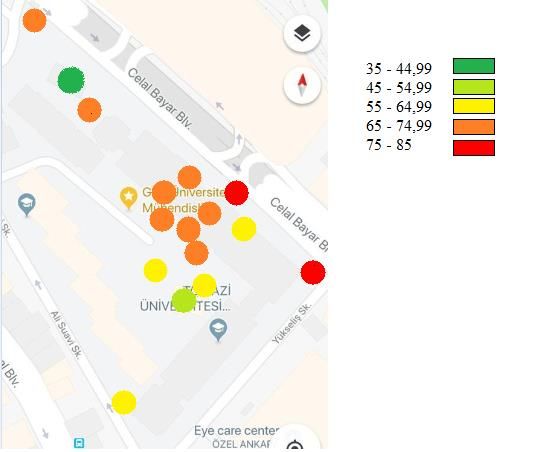
8
                                                                                   Ergonomics International Journal
19. Zannin PH, Zwirtes DP (2009) Evaluation of the                                  of secondary school students in Greater London.
    acoustic performance of classrooms in public schools.                           Applied Acoustics 72(8): 551-555.
    Applied Acoustics 70(4): 626-635.
                                                                               22. Tzivian L, Jakisch M, Winkler A, Weimar C, Hennig F,
20. Goswami S, Nayak SK, Pradhan AC, Dey SK (2011) A                               et al. (2017) Associations of long term exposure to air
    study on traffic noise of two campuses of university,                          pollution and road traffic noise with cognitive
    Balasore, India. Journal of Environmental Biology                              function-an analysis of effect measure modification.
    32(1): 105-109.                                                                Environmental International 103: 30-38.

21. Xie H, Kang J, Tompsett, R (2011) The impacts of
    environmental noise on the academic achievements

    Erman Çakıt. Analysis of Noise Level in a Campus Area: Case Study for Gazi University                         Copyright© Erman Çakıt.
    Maltepe Campus. Ergonomics Int J 2019, 3(4): 000211.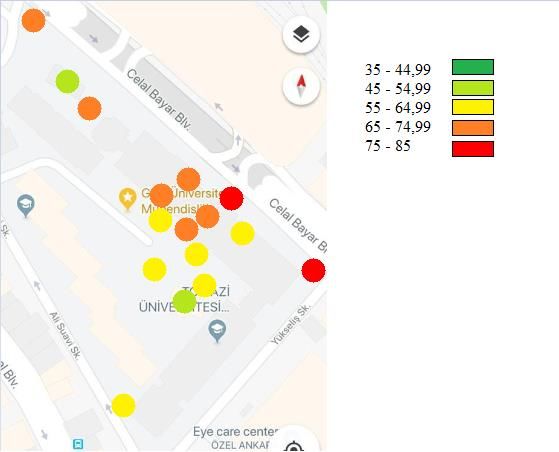
You can also read