RESTORATION OF PEATLAND ECOSYSTEMS AND BIODIVERSITY IN U MINH REGION OF MEKONG DELTA, VIETNAM
←
→
Page content transcription
If your browser does not render page correctly, please read the page content below
15TH INTERNATIONAL PEAT CONGRESS 2016

                                               Abstract No: A-325

  RESTORATION OF PEATLAND ECOSYSTEMS AND BIODIVERSITY IN U MINH
                REGION OF MEKONG DELTA, VIETNAM
                             Le Phat Quoi1, Nguyen Tan Truyen2 and Tran Van Thang3
           1
            Institute for Environment and Natural Resources, National University at HCM City, Vietnam.
                                        2
                                          U Minh Ha National Park, Vietnam

                                    * Corresponding author: quoilp@gmail.com

SUMMARY

Remaining petlands distributed mainly in U Minh region of Lower Mekong Delta and they have protected as
national parks: U Minh Ha and U Minh Thuong National Parks. Since 2010, an appropriate management of fires
and water has applied resulted in no forest fires and ecosystems restored significantly. Some previously species of
fauna and flora, which disappeared due to forest fires and inappropriate management from 2002 to 2009, were
recorded their back presence in 2014. The inventory showed total 14 species of animal and 17 species of plants,
which are in IUCN and Vietnam Red Books, were restored in peatland habitats. Some waterfowls (Leptoptilos
javanicus, Pelecaniformes, Plegadis falcinellus) have begun choosing peatland forest and grassland habitats as
breeding sites. Peatland ecosystems showed the higher density of peatland Melaleuca forests, the lower the number
of plant species and vice versa, which resulted in various plant biodiversity index (H') and species evenness (J').
Average H' value of very spare to spare Melaleuca forests varied from 0.78 - 1.70, and species evenness J' = 0.49 -
0.77, while seasonally inundated grasslands ecosystems increased significantly after applying appropriate
management (H'= 0.43 up to 1.93 and J' from 0.42 up to 1.0). Restoration of Peatland Melaleuca forest plays an
important role in carbon storage and absorbance of carbon dioxides from the atmosphere. The corresponding
estimated carbon storage and Co2-e in Melaleuca forests are of 27.80 tons/ha and Co2-e is of 102.04 tons.ha-1. Then
the total amount of carbon storage and Co2-e of melaleuca forest estimated are 318,949.949 tons and 1,170,546.312
tons in both national parks. An appropriate management of water and fires is one of the activities has resulted in the
successful restoration of ecosystems and biodiversity in peatlands of U Minh region, and UMTNP recognized as
ASEAN Heritage Park (2013) and RAMSAR site in 2015.

Keywords: Peatland, carbon dioxide, ecosystems, biodiversity, Melaleuca

INTRODUCTION

           Tropical peatlands are widely distributed throughout Indonesia, Malaysia and several other countries in
South East Asia. Peat swamp forests are unique habitats for flora and fauna, containing a high proportion of
endemic species (Page et al., 1999). Peat swamp forests are ombrotrophic wetland ecosystems that sequester carbon
into vegetation and, especially, into peat below the forest floor. The woody peat formed in these ecosystems is rich
in C (about 56 % on a dry mass basis) and the peat deposits can be several meters thick over vast areas, making
tropical peatlands globally important C-stores (Page et al., 2011). In addition, peatlands represent globally
significant stores of soil carbon that have been accumulating for millennia and currently, peatlands globally
represent a major store of soil carbon sink for carbon dioxide and source of atmospheric methane (Maria S., 2008).
                                        A comparatively small area of peatlands in Vietnam compared to its regional
                              neighbors. They were found in many parts, however mainly located in U Minh region
                              (Fig.1) where was designed as two national parks: U Minh Ha National Park (UMHNP)
                              and U Minh Thuong National Park (UMTNP). Inappropriate management resulted in
                              large-scale peatland loss during past decades, estimated that more than 64,000 hectares
                              of 1962 (VHP, 1974) down to 11,744.19 hectares of 2013 (Quoi, 2014), and ecosystems
                              degradation of peatlands with major environmental and social impacts in U Minh region
                              located in Ca Mau and Kien Giang Provinces.
                                        Most of the peatlands in U Minh region were covered by Melaleuca and mixed
                              forests, which are important natural ecosystems with high value for biodiversity
                              conservation, climate regulation, and water supplies to communities in the dry season.
 Figure 1: Two peatland areas The peatland complex ecosystems play a special role in maintaining biodiversity as a
 remained in U Minh region,   result of habitat isolation in U Minh region.
 Lower Mekong Delta

                                                                                                                  445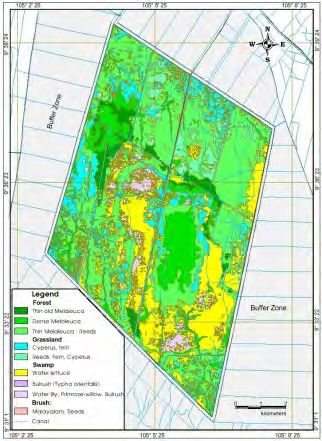
15TH INTERNATIONAL PEAT CONGRESS 2016
This paper, used data collected from APFP (2013), SEAPeat Project (2014) and SNV (2015), focuses on
restoration of ecosystems and biodiversity resulted from reasonable hydrological management in peatland U Minh
region, including UMHNP and UMTNP. Estimation of capable carbon storage and carbon dioxide equivalent (CO2)
absorbed from the atmosphere by forest also is discussed within.
METHODOLOGY
The multi-satellite imagery of SPOT 5 and Landsat TM7 (2006, 2009, 2010, and 2013) was used to
identify the ecosystems and plant communities. The observation was conducted on a total area of 61,314.20 ha in
peatland U Minh region, however, there were total 643 observed sites were done in two parks.
At each observation site, different size quadrats, of which 1 x 1m2 and 10 x 20m2 random quadrats for
grasslands and forestlands respectively, were used to observe species occurrences, species dominant, parameters of
forest trees (stem density, basal area) used to estimate the amount of carbon dioxide (CO 2) sequestration in
Melaleuca forest.
Evenness of species by Peilon Method is applied, which given by J‘ = H/logS.
Species diversity in plant communities is calculated by biodiversity
index (H') of Shannon - Weiner (1949).
Dominant species is applied by Simpson's dominance index λ, which n
ni
2
is given by i 1 n
To estimate carbon content and carbon dioxide equivalents (CO 2-e) absorption by forest, calculation was
applied with following steps: average biomass, the amount of carbon stored in plant biomass per area, amount of
CO2 absorbed from the atmosphere by forest trees. The method of NIRI (Norman, 2015 after NIKI, 2001) was used
to estimate carbon stored in the tree and CO2 absorption from the atmosphere by forest.
RESULTS AND DISCUSSION
A large area of peatland was considered for satellite interpretation and the survey to record the presence of
peatlands in U Minh region. Base on the result of satellite interpretation and on the ground surveys, once there was
a wide distribution of peatland in U Minh region (61,314.20 ha), however, a large area of peatland was destroyed by
human activities and natural factors, hence, there is the only small area of peatlands, with 9,174.37 ha, being present
mainly in U Minh Ha region and UMTNP (Tab. 1). Except peatlands remained in the national parks, there is still a
considerable area of peatlands in the buffer zone of UMHNP, with 2,296.57 ha, while only several small patches of
peat soils were identified in that of UMTNP.
Table 1: The peatland areas in U Minh region, Lower Mekong Delta of Vietnam.
Peatland Sites Previous peatland area (ha) Remaining Peatland (ha)
U Minh Ha region (Ca Mau province) 35,654.20 5,943.04
U Minh Thuong NP (Kien Giang province) 25,660.00 3,231.33
Total 61,314.20 9,174.37
Ecosystems and biodiversity
From 2000 to 2002, the water level dropped more than 85 cm from soil surface in the dry season was main
causes of forest fires resulted in damages of the large-scale area of peatlands that was about a quarter and two-third
of peatlands in UMHNP and UMTNP respectively, which caused a forest ecosystems degradation and a significant
decline of biodiversity (UMTNP, 2005, UMHNP, 2004).
Since the end of 2003 to 2006, in order to control the forest fires, the water level was kept high throughout
the year has caused degradation of ecosystems and biodiversity, especially that of Melaleuca forest habitat in
UMTNP. Under the advice of environmentalists and the consent of local authorities, an integrated management of
water and fire has been applied in peatlands resulted in effectively restoring the ecosystem and biodiversity since
2010. Area of forest restored in both parks up to 13,564.03 ha, which was however not uniform in density. In
UMTNP, Melaleuca forest restored up to 5,504.78 ha, and seasonally inundated grasslands, which disappeared after
forest fires in 2002 and then affected by a prolonging high water level, restored significantly up to 765.32 ha (Tab.
2).
446
15TH INTERNATIONAL PEAT CONGRESS 2016
Table 2: Changes of ecosystems in UMTNP (Kien Giang Province) from 2006 to 2014
The year of 2006 The year of 2009 The year of 2011 The year of 2014
Ecosystems
Area (ha) Area (ha) Area (ha) Area (ha)
Melaleuca forests 3,904.16 4,440.87 4,460.78 5,504.78
Grasslands 2,772.50 0.00 1,447.69 765.32
Aquatic swamps 1,126.74 3,393.37 1,912.80 1,551.17
Tall grass - shrubs 141.80 142.55 142.55 142.55
Total area (ha) 7,945.20 7,976.79 7,963.82 7,963.82
Peatland ecosystems are restored simultaneously with the abundance of plant species recorded with 176
plant species (belonging to 62 families) in UMHNP and 254 species (belonging to 64 families) in UMTNP (APFP,
2013 and SNV, 2014). Some waterfowl (Leptoptilos javanicus, Pelecaniformes, Plegadis falcinellus) have begun
choosing peatland forest and grassland habitats as breeding sites. The fragmentation of forests is a general
consequence of forest fires and inappropriate management which has occurred in peatland forests, which were
restored by planting, mainly Melaleuca, and natural regeneration resulted in the forest covered in various tree
densities (Fig 2, Fig. 3, and Fig. 4).
Figure 2: Forests in U Minh Ha area (Ca Mau Province) Figure 3: Peatland forests in UMHNP (Ca Mau) Figure 4: Peatland forests in
UMTNP (Kien Giang)
The direct comparison of biodiversity among various forest densities that are from partial clearance to
dense forests has received much attention. The high density of Melaleuca forest caused inadequate space and light
indispensable for photosynthesis for other plants species developed. Therefore, the densities of Melaleuca forest
affected to the number of plant species within it.
Numerical classification revealed a highly diverse pattern of variability in the forest examined. Most of
forest plantation is single species forest by Melaleuca, while mixed forests in peat domes dominant by diversity of
indigenous species of trees; therefore, value of biodiversity index (H') of mixed forests (H'= 0.85-1.27) in peat dome
is higher than that of single Melaleuca forest (average H'= 0.53) (Tab. 3). Biodiversity index is quite low in dense
Melaleuca plantation (H'= 0.17- 0.95) (Tab) while this value is high in dense natural Melaleuca forests in UMTNP
(H' value is up to 1.75) (Tab. 4). The result showed the forests restored may deliver conserve levels of biodiversity
but it rarely matches the composition and structure of the original forest cover in U Minh peatlands where the forest
was fired completely from 2000 to 2002.
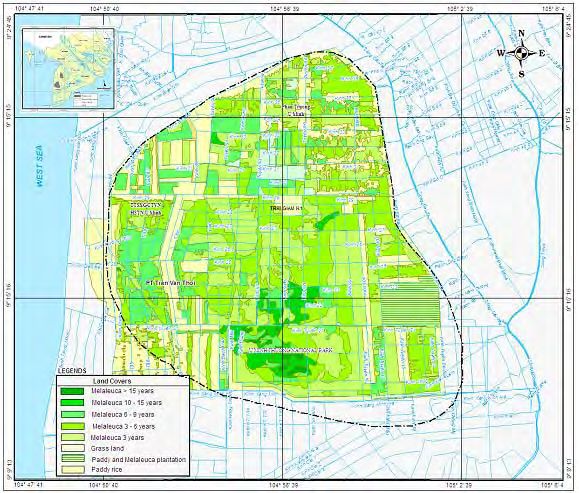
The analyzed data showed the number of plant species started increasing as the plant density below 4,600
trees.ha-1. As forest tree density decreased simultaneously with the increase in a number of plant species, this
resulted in the biodiversity index (H') in sparse to average density forests were higher than that in dense forest (Fig.
5, Fig. 6, Fig. 7, and Fig.8). The higher density of peatland Melaleuca forests, the lower the number of plant species
and vice versa (see Fig. 5 and Fig.7). However, the highest number of plant species recorded was not more than 13
species at each observed plot in spare forest. The structural features of peatland forests are a greater abundance and
diversity of lianas that could be caused by the competition of dominant lianas and herbaceous species of
Stenochloena palustris, Blechnum serrulatum, Cayratia trifolia that thrived and then overrode other species.
Table 3: Ecosystems and Biodiversity Index in U Minh Ha National Park (Ca Mau Province)
Ecosystems No of sites S N d=S/√N H' ʎ J
Dense forest 15 3 - 11 130 - 240 0.23- 0.86 0.17 - 0.95 0.00 - 0.06 0.10 - 0.52
Average forest 96 2- 8 73 - 156 0.19 - 0.68 0.18 - 1.17 0.00 - 0.21 0.13 - 0.57
Spare forest 72 3 - 10 92 - 142 0.31 - 0,98 0.39 - 1.27 0.03 - 0.25 0.36 - 0.65
Very spare forest 278 3 - 13 11 - 112 0.34 - 1.44 0.08 - 2.20 0.13 - 0.97 0.08 - 0.92
Grassland 66 3 - 12 4 - 105 0.29 - 2.27 0.17 - 2.13 0.10 - 0.92 0.15 - 1.03
44715TH INTERNATIONAL PEAT CONGRESS 2016
Table 4: Ecosystems and Biodiversity Index in U Minh Thuong National Park (Kien Giang Province)
Ecosystems No of sites S N d=S/√N H' ʎ J
Dense forest 21 2-7 37 - 137 0.23 - 0.81 0.12 - 1.75 0.20 - 0.95 0.18 - 0.96
Average forest 22 3-8 48 - 140 0.34 - 0.85 0.81 - 1.81 0.18 - 0.38 0.51 - 0.96
Spare forest 14 4-7 66 - 122 0.41 - 0.74 0.57 - 1.63 0.23 - 0.56 0.92 - 0.41
Grasslands 35 2-8 11 - 64 0.26 - 1.05 0.91 - 1.58 0.24 - 0.94 0.21 - 0.98
Aquatic swamp 24 1-7 30 - 71 0.13 - 0.98 0.00 - 1.75 0.21 - 1.00 0.00 - 0.95
The transition from Melaleuca forest community to grassland community is very sharp due to the
environmental condition. Some species of Stenochloena palustris, Blechnum serrulatum and Phragmitex karka
were dominant in the grassland communities and Stenochloena palustris which had covered up to 75% of the
grasslands. Due to grasslands recently restored and being competitive the dominant species of fern, therefore,
biodiversity index varied from 0.17 – 2.20, and evenness of species was among species (J= 0.15 - 1.03). The high
values of biodiversity index recorded in some areas of grasslands, where dominant by species of Cyperaceae (H' =
1.67 - 1.91). Swamps occupied by aquatic vegetation communities in various species. Some areas covered by very
high density of species of Typha angustifolia or Pistia stratiotes (95% to 100%) that have very low biodiversity
index (H'= 0.00 - 0.03), while the other aquatic communities have high diversity index (H‘ = 0.18 -1.75) and
evenness (J = 0.21 – 0.95).
250 14 250 2.5
Melaleuca tree Individual of Melaleuca
Number of plant species 12 Biodiversity Index (H)
200 200 2.0
Number of Melaleuca trees
10
Individual of Melaleuca
150 150 1.5
8
6
100 100 1.0
4
50 50 0.5
2
0 0 0 0.0
111
133
155
177
199
221
243
265
287
309
331
353
375
397
419
441
463
485
507
1
23
45
67
89
101
121
141
161
181
201
221
241
261
281
301
321
341
361
381
401
421
441
461
481
501
521
1
21
41
61
81
Observed Sites Obsrved Sites
Figure 5: Densities of Melaleuca trees and a number of the plant Figure 6: The density of Melaleuca forest and Biodiversity Index (H') in
species in peatland forests in UMHNP. (Ca Mau) peatland forests in UMHNP.
60 9 60 2.50
Melaleuca forest
Melaleuca trees in 100 square meters
8 Biodiversity Index (H')
50 50
Melaleuca trees in 100 square meters
7 2.00
40 6 40
1.50
5
30 30
4
1.00
20 3 20
2 0.50
10 Melaleuca forest 10
1
Number of plant species
0 0 0 0.00
11
16
21
26
31
36
41
46
51
56
61
66
71
76
81
86
91
11
16
21
26
31
36
41
46
51
56
61
66
71
76
81
86
91
1
6
1
6
Observed sites Observed sites
Figure 7: Densities of Melaleuca trees and a number of the plant species in Figure 8: The density of Melaleuca forest and Biodiversity Index (H') in
peatland forests in UMTNP (Kien Giang province) peatland forests in UMTNP (Kien Giang Province)
Carbon storage and carbon dioxide sequestration in peatland forests
Melaleuca forest and plantation dominated in both parks are generally dense and highly productive, and
density-dependent mortality is to be expected by the park managers. Amongst other tropical forests, Melaleuca
forest is carbon stores, and it is considered as carbon dioxide sinks when it has increased in the area. The Melaleuca
forest density, which increased in middle age but decreased in mature age of trees, varied from 5,250 trees.ha -1 in
dense forests and reduced gradually to 360 trees.ha -1 in the very spare forest, in which the different forest densities
resulted in the various amount of forest biomass estimated (Tab. 4 & Tab. 5).
Total biomass estimated of Melaleuca forest and plantation, including above-ground biomass, roots, and
the forest floor, is of 655,657.939 tons, in which total amount of carbon estimated is of 318,949.949 tons stored in
44815TH INTERNATIONAL PEAT CONGRESS 2016
tree tissues and equivalent to 1,170,546.312 tons of CO 2-e sequestration in Melaleuca forests (Table 4, Annex 4 and
5). Due to forest areas has been restored in UMTNP since 2010, the total low biomass, which resulted in the lower
amount of carbon and carbon dioxide than those in UMHNP. In UMHNP forest, the average carbon content stored
is of 27.80 tons.ha-1 and equivalent to 102.04 tons.ha-1 CO2-e in sequestration. Similarly, a study on carbon
adsorption capacity of Melaleuca forests in UMHNP by Vinh (2013) showed average carbon content stored is of
26.90 tons.ha-1.
Table 4: Carbon stored and carbon dioxide equivalent in sequestration in the forest for two parks.
Parameters UMHNP UMTNP Total
Forest area (ha) 8,059.25 5,504.78 13,564.03
-1
Total biomass (tons.area ) 448,147.65 207,510.289 655,657.939
-1
Carbon content (t.C.ha ) 27.803 18.848 -
-1
Carbon dioxides equivalent (tCO2-e.ha ) 102.038 69.173 -
-1
Carbon content (tons.area ) 218,929.320 100,020.629 318,949.949
-1
Carbon dioxide equivalent (CO2-e)(tons.area ) 803,470.604 367,075.708 1,170,546.312
In the buffer zone, a land cover map showed Melaleuca covered in a large area; therefore estimates of 277,044.107
tons of carbon (equivalent to 1,016,751.872 tons of CO2-e) were stored in the standing stock of plantation (Quoi,
2010). However, provincial forest report of 2010 showed a significant decrease of forest land that has been
converted to agricultural land; therefore, this has resulted in decrease a large area of forest resulted in the decrease
of the amount of C stock and CO2-e sequestration in the buffer zone.
CONCLUSION
The peatlands remained only a relatively small area in the U Minh region, the Lower Mekong Delta. A
significant area of peatlands was known as national parks aiming to conserve ecosystem and biodiversity of
peatlands. Unsuitable water management, however, caused to peatland degradation resulted in serious damage to
ecosystems and biodiversity. The water management in UMHNP peatlands has not been as expected. The water
level dropped down deeper 85 cm from the surface in the dry season, which made it easier for forest fires and
oxidation of peat materials.
Melaleuca forest covered predominantly in peatlands in both national parks, however, Melaleuca
plantation dominated in the buffer zone of the UMHNP. High biomass estimated of Peatland Melaleuca forest
resulted in a considerable amount of carbon and carbon dioxide equivalent sequestration. Thus, if the forest fire,
there will be a large amount of carbon content loss and CO 2 equivalent released into the atmosphere.
The application of integrated management of water and fires in peatlands has restored ecosystems and biodiversity,
and forest fire risks limited. The success of peatland management in UMTNP has been recognized as an ASEAN
Heritage Park (AHP) in 2013 and Ramsar Site in 2015.
REFERENCES
1. APFP-Vietnam. 2013. Final report of APFP-Vietnam activities from 2010 to 2013.
2. Joseph Holder. 2005. Peatland hydrology and carbon release: Why small-scale process matters. Philosophical
Transactions of the Royal Society A. 2005. 363. 2891-2913.
3. Maria Strack. 2008. Peatlands and Climate Change. International Peat Society, Vapaudenkatu 12, 40100
Jyväskylä, Finland. ISBN 978-952-99401-1-0.
4. Norman C. Duke , Damien Burrows and Jock Mackenzie. 2015. Mangrove and Freshwater Wetland Habitat
Status of the Torres Strait Islands Biodiversity, Biomass, Changing Condition of Wetlands. the Australian
Government‘s National Environmental Research Program (NERP) Tropical Ecosystems. 2015.
5. Page SE, Rieley JO, Shotyk OW, Weiss D. 1999. Interdependence of peat and vegetation in a tropical peat swamp forest.
Philosophical Transactions of the Royal Society Lond B 354:1885 – 1897.
6. Page, S.E., Rieley, J.O. & Banks, C.J. (2011) Global and regional importance of the tropical peatland carbon
pool. Global Change Biology, 17, 798–818.
7. Quoi, LP. 2010. Inventory of Peatlands in U Minh Ha Region, Ca Mau Province, Vietnam. SNV- Netherlands
Development Organization REDD+ Programme. August 2010. www.snvredd.com.
44915TH INTERNATIONAL PEAT CONGRESS 2016
8. Quoi, LP. 2014. Peatland and vegetation biodiversity assessment in U Minh Ha National Park, Ca Mau
Province, Vietnam. SNV Netherlands Development Organization, German Bunderstag. December 2014.
9. UMHNP (2004) and UMTNP (2005). Report of forest fires in UMH and UMTNP.
10. VHP. 1974. Land Resources Map in Lower Mekong Basin. Vietnam - Holland Project. 1974. CT University.
11. Vinh T. V. and N. T. Truyen. 2013. Study on capacity of Carbon dioxides in Peatlands Melaleuca Forest of U
Minh Ha National Park, Ca Mau Province. Technical Report of UAF, HCM City. 2013.
450You can also read