Addressing reliability requirements in the Bundaberg network area - Ergon Energy
←
→
Page content transcription
If your browser does not render page correctly, please read the page content below
Addressing reliability
             requirements in the
         Bundaberg network area

          Notice on screening for non-
                      network options

                                                    Publication Date: April 2018

Disclaimer
While care was taken in preparation of the information in this Non Network Options Notice, and it is provided in good faith, Ergon Energy
Corporation Limited accepts no responsibility or liability for any loss or damage that may be incurred by any person acting in reliance on this
information or assumptions drawn from it. This document has been prepared for the purpose of inviting information, comment and
discussion from interested parties. The document has been prepared using information provided by a number of third parties. It contains
assumptions regarding, among other things, economic growth and load forecasts which may or may not prove to be correct. All information
should be independently verified to the extent possible before assessing any investment proposal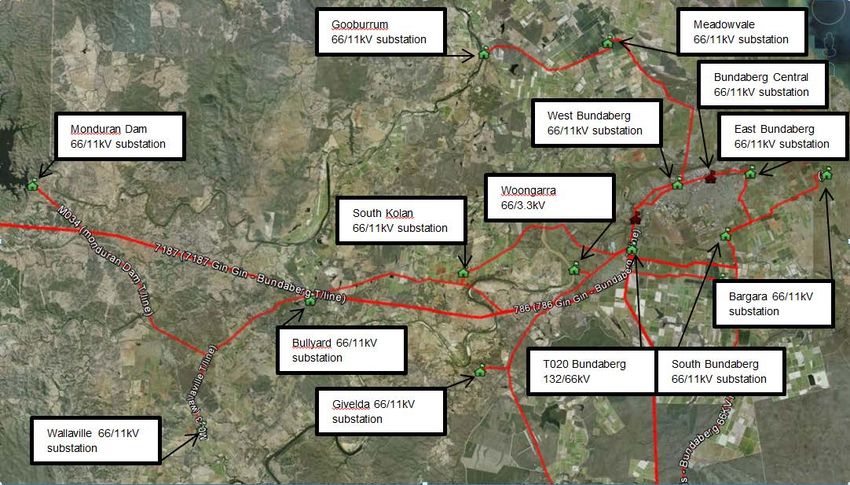
Notice on screening for non-network options; Addressing reliability requirements in the Bundaberg network area.

Table of Contents

1.     Addressing reliability requirements in the Bundaberg network area ......................................... 3
2.     Forecast load, capacity, and network characteristics at Bundaberg substation ........................ 4
     2.1.    Restoration timeframes and safety net .............................................................................. 4
       2.1.1.       Safety net requirements ............................................................................................. 4
       2.1.2.       Safety net analysis ..................................................................................................... 5
     2.2.    Network characteristics ..................................................................................................... 5
       2.2.1.       Geographic region ..................................................................................................... 5
       2.2.2.       Existing supply system............................................................................................... 6
       2.2.3.       Loading - historical and forecast ................................................................................ 7
3.     Proposed preferred network option is to establish bus section breakers .................................. 9
4.     Assessment of non-network solutions .................................................................................... 11
     4.1.    Required demand management characteristics .............................................................. 11
     4.2.    Demand management value ........................................................................................... 13
       4.2.1.       Demand Management (Demand Reduction) ............................................................ 13
       4.2.2.       Demand response ................................................................................................... 13
       4.2.2.1.        Customer Call off load (COL) ............................................................................... 13
       4.2.2.2.        Customer embedded generation (CEG) ............................................................... 13
       4.2.2.3.        Large scale customer generation (LSG) ............................................................... 14
       4.2.2.4.        Customer solar power systems ............................................................................ 14
5.     Conclusion ............................................................................................................................. 15

                                                                                                                                       page 1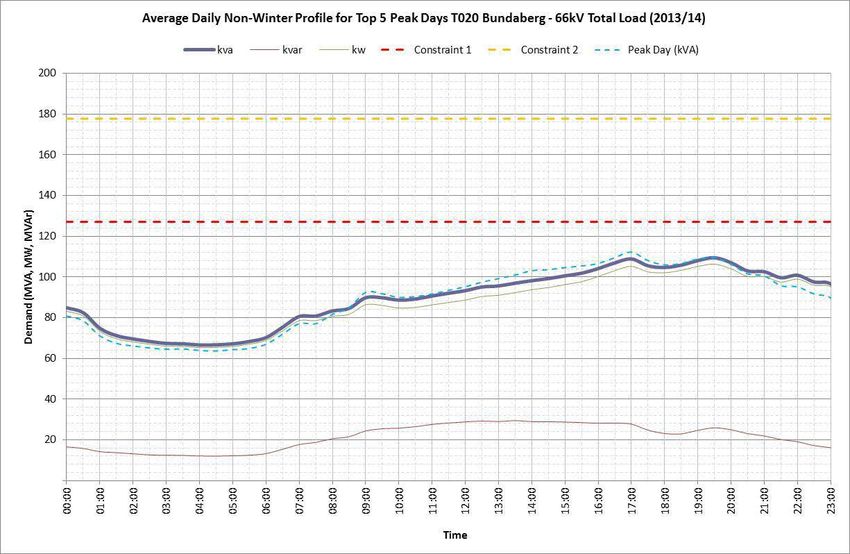
Notice on screening for non-network options; Addressing reliability requirements in the Bundaberg network area.

List of Figures and Tables

Figure 1 – Bundaberg T020 substation safety net analysis. ............................................................ 5
Figure 2 – Bundaberg Sub transmission Network ........................................................................... 6
Figure 3 – The supply area of Bundaberg Substation ..................................................................... 7
Figure 4 – Bundaberg T020 Load Profile and Capability. ................................................................ 8
Figure 5 – Bundaberg T020 66kV Load Duration Curve. ................................................................. 8
Figure 6 – Bundaberg substation load forecast. .............................................................................. 9
Figure 7 – Bundaberg 132kV proposed CB location...................................................................... 10
Figure 8 – Bundaberg 66kV proposed CB location and bus re-arrangement. ................................ 11
Figure 9 – Bundaberg substation forecast and required loading to meet safety net requirements for
a 2 hour restoration. ...................................................................................................................... 12
Figure 10 – Bundaberg substation shortfall to meet safety net requirements ................................ 12
Figure 11 – Demand Management options summary .................................................................... 15

                                                                                                                                    page 2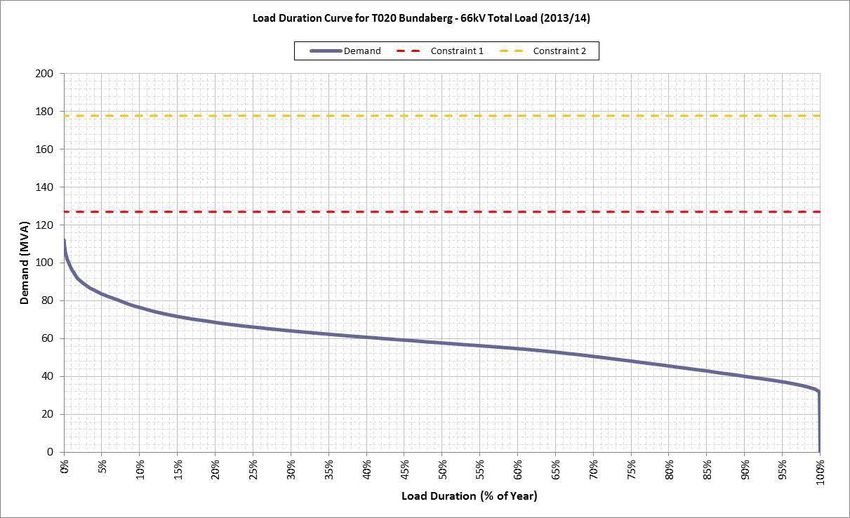
Notice on screening for non-network options; Addressing reliability requirements in the Bundaberg network area.

1.           Addressing reliability requirements in the
     Bundaberg network area
The Bundaberg region consist of approximately 45 000 customers and is located in the Wide Bay-
Burnett area of the Southern Region of Ergon Energy’s Network. The region is supplied by the T20
Bundaberg Substation and its 66kV ring-feed. The West Bundaberg, Bundaberg Central, East
Bundaberg and South Bundaberg substations are connected directly onto the 66kV ring-feed. The
Bargara, Meadowvale and Gooburrum zone substations are supplied via radial lines connected to
the 66kV ring-feed.

A fundamental requirement of Ergon Energy’s Distribution Authority D01/99 is to comply with
Safety Net targets that seek to effectively mitigate the risk of low probability – high consequence
network outages to avoid unexpected customer hardship and / or significant community or
economic disruption. Bundaberg T020 in its current state will not meet the safety net outage
restoration times should a 132kV OR 66kV bus outage occur. Bundaberg T020 bulk supply point
supplies 112MVA at peak load to the wider Bundaberg region and hence a bus outage will have a
significant impact.

Bundaberg T020 bulk supply point supplies between 30 – 112 MVA to the wider Bundaberg region
throughout the year. The expected restoration time for a 132kV or 66kV bus outage at T020
Bundaberg is two hours while the maximum time for unserved load above 20MVA allowable under
safety net is one hour. Therefore regardless of the time of the event, it is expected that Ergon
Energy will breach the Safety Net regulatory requirement should a 132kV or 66kV bus outage
occur at T020 Bundaberg if no investment is made.

Installation of 2 bus section circuit breakers and associated equipment will allow restoration to
comply with Safety Net by lowering the restoration time to under 1 hour for the up to 92MVA of
unserved load should a 132kV or 66kV bus outage occur at T020.

Changes to the National Electricity Rules (NER) in July 2017 have meant that the installation of the
bus circuit breaker and associated infrastructure is now subject to a RIT-D. This notice of no
credible non-network option has been prepared by Ergon Energy in accordance with the
requirements of clause 5.17.4(d) of the National Electricity Rules (NER).

A full discussion of loading and the identified need can be found in the Final Project Assessment
Report (FPAR) for addressing reliability requirements in the Bundaberg network area.

This notice has been prepared under cl. 5.17.4(d) of the NER and summarises Ergon Energy’s
determination that no non-network option is, or forms a significant part of, any potential credible
option for this RIT-D. In particular, it sets out thereasons for Ergon Energy’s determination,
including the methodologies and assumptions used.

                                                                                                                  page 3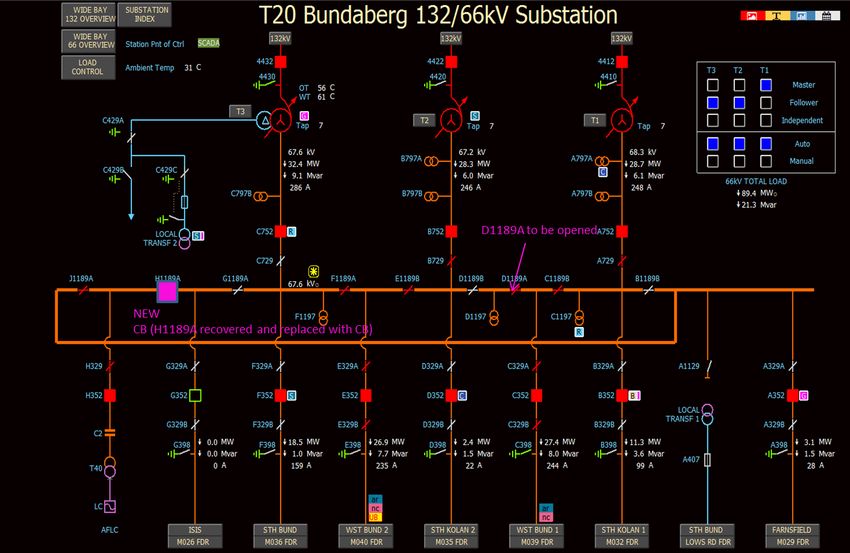
Notice on screening for non-network options; Addressing reliability requirements in the Bundaberg network area.

2.           Forecast load, capacity, and network
     characteristics at Bundaberg substation

2.1. Restoration timeframes and safety net

The primary component of the identified need is an inability to meet safety net requirements in the
event of a bus fault at T020 Bundaberg.

2.1.1. Safety net requirements

A fundamental requirement of Ergon Energy’s Distribution Authority D01/99 is to comply with
Safety Net targets that seek to effectively mitigate the risk of low probability – high consequence
network outages to avoid unexpected customer hardship and / or significant community or
economic disruption. Bundaberg T020 in its current state will not meet the safety net outage
restoration times should a 132kV OR 66kV bus outage occur.

Under the reliability standards, Ergon Energy is no longer required to provide full N-1 security of
supply on the 66kV network that supplies Bundaberg. Instead, a set of supply restoration targets,
known as the ‘Service Safety Net Targets’ apply. The Safety Net targets seek to limit the severity
(and thus the hardship experienced by Ergon Energy customers) following a “credible contingency”
for loads up to the 50% PoE forecast.

Under the Safety Net, Bundaberg is classified as a “Regional Centre” and has the following
restoration targets. The load unserved must be:

     1.   Less than 20 MVA after 1 hour
     2.   Less than 15 MVA after 6 hours
     3.   Less than 5 MVA after 12 hours
     4.   Fully restored within 24 hours

                                                                                                                  page 4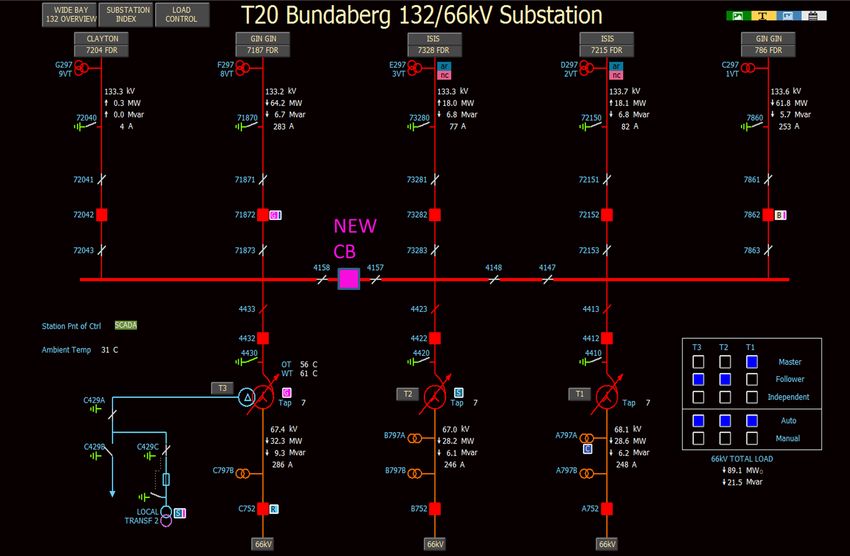
Notice on screening for non-network options; Addressing reliability requirements in the Bundaberg network area.

2.1.2. Safety net analysis

Figure 1 – Bundaberg T020 substation safety net analysis.

As the only supply point into the region, an outage on either the 66kV or 132kV bus will result in
loss of supply to the Bundaberg region.

”Expected” vs ”Target” supply restoration following bus contingency at T020 Bundaberg on a peak
day is shown in Figure 1. If an outage was to occur at any time, as shown in Figure 5, Ergon
Energy would be unable to meet the Safety Net restoration targets. However, it should be noted
that consideration needs to be given to the credibility of such an event occurring (i.e. both the
permanent fault and the timing) before making decisions about the appropriate level of mitigation
(including the option of none).

2.2. Network characteristics

2.2.1. Geographic region

The geographic region covered by this RIT-D is the Bundaberg region which consist of
approximately 45 000 customers and is located in the Wide Bay-Burnett area of the Southern
Region of Ergon Energy’s Network.

                                                                                                                  page 5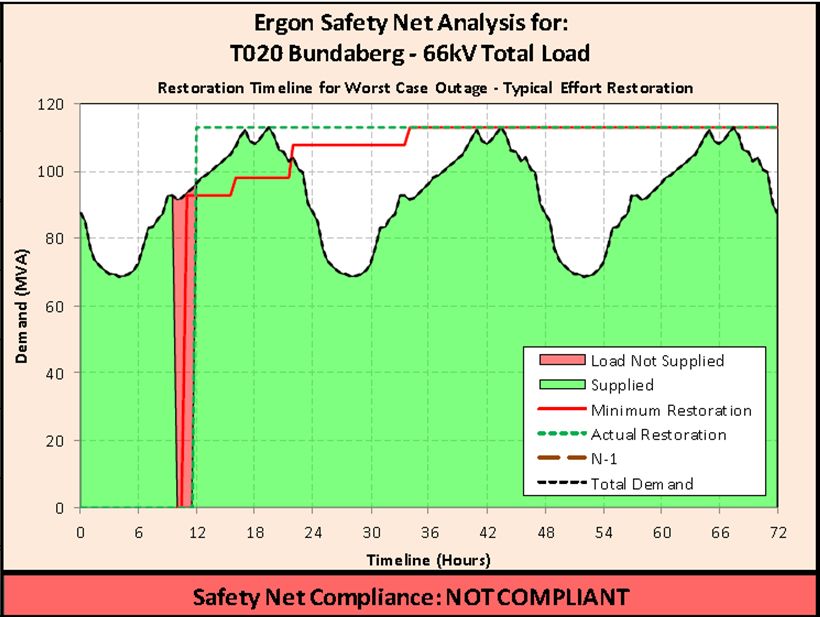
Notice on screening for non-network options; Addressing reliability requirements in the Bundaberg network area.

Figure 2 – Bundaberg Sub transmission Network

2.2.2. Existing supply system

The Bundaberg region is supplied by the T20 Bundaberg Substation. The West Bundaberg,
Bundaberg Central, East Bundaberg and South Bundaberg substations are connected directly onto
the 66kV ring-feed. The Bargara, Meadowvale and Gooburrum zone substations are supplied via
radial lines connected to the 66kV ring-feed.

Bundaberg T020 bulk supply point supplies 112MVA at peak load to the wider Bundaberg region
and hence a bus outage is of significant impact. The following Zone substation would be directly
impacted for a 132kV or 66kV bus outage:

     •    Gooburrum
     •    Meadowvale
     •    West Bundaberg
     •    East Bundaberg
     •    Central Bundaberg
     •    South Bundaberg
     •    Bargara
     •    Woongarra
     •    Givelda
     •    South Kolan
     •    Bullyard
     •    Monduran
     •    Wallaville

                                                                                                                  page 6
Notice on screening for non-network options; Addressing reliability requirements in the Bundaberg network area.
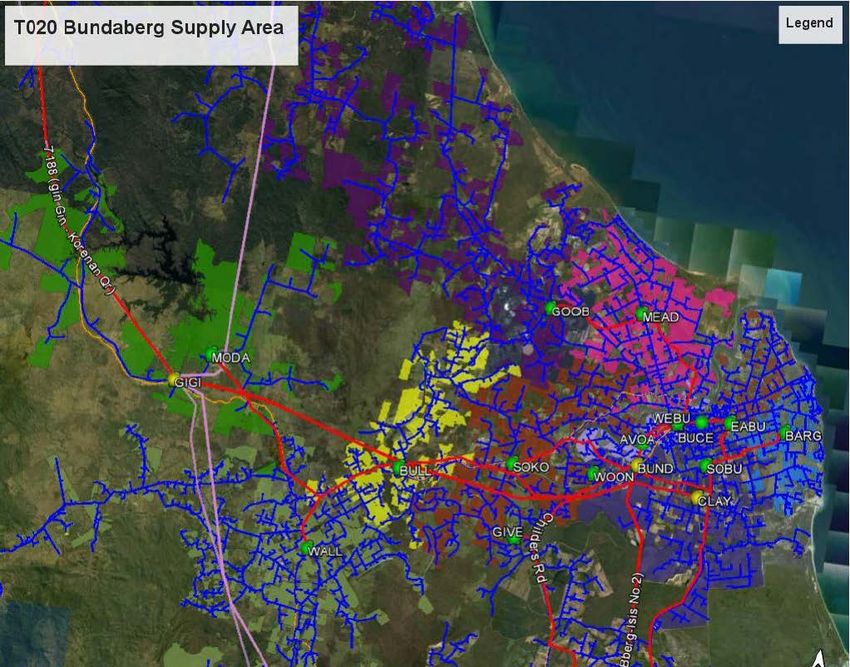
Figure 3 – The supply area of Bundaberg Substation
2.2.3. Loading - historical and forecast
Figure 4 and Figure 5 below show the historical actual demand for T020 Bundaberg with Figure 4
showing the average daily non-winter profile for the top 5 peak days at T020 Bundaberg and
Figure 5 showing the load duration curve at T020 Bundaberg.
Figure 6 shows the 50% probability of exceedance level (50 POE) forecast annual maximum
demand for T020 Bundaberg. Figure 10 shows little load growth forecast out to 2028 and also
displays the maximum allowable unsupplied load for a 2 hour outage window (20 MVA).
page 7Notice on screening for non-network options; Addressing reliability requirements in the Bundaberg network area.
Figure 4 – Bundaberg T020 Load Profile and Capability.
Figure 5 – Bundaberg T020 66kV Load Duration Curve.
page 8Notice on screening for non-network options; Addressing reliability requirements in the Bundaberg network area.
Figure 6 – Bundaberg substation load forecast.
3. Proposed preferred network option is to
establish bus section breakers
The sole credible network option is the establishment of a bus section breaker in the 66kV bus and
132kV bus at Bundaberg Substation and reconfiguring the 66kV bus.
This option includes:
132kV Works including:
• Installation of a new 132kV Bus Section Bay;
• Installation of a new 132kV CB and CT; and
• Installation of supporting structures for CB and CT.
66kV Works including:
• Building a new 66kV Feeder bay behind the AFLC bay;
• Rearrange the 66kV feeders so that West Bundaberg, Sth Kolan, & Sth Bundaberg
feeders split across the two buses;
• Demolish the existing West Bundaberg No.2 feeder bay (retain CB and CTs for bus
section bay);
• Relocate the two (2) bus VTs so these no longer require a bus outage to access;
• Installation of a new 66kV Bus Section Bay;
• Replacing the 66kV galvanised waterpipe with aluminium bus and removal of all aged
bus isolators;
• Removing the existing 66kV overhead strung bu;.
• Installation of supporting foundations, conduits and structures for a new 66kV Feeder
Bay (New Isis feeder opposite the AFLC bay);
• Installation of new VT footings, conduits and structures on Bus 2 at the end of the bus;
• Installation of new 66kV CB and CT footings, conduits and structures for the 66kB Bus
Tie bay;
• Removal of structures and demolishing footing of plant in the existing West Bundaberg
No.2 feeder bay; and
• Installation of new VT footings, conduits and structures on Bus 1in the spare bay
adjacent to the Farnsfield feeder bay.
page 9Notice on screening for non-network options; Addressing reliability requirements in the Bundaberg network area.
This option will increase sectionalising and restoration flexibility that will enable restoration to occur
within the 1 hour safety net limit as prescribed in our Distribution Authority. The estimated capital
cost of the preferred option is $7.3 million. Annual operating costs associated with this new capex
are estimated to be around $36,500 per annum (assumed to be 0.5 per cent of the capital cost).
Ergon Energy estimates that the construction timeline for Option 1 is 17 months, with assumed
commissioning during 2020/21. Ergon Energy intends to commence work on delivering the
preferred option 1 in 2019 (in particular, we intend to commence design in mid-2018 and
commence construction in April 2019).
Overall, this finding confirms the earlier planning assessment exercises undertaken by Ergon
Energy in 2017 that concluded that new bus section circuit breakers at Bundaberg substation is the
most efficient option for replacing addressing the safety net requirements at the Bundaberg zone
substation.
Figure 7 – Bundaberg 132kV proposed CB location
page 10Notice on screening for non-network options; Addressing reliability requirements in the Bundaberg network area. Figure 8 – Bundaberg 66kV proposed CB location and bus re-arrangement. 4. Assessment of non-network solutions 4.1. Required demand management characteristics A viable demand management solution must be capable of reducing the unsupplied load at T020 Bundaberg to
Notice on screening for non-network options; Addressing reliability requirements in the Bundaberg network area.

   160.00
                 BUND T20 132/66kV Substation Load Forecast
   140.00

   120.00
                                                             T020 Forecast load
                                                             Safety Net Max permited unsupplied load
   100.00
Load MVA

      80.00

      60.00

      40.00

      20.00

           0.00
               2018              2020            2022               2024                2026                2028
                                                          Time

Figure 9 – Bundaberg substation forecast and required loading to meet safety net requirements for a 2 hour
restoration.

As load growth is forecast to be relatively flat and there are no load transfer options in the event of
a T020 Bundaberg outage, the shortfall in supply required to meet safety net requirements is
significant with more detail shown below.

                      MW of support       MWh of support               % of year risk             Hours per year
                        required            required                      exists                    risk exists
                          35.5                     71                          50                        4380
                           40                      80                          40                        3504
                           44                      88                          30                        2628
                           48                      96                          20                        1752
                           55                      110                         10                         876

Figure 10 – Bundaberg substation shortfall to meet safety net requirements

To be considered a feasible option, any unsupplied load reduction must be technically feasible,
and commercially feasible.

Ergon Energy estimates that the construction timeline for the preferred option is 17 months, with
assumed commissioning during 2020/21. Ergon Energy intends to commence work on delivering
the preferred option 1 in 2019 (in particular, we intend to commence design in mid-2018 and
commence construction in April 2019). The feasible option must also be able to be implemented in
sufficient time to satisfy the identified reduction need from 2020/21 for deferral of the network
investment.

                                                                                                                   page 12
Notice on screening for non-network options; Addressing reliability requirements in the Bundaberg network area.
4.2. Demand management value
Ergon Energy’s Intelligent Grid Systems Customer Interactions (IGSCI) Team has assessed the
potential demand management options required to defer the network option and to ensure that the
solution is technically and commercially viable, and delivered within the required timeframe. The
amount of demand management support identified to satisfy the reduction need is as per Figure 11
Ergon Energy considered a number of demand management technologies (discussed under
sections 4.2.1 to 4.2.3 of this Report) to determine their commercial and technical feasibility to
assist with the identified need at Bundaberg T20 Bulk Supply Point (BSP).
4.2.1. Demand Management (Demand Reduction)
Energy efficiency and other demand reduction measures such as power factor correction, lighting
etc. have been assessed as not technically viable as a loss of supply at Bundaberg T20 BSP will
result in a loss of power to the whole system. Therefore, reductions in demand will not help to
increase restoration times for the large number of unmet load hours.
4.2.2. Demand response
Four methods utilising demand response technology for deferring network investment for the short
hours of network support required for the network issue at Bundaberg T20 BSP are: call off load
(COL), customers embedded generation (CEG), large scale customer generation (LSG) and
customer solar power systems.
4.2.2.1. Customer Call off load (COL)
COL is an effective technique for deferring network investment where the need is for a short time
period as is the case at Bundaberg T20 BSP where a 1 hour reduction of unserved load is
required.
There are a small number of Large Customers in the Bundaberg area with businesses suited to
call off load. Large customer demand response is valued at $250 per kVA /P.A (excluding
acquisition costs).The potential maximum demand reduction 3MW would have a total cost of
$750,000 P.A including fuel, customer recruitment and establishment costs.
This option has been assessed as technically not viable as it will only defer 5.5% of the identified
capacity requirement.
4.2.2.2. Customer embedded generation (CEG)
CEG is an effective technique for deferring network investment where the need is for a short time
period as is the case at Bundaberg T20 BSP where a 1 hour reduction of unserved load is
required.
page 13Notice on screening for non-network options; Addressing reliability requirements in the Bundaberg network area.
In the Bundaberg region CEG large customer demand response is valued at $50-150 per kVA. P.A
.IGSCI has recorded 14 sites that have existing diesel generation. To acquire an estimated
potential maximum demand reduction value of 6.5MW would have a total cost of $493,000 P.A
including fuel, customer recruitment and establishment costs.
This option has been assessed as technically not viable as it will only defer 30% of the identified
capacity requirement.
4.2.2.3. Large scale customer generation (LSG)
Millaquin Sugar Mill - 5MW Bagasse generator export demand is 2.5MW P.A
Bingera Sugar Mill - 5MW Bagasse generator export demand is 0.75 MW P.A
In the Bundaberg region LSG demand response is valued at $75/kVA P.A. The sugar mills in this
area have a combined maximum generation demand capacity of 3.25MW that could be contracted
at a total cost of $356,000 P.A, including customer recruitment and establishment costs.
Operationally the sugar mills are only seasonally available, the crushing and subsequent
availability of the generators occurring between May and December.
This option could potentially defer 20% of the requirement but has been assessed as technically
not viable as the generation is not available all year and therefore may not contribute to satisfy the
identified reduction need for unsupplied load at Bundaberg T20 BSP.
4.2.2.4. Customer solar power systems
Business customers with large solar arrays are deemed to present a significant opportunity for
targeted load control or load curtailment if coupled with a Battery Energy Storage System (BESS).
Contracting such customers is attractive as they represent a larger load across a fewer customers
and therefore are cheaper and easier to engage and contract.
There are 40 Large Standard Asset Customers (SAC) connected to Bundaberg T20 with
approximately 900kW of export limited PV systems. These systems present a future portfolio
opportunity for potential demand response but currently only a very small percentage of solar
power systems have a BESS. Solar customers without a BESS will not meet the technical needs of
the demand reduction as their solar contribution may not be available when the Network un-met
need is required.
Ergon Energy has not as yet contracted for this type of Demand Response so the maximum CEG
dollar figure of $150/kVA has been used. Maximum estimated potential reduction value available
would be 900kW P.A.at a total cost of $135,000 P.A. plus customer recruitment and establishment
costs.
In terms of the unsupplied load at Bundaberg T20 as a load curtailment opportunity this option is
not technically feasible, the T20 outage failure would lead to the majority of these systems to cease
operating and therefore not contribute to resolving a shortfall in grid supply.
page 14Notice on screening for non-network options; Addressing reliability requirements in the Bundaberg network area.
5. Conclusion
DM measure MW identified % Requirement $/P.A Viable
Demand 0 0 0 N
Reduction
Demand 3 5.5 750,000 N
Response(DR)
COL
DR CEG 6.5 30 493,000 N
DR LSG 3.25 20 356,000 N
DR Solar 0.9 10 135,000 N
Total 13.65 65.5 1734000
Figure 11 – Demand Management options summary
Based on the demand management options considered in Section 4, it is not considered possible
that sufficient demand management measures could be feasibly implemented to achieve the
required demand reduction to make the project deferral technically and economically viable.
Consequently, a Non-Network Options Report has not been prepared in accordance with rule
5.17.4(c) of the National Electricity Rules.
page 15You can also read