Consumer demand for electrification - Mike Risavy, Resource Planning February 27, 2019
←
→
Page content transcription
If your browser does not render page correctly, please read the page content below

Consumer demand for
electrification

Mike Risavy, Resource Planning

February 27, 2019
Agenda for Today

Technological innovation, market development, and an evolving
supply mix are driving a rapid evolution of Ontario’s electricity
sector. Today we’ll explore current and expected challenges and
opportunities emerging through this evolution, including:

• Electricity demand forecast dynamics and electrification
  assumptions
• Case study: electricity growth in the Kingsville-Leamington
  area
• Evolution of Ontario’s electricity market and planning
  products

                                                                2
ELECTRICITY DEMAND
FORECAST DYNAMICS AND
ELECTRIFICATION
ASSUMPTIONS
                        3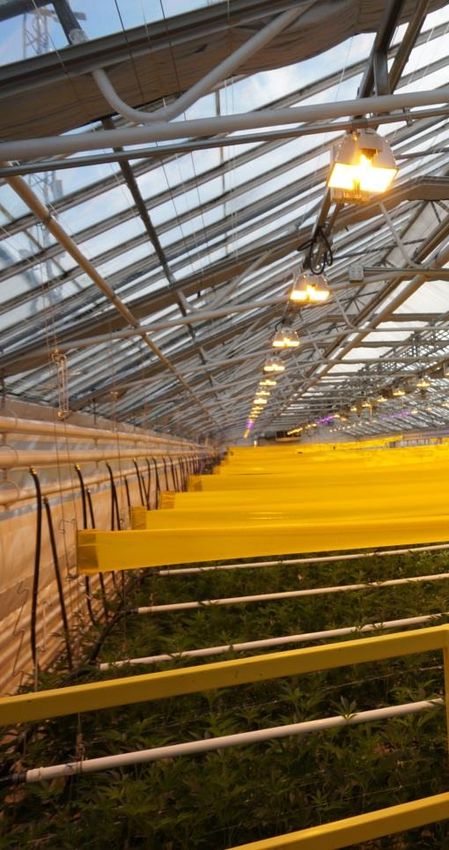
Gross demand gives an indication of number of devices
 that consume electricity

 Distributed Generation                                                     Grid Demand

        Energy                           Codes and
                                                                            Net Demand
       Efficiency                        Standards

Commercial    Electric             Residential   Industrial
Floor Space   Vehicles
                         Transit
                                   Households      Load
                                                              Agriculture   Gross Demand
IESO forecasts growth in gross demand*

                             184

                             181

                             178
Annual Energy Demand (TWh)

                             175

                             172

                             169

                             166

                             163

                             160

                             157

                             154
                                   2018   2020   2022   2024   2026    2028     2030    2032      2034   2036   2038   2040
                                                         Preliminary 2019 Gross Demand Forecast

                 *Preliminary results in draft form                                                                    5
                 Base year: 2017
Net electricity demand declining from impacts of
                             conservation, economic change, distributed generation
                         165

                         160
Annual Energy Demand (TWh)

                         155

                         150

                         145

                         140

                         135

                         130
                               2005        2007    2009        2011        2013   2015       2017

                                                          Embedded Generation      Conservation
                               Grid Level Demand          Net Level Demand         Gross Level Demand

                                                                                                        6
Assumptions driving electrical demand are evolving
2019 preliminary 2019 annual planning outlook – preliminary assumptions*
2016 Ontario
Sector annual planning Years 1 - 5 Years 6 - 10 Years 11 - 21
Planning Outlook
outlook* (2020 - 2024) (2025 - 2029) (2030 - 2040)
Floor space grows by Floor space grows by
1) Commercial floor 736 M sqft, 21.9 % or 587 M sqft, 17.7 % or Floor space grows by Floor space grows by Floor space grows by
1.2 % / yr 1.0 % / yr 202 M sqft, 6.0 % or 150 M sqft, 4.2 % or 359 M sqft, 9.7 % or
space 1.2 % / yr 0.8 % / yr 0.8 % / yr
from 2018 – 2035 from 2018 – 2035
Electric vehicles grows
Electric vehicles grows Electric vehicles grows Electric vehicles grows by
Electric vehicles grows
2) Electric Vehicles by 157 k, 298 % or by 480 k, 92 % or
by 978 k, or 24 % / yr by 825 k, or 21 % / yr 310 k, 147 % or
(EVs) from 2018 – 2035 from 2018 – 2035 31.8 % / yr,
19.9 % / yr,
6.1 % / yr,
to 210 k To 1 M
to 520 k
Households grows by Households grows by Households grows by Households grows by Households grows by
3) Residential
1.0 M, 18 % or 1 % / yr 1.3 M, 24 % or 1.3 % / yr 440 k, 7.8 % or 1.5 % / 375 k, 6.2 % or 1.2 % / 644 k, 10.0 % or
households from 2018 – 2035 from 2018 – 2035 yr yr 0.9 % / yr
Mining sector continues
Flat load
4) Industrial Load from 2018 – 2035
to grow Mining sector continues to grow
from 2018 – 2035
GO Rail electrification GO Rail electrification
& LRT projects as & 7 LRT projects as
GO Rail system
5) Transit planned by 2016 planned by 2016
First 6 LRTs in service electrification as well as No additional projects
+ 548 GWh annual + 1,403GWh annual
2 LRT phases
energy demand energy demand
from 2018 – 2035 from 2018 – 2035
Dramatic increase due Dramatic increase due
to greenhouse load in to greenhouse load in
6) Agriculture Flat load 2.2 TWh Flat load 3.9 TWh Flat load 4.0 TWh
southern Ontario southern Ontario
from 2018 – 2035 in 2029 in 2040
to 4.0 TWh + 0.8 TWh to 3.9 TWh
from 2018 – 2035 in 2024
7
*Preliminary assumptions in draft formResidential, commercial, agricultural, transportation
sectors driving growth in preliminary forecast*
Key Driver Forecast growth from
2019 to 2040 (TWh)
Electric vehicle charging 3.2
Commercial floor space 7.4
Residential dwellings 6.9
Public transit electrification 1.4
Agriculture 0.8
• Structural economic change shifting employment from manufacturing to service
sector results in relatively flat industrial growth expectations
• Modest growth expected from mining sector
• Sensitivity analysis on carbon and energy costs does not result in material changes
to fuel switching for space heating
• Various loads’ peak impacts are different. For example, EV charging demand can be
managed to avoid adding burden to the system peak.
8
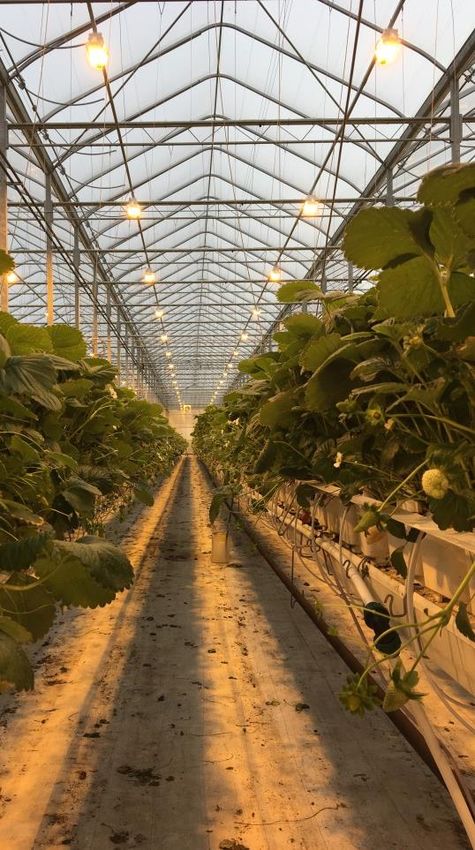
*Preliminary assumptions in draft formCase study: Examples of Artificial Growth Lighting in
Greenhouses
9Case study: Agricultural growth in the Kingsville-
Leamington Area
• Due to forecasted load growth exceeding what had been predicted
in the previous regional planning cycle, a Needs Assessment was
conducted by Hydro One and published in Q4 2017
– Over 500MW of forecast load expected for the Kingsville-Leamington area
versus 170 MW that was forecast in the last cycle
• The majority of the load growth is due to significant greenhouse
expansion in the Kingsville-Leamington area
• An Integrated Regional Resource Plan is recommended due to:
– Potential for non-wires solutions to address the identified needs
– Opportunities to maximize use of end-of-life assets
– Potential reliability impact of local generation reaching contract expiry
– Identify the required mid to long-term plans to meet the growing need
10Electricity demand forecast for Kingsville-Leamington Area
1000
900
Leamington Load Forecast (MW)
800
700
600
500
400
300
Leamington Area Forecast Range
200
Reference Forecast
(limited by step-down station capacity)
100
0
2018 2019 2020 2021 2022 2023 2024 2025 2026 2027 2028 2029
11Case study: Agricultural growth in the Kingsville-
Leamington Area
• Majority of load growth is due to a demand to utilize growth lights
to extend and increase the yield of vegetables and cannabis
– Rough breakdown of load in the agriculture load expected in the area will be
vegetable greenhouses (70%) and cannabis greenhouses (30%)
• The Kingsville-Leamington Area will become winter peaking by
2019 due to growth in demand for vegetable and cannabis
production
– Artificial lighting is used to supplement/act as natural sunlight
– Typical lighting energy intensity for fruits/vegetables with industry standard
technology (High Pressure Sodium lighting) is 1kW/10m2 or ~0.4MW/acre
whereas total non-lighting load is ~0.005-0.015MW/acre
– Cannabis total energy intensity can be greater than 0.8MW/acre due to higher
requirements for HVAC load in addition to lighting loads
12Infrastructure development required for transformational
industry shifts
• When customer demand for electricity surpasses the power system’s
ability to reliably deliver, infrastructure investments are required
• For the electrical demand from greenhouses to materialise, the scope
of infrastructure development extends far beyond the electricity
sector and includes access to water and natural gas, adequate
sanitation lines/sewer system, availability of labour, adequate roads,
etc.
• Demand forecasting based on best knowledge at the time, there’s
potential for growth in other sectors (cloud computing, bitcoin
mining) to grow at faster paces than infrastructure planning cycles
13CHALLENGES AND
OPPORTUNITIES IN AN
EVOLVING SECTOR
14Ontario’s evolving electricity supply
Bruce refurbishment
(2020-2033)
Darlington refurbishment
(2016-2025)
45
Pickering shutdown
(2022/2024)
40
Installed Capacity (GW)
35
Existing resources with expired contracts
30
25
20
Refurbished nuclear
15
10
Existing and committed resources
5
0
2019 2020 2021 2022 2023 2024 2025 2026 2027 2028 2029 2030 2031 2032 2033 2034 2035
15Requirement for capacity expected to emerge in 2023
16An Incremental Capacity Auction (ICA) will enable Ontario
to cost-effectively meet future capacity needs
• Market Renewal is about improving the way electricity is priced,
scheduled and procured in order to meet Ontario’s current and
future energy needs reliably, transparently, efficiently and at lowest
cost
• The Market Renewal Program includes four initiatives that will
enable the province to more efficiently meet demand over the near
and longer terms and including the ICA
• The ICA will improve the way Ontario acquires resources to meet
longer-term supply needs
• A transitional capacity procurement mechanism is being developed
to meet capacity requirements in years prior to the first ICA
commitment period
17Energy adequate even when capacity requirement
emerges
• Even when there is a requirement for capacity, we anticipate no
additional energy production requirement
• Gas-fired generation picks up the slack when demand exceeds
production from lower marginal cost resources such as renewable
and nuclear generation
• When Pickering Nuclear Generating Station retires, gas-fired energy
production is expected to increase
18Surplus baseload generation (SBG) occurs when
production exceeds demand
2019 2020
19SBG is managed through market mechanisms and
expected to decline
14
12
Surplus Baseload Generation
10
8
(TWh)
6
4
2
0
2019 2020 2021 2022 2023 2024 2025 2026 2027 2028 2029 2030 2031 2032 2033 2034 2035
Under Lower Demand Outlook Under Higher Demand Outlook Under Reference Demand Outlook
20The capacity requirement/energy surplus dynamic creates
challenges and opportunities
Given the growing role storage is poised to
play in maintaining system reliability and
Programs, such as the enabling customer resiliency, IESO recently
Industrial Electricity completed Removing Obstacles for Storage
Incentive sought to Resources in Ontario1
encourage Ontario’s storage portfolio includes flow
consumption on off- and solid state batteries, compressed air,
peak hours flywheel, and hydrogen power-to-gas
Past Present Future
The Industrial
Conservation Initiative Electric vehicles and storage
(ICI) program enables offer opportunities to better
industrials to reduce balance the dynamics
their electricity costs by between capacity needs and
reducing demand on energy surpluses, but
the five highest peak requires regulatory, market,
days of the year and infrastructure evolution
21
[1] http://www.ieso.ca/-/media/Files/IESO/Document-Library/engage/esag/Removing-
Obstacles-for-Storage-Resources-in-Ontario_20181219.pdf?la=enEmissions from Ontario’s electricity sector expected to
increase from today and remain far below historic levels
35
30
GHG Emissions (megatonnes CO2e)
25
Historical
20
Reference Outlook
Low Demand Outlook
15 High Demand Outlook
10
5
0
2005 2007 2009 2011 2013 2015 2017 2019 2021 2023 2025 2027 2029 2031 2033 2035
22EVOLUTION OF MARKETS
AND PLANNING PRODUCTS
23Planning products evolving to provide more transparent
information to support market development
• Reliability Outlook: Quarterly report with 18 month horizon,
extends out 60 months biannually to guide maintenance decisions
– Assesses potential adverse conditions that might be avoided through
adjustment or coordination of outage plans
• Planning Outlook: Annual report to provide timely and transparent
information to guide investment decisions and market development
– The 2019 annual planning outlook will inform capacity requirements in
interim capacity acquisition and will be released in Fall 2019
– Timing of future outlooks will coincide with the ICA
• Bulk Planning Process: Effort to formalize the integrated power
system planning process to evolve and respond to changes in
electricity planning and market evolution including implementation
of the ICA
24Stakeholder engagement is essential to the development of
the annual planning outlook
Q3-Q4 2019
• Publication of 2019
annual planning
Q2 2019 outlook
• Public stakeholder • Technical Planning
engagement regarding
February methodology to the
Conference
• Feedback period from 2019 annual planning
stakeholder engagement outlook to provide an
January of at least 10 business understanding of our
• Public stakeholder days existing approach and
engagement of • Incorporate stakeholder methodology
Preliminary 2019 feedback in the 2019 • Inform stakeholders of
Long-Term Demand Long-Term Demand key changes in
Forecast Forecast for Resource approach and
(January 31) Adequacy Assessment methodology, and
(end of February 2019) identify areas where
additional stakeholder
education is required
Ongoing Stakeholder Engagement
25IESO is working with stakeholders to identify insights and
analysis needed to foster market development*
2022
• Incorporation of
bulk planning
2021 process
• Ancillary
Services/Essential • ICA Pre-Auction
2020 Report
Reliability Service
• Zonal Adequacy
Requirements
• Cost Details
2019 (Voltage /
• Avoided Frequency)
• Resource
Costs/Emissions • Detailed
Adequacy Needs
• Natural gas gas/electric
• Nuclear
supply risks interoperability
Refurbishment
Risks • Operability or other fuel risks
Needs (Flexibility
• Marginal Pricing
/ Ramping)
• Reporting of
Transmission
Initiatives and
Activities Ongoing Stakeholder Engagement
26
*Illustrative schedule for discussion purposesTo participate in our engagements or find more
information…
Planning Outlooks
http://www.ieso.ca/Sector-Participants/Engagement-
Initiatives/Engagements/Planning-Outlook
Bulk System Planning
http://www.ieso.ca/en/Sector-Participants/Engagement-
Initiatives/Engagements/Formalizing-the-Integrated-Bulk-System-Planning-
Process
Market Renewal
http://www.ieso.ca/en/Sector-Participants/Market-Renewal/Overview-of-
Market-Renewal
Innovation Roadmap
http://www.ieso.ca/Sector-Participants/Engagement-
Initiatives/Engagements/Innovation-Roadmap
27You can also read