LSL New Build Index - LSL Land & New Homes
←
→
Page content transcription
If your browser does not render page correctly, please read the page content below

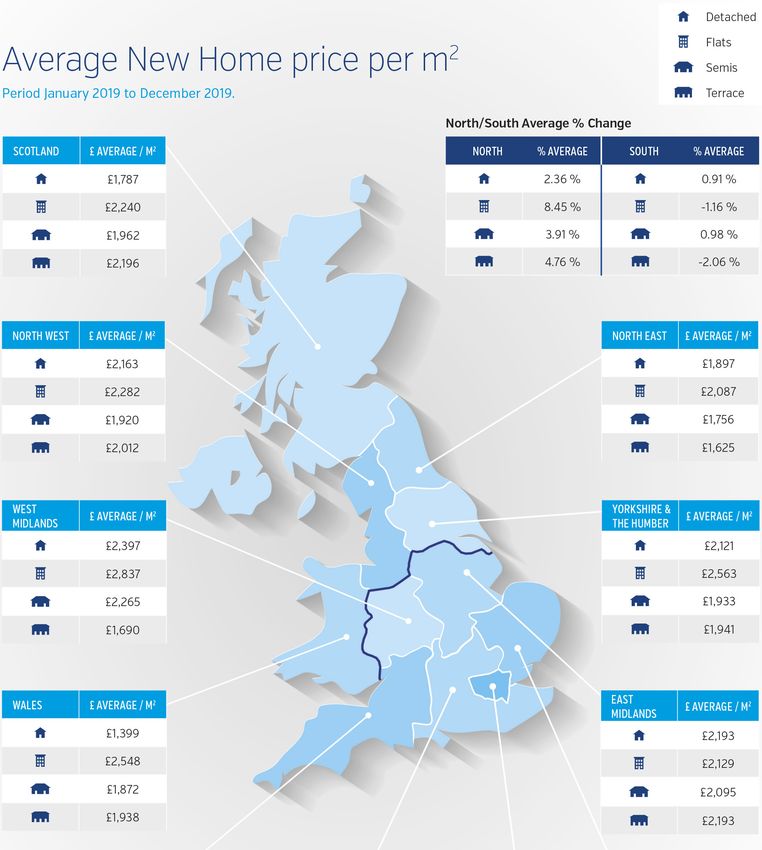
LSL New Build Index
The market indicator for New Builds                                     Jan 2020

In the year to end December 2019 new build prices per m² rose by an average
of 2.03% across the UK...
The Market
The table to the right looks at average
house prices and changes in prices from
the last peak to present day, as well as
taking an average of reported house price
changes over the past year.
The ‘percentage change average’ column
takes the average of annual house price
change data from Na onwide Building
Society, the Office for Na onal Sta s cs
House Price Index and the LSL Acadata
House Price Index. Although this is a
crude average it gives a sense of what the
general feel is for overall house price
movements at regional level, over the past year.
Wales has performed most strongly with 4.7%
growth in prices being recorded, followed by the
North West, West Midlands and and Yorkshire & the
Humber. The North East, East Midlands and South
West are all experiencing modest house price growth
of up to 2%. Although a lot of price varia on is
reported in the London boroughs, the average price
change for London, the South East and the East all
average out at 0%. So it seems likely that high
employment, low interest rates and slow house price
infla on have combined to help avoid a significant
housing market downturn.
The ‘Percentage change from peak’ column takes the
average price high‐point from each region during the
boom which ended in 2007 to 8, according to the            the intervening period.
region lived in. The high‐point is drawn from one of
the average regional house price dataset, in the LSL       Over the period, London’s con nued growth as a
Acadata Regional house price index. The ‘Latest            global financial services centre and the inflow of
average price’ is also taken from the same dataset         wealthy overseas investors and residents are
and the two columns are combined to calculate the          reported to have contributed to this performance.
‘Percentage change from peak’ column. The North            The main concern however, as detailed below, is that
East has seen virtually no change since the last peak      those on average incomes will con nue to struggle to
and Wales fairs a li le be er with 8.9% growth. The
                                                           put down a deposit to buy their first home.
picture seems to be that the closer the region is to
London, the be er it has performed. Yorkshire & the
Humber and the North West are in the 10 to 20%             The Long View
price growth band, the South West, East Midlands
and West Midlands are in the 20 to 30% band and            Con nuing in a similar vein, a report out this month
the East and South East are in the 30 to 40% band.         from Na onwide Building Society looks at House
That just leaves London which has performed twice          Prices and Affordability through the decades. It is
as well as its closest rival with a growth of 71.7% over   interes ng to see the various factors that drive the
                                                               marketplace that we are working in. The 2010’s
                                                               was the weakest decade for house price growth
                                                               since the 1990’s. Average house prices across the
                                                               UK rose by 33% over the 2010’s which is very
                                                               modest when compared the the 1980’s which saw
                                                               a rise of 180%.
                                                              House price growth in the 2010’s has been very
                                                              much a North / South affair with London seeing
                                                              the most growth (at 66%) followed by other South
                                                              based regions, expanding up to the East and West
                                                              Midlands (36 and 33% growth respec vely).
                                                              Outside the South, the average growth nearly
                                                              halves to 17% for Wales, the North West and
                                                              Yorkshire and the Humber.
to house building, home owners and the
                                                              environment. The summit had around 50
                                                              a endees including those from the Government,
                                                              house builders, manufacturers and environmental
                                                              groups. The net zero emissions target by 2050 is
                                                              well known, but the more imminent steps are a
                                                              poten al 31% reduc on in emissions in the new
                                                              2020 part L Building regula ons and the ban on
                                                              gas boilers to heat new homes from 2025, as part
                                                              of the Future Homes Standard.
                                                               The complexi es of delivering more energy
                                                               efficient housing will be easier to manage if they
                                                               are answering a public need, that is to say if the
                                                               public are ‘on board’ with the changes. The HBF
The report goes on to highlight that the low interest      commissioned some research to coincide with the
rates over the decade have helped affordability,            summit from a company called Public First. The
despite the fact that house price growth has               research found that whilst 20% of people put
outstripped earnings growth. Finally, the report looks     environmental concerns in their top three issues
at how long it would take someone in each region, on       facing the country, 54% did not know the EPC ra ng
average earnings, to save a 20% mortgage deposit for       for their own home. Consumers put ‘saving money’
a typical First Time Buyer property, assuming that         over ‘environmental concerns’ and 80% lived in a
they were se ng aside 15% of their income each             home with a gas boiler. Of those polled 67% thought
month. In many of the ‘Northern’ regions the me            new build homes were more energy efficient.
taken is typically in the 5 to 6 year band whilst in       House builders are undoubtedly going to be on the
London and the adjoining regions the me taken is           environment’s side in the future but they will be
closer to the 10 to 15 year band.                          facing consumers who are more concerned with
It seems most likely now that the days of the Help to      saving their money than saving the environment and
Buy scheme are numbered and there is a strong case         who will need to be pulled away from their much
for a more general scheme to help all First Time           loved gas boilers. There will most likely be some root
Buyers (buying both new and second‐hand property)          and branch reforms in the way that new houses are
to help address this issue. A sale to a First Time Buyer   delivered in this decade if these challenges are to be
will frequently create a ‘Homemover’ looking for           met.
their next home and so a chain may well result.            The latest data from Rightmove finds that there has
Housebuilders would have plenty of opportuni es to
sell into this chain and chains would help to address
the issue of a shortage of houses for sale.
Tax disincen ves aimed at the private rented sector
also have issues. Using these to discourage private
landlords from buying will only have effect if First
Time Buyers can afford the mortgage deposit to buy
a property. If the FTB’s aren’t there, then a acking
the private rented sector could result in downward
price pressure which would create further issues.

Current News
A recent summit, hosted by the HBF in
Westminster, highlights a number of issues rela ng
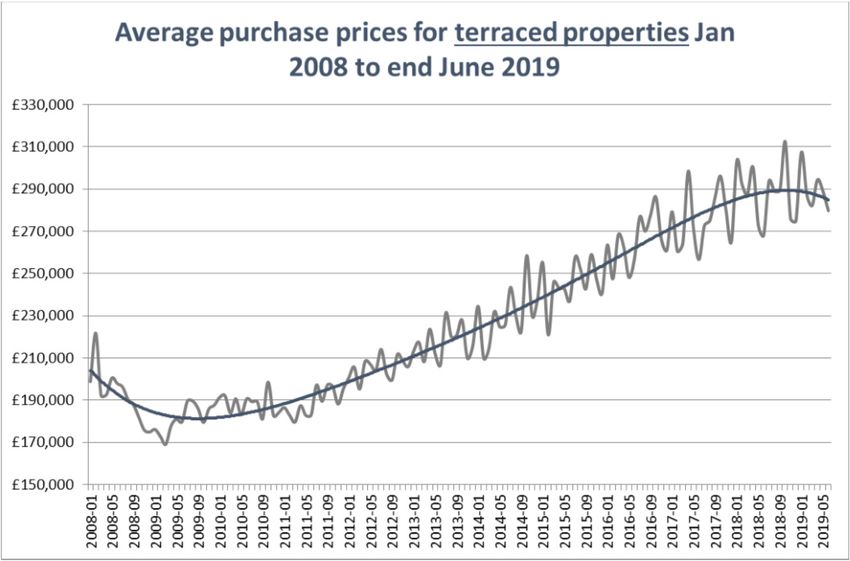
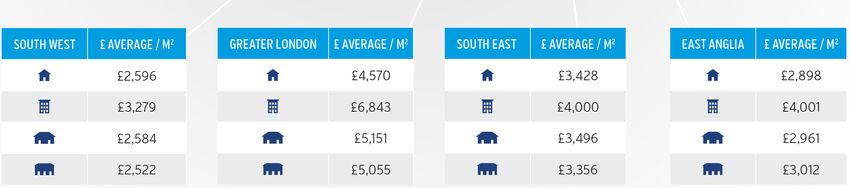
been a 2.3% increase in the price of property coming to
market in the period between 8th December 2019 and
11th January 2020. This seems to be a clear indica on of a
surge of op mism amongst sellers and is the largest
monthly rise recorded by Rightmove at this me of year.
The report also highlights that in the month following the
elec on, enquiries to estate agents were up by 15% on
the same period last year and there was a 7.4% growth in
the number of sales agreed. So the indica ons from
Rightmove at the start of 2020 are good, with the promise
of a buoyant spring housing market.
The January 2019 RICS Housing Market Survey reported
that the year was ge ng off to a slow start with
enquiries, sales and new instruc on all con nuing to fall. In contrast the December 2020 survey, which was
published a er the elec on, reports a rise in sales expecta on in the near and 12 month terms, a rise in enquiries
and sales instruc ons and an expecta on of growing house price infla on. So another well respected source of
housing market informa on is picking up a clear improvement in sen ment amongst both buyers and sellers.
The latest ONS residen al transac ons data is for the period to June 2019 and covers total residen al sales in
England and Wales. In the early 2000’s and in 2006/7 when the market was powering ahead, annual sales volumes
crept over the 1.3 million mark. This figure dropped to the 0.5 to 0.7 million range in the period around 2009 to
2013. The following years have seen a strengthening in sales volumes up towards the 0.9 million mark in 2017 to
2018. The latest figure for the year to June 2019 is at 0.83 million which is a weakening on the preceding years.
Hopefully the above market bounce that is being reported by Rightmove and the RICS will be reflected in a growth
in transac on volumes through 2020 and beyond.

The First Time Buyers Affordability Index above looks at the average selling price of a 70 sq m property, which would typically
be 2 beds in each region. The figures are derived from the selling prices of new build terraced houses and flats across the
regions. These average selling prices for a typical 70 sq m property are then compared with the average earnings in each region
to create the average price to earnings ra o.
The business employs circa 450 chartered
Notes                                                                    surveyors and covers the en re UK.
This Index has been prepared by e.surv using                             LSL Land & New Homes is a trading name of LSL
anonymised data based on a propor on of all                              Land & New Homes Ltd, which is a member of
new build valua ons provided for lending                                 the LSL Property Services Group Estate Agency
purposes. Figures represent 12 month rolling                             Division, one of the leading residen al property
averages for each period. The copyright and all                          services groups in the UK. It’s strategy is to
other intellectual property rights in the Index                          create partnerships with developers and builders
belong to e.surv. Reproduc on in whole or part                           to support their objec ves and add value to their
is not permi ed unless an acknowledgement to                             businesses.
e.surv as the source is included. No modifica on
is permi ed without e.surv’s prior wri en       It can provide integrated solu ons for their
consent.                                        benefit drawing on the exper se of companies
                                                who are also under the LSL Group umbrella
Whilst care is taken in the compila on of the   including valua on services (e.surv), rental
Index no representa on or assurances are made por olio services, asset management services
as to its accuracy or completeness. e.surv      and estate agency services fronted by well‐
reserves the right to vary the methodology and known high street estate agency brands like Your
to edit or discon nue the Index in whole or in  Move and Reeds Rains. Services can be tailored
part at any me.                                 to suite individual needs from bespoke site sales
e.surv (www.esurv.co.uk) is the Valua on        and marke ng, agency referral to the disposal of
business of LSL Property Services plc           part exchange, assisted schemes and new build
(www.lslps.co.uk) and is the UK’s largest       stock, land sales and acquisi ons.
residen al valua on prac ce, ac ng for lenders,
developers, Social Housing organisa ons and
other stakeholders in the residen al property
market.

For further informa on or enquiries regarding the underlying data of the
LSL New Build Index, please contact Shaun Peart via email
Shaun.Peart@lslnewhomes.co.uk or by phoning 07789 948411.
For further informa on about the LSL Property Services Group including
LSL Land & New Homes and e.surv, visit www.lslps.co.uk

Disclaimer: The data is provided by LSL Land & New Homes and is based on data provided as described above. While reasonable skill and
care has been taken in the prepara on of the data – the copyright and all other intellectual property rights of which belong to e.surv
limited ‐ neither e.surv Limited nor LSL Land & New Homes can accept liability for the accuracy or completeness of the data provided.

Reproduc on in whole or part is not permi ed unless an acknowledgment to e.surv Limited is included. No modifica on is permi ed
without e.surv Limited’s prior wri en consent.

No warranty of the figures is given and no responsibility or liability of any nature to you or any third party for the whole or any part of its
content is accepted. It is assumed that you will carry out your own due diligence before proceeding with any proposals or making any

You can also read